. 2021 Apr 26;17(4):e1009552.
doi: 10.1371/journal.ppat.1009552. eCollection 2021 Apr.

Intraspecific variation in immune gene expression and heritable symbiont density

Affiliations

Intraspecific variation in immune gene expression and heritable symbiont density

Holly L Nichols et al. PLoS Pathog. .

Abstract

Host genetic variation plays an important role in the structure and function of heritable microbial communities. Recent studies have shown that insects use immune mechanisms to regulate heritable symbionts. Here we test the hypothesis that variation in symbiont density among hosts is linked to intraspecific differences in the immune response to harboring symbionts. We show that pea aphids (Acyrthosiphon pisum) harboring the bacterial endosymbiont Regiella insecticola (but not all other species of symbionts) downregulate expression of key immune genes. We then functionally link immune expression with symbiont density using RNAi. The pea aphid species complex is comprised of multiple reproductively-isolated host plant-adapted populations. These 'biotypes' have distinct patterns of symbiont infections: for example, aphids from the Trifolium biotype are strongly associated with Regiella. Using RNAseq, we compare patterns of gene expression in response to Regiella in aphid genotypes from multiple biotypes, and we show that Trifolium aphids experience no downregulation of immune gene expression while hosting Regiella and harbor symbionts at lower densities. Using F1 hybrids between two biotypes, we find that symbiont density and immune gene expression are both intermediate in hybrids. We propose that in this system, Regiella symbionts are suppressing aphid immune mechanisms to increase their density, but that some hosts have adapted to prevent immune suppression in order to control symbiont numbers. This work therefore suggests that antagonistic coevolution can play a role in host-microbe interactions even when symbionts are transmitted vertically and provide a clear benefit to their hosts. The specific immune mechanisms that we find are downregulated in the presence of Regiella have been previously shown to combat pathogens in aphids, and thus this work also highlights the immune system's complex dual role in interacting with both beneficial and harmful microbes.


Conflict of interest statement

The authors have declared that no competing interests exist.

Figures

Fig 1
Fig 1. Effects of hosting facultative symbionts on aphid gene expression.
A: Density of lines harboring a Clade 1 (.LSR) and a Clade 2 (.313) strain of Regiella. The y-axis shows the -ΔCT values which can be interpreted on a log2 scale. The average -ΔCT value for each Regiella strain is shown with a grey bar. Statistical significance (t-test) is shown along the top of the figure. B&C: Volcano plots of RNAseq data comparing expression of each expressed gene in the aphid genome, represented by a point in each figure, between aphids with and without Regiella. B and C show this analysis for aphids with a Regiella strain from Clade 1 and Clade 2, respectively. The x-axes show the log2 fold change for each gene, and the y-axis shows the significance of expression. Blue and red dots represent genes that were significantly up- or down-regulated, respectively, at an FDR < 0.05. D: qPCR analysis of gene expression of phenoloxidase 1 (PO1; ACYPI004484) in response to different species of facultative symbionts. The grey dots represent aphids without facultative symbionts, and the colored dots show those with symbiont infections 4 generations after symbiont establishment. The average -ΔCT value for each group is shown with a grey bar. The different symbiont species and strains are shown along the bottom of the figure. The y-axis shows the -ΔCT values of expression, which can be interpreted on a log2 scale. Statistical significance among species or strains (ANOVA & Tukey’s HSD post-hoc analysis) is shown along the top of the figure; the two experiments, which are separated by a vertical line, were analyzed separately. E: Same as panel D but for the gene hemocytin (ACYPI003478).
Fig 2
Fig 2. RNAi knockdowns and Regiella density.
A: Validation of the RNAi knockdown for PO1 in 1st instar aphids. The y-axis shows -ΔCT values of expression, which can be interpreted on a log2 scale. Collection time-points (72 hours or 8 days) and treatment are shown along the bottom of the figure; the two Regiella strains are represented by different colors as shown in the key. Grey bars show the mean of each treatment group, with biological replicates shown as points. Statistical significance (2-way ANOVA & Tukey’s HSD post-hoc analysis) among treatment groups (lacZ vs. PO1) is shown along the top of each plot, with an *, **, or *** indicating altered gene expression at p < 0.05, p < 0.01, or p < 0.001, respectively. Significance among Regiella genotypes (.LSR vs .313) is shown along the right side of each plot. B: Regiella density after knockdown of aphids injected as 1st instars. The y-axis shows -ΔCT values of symbiont density, which can be interpreted on a log2 scale. Time-points, treatment, Regiella strain, and statistical significances (2-way ANOVA & Tukey’s HSD post-hoc analysis) are indicated as in A. C: Validation of the RNAi knockdown for PO1 in adult aphids. Y-axes are as above, treatment is shown along the bottom of the figures, with lacZ and PO1 dsRNA-injected aphids represented by grey and purple dots, respectively. Grey gars shown mean expression for a treatment. The left panel shows expression of PO1, and the right panel shows expression of the other copy of phenoloxidase in the aphid genotype (PO2). Statistical significances (t-tests) are shown as above. D: Knock-down validation of hemocytin. E: Regiella density after knockdown of aphids injected as adults. Grey, purple, and green points represent different treatments (lacZ, PO1, and hemocytin dsRNA injections, respectively). The y-axis shows Regiella density measured by -ΔCT values as above.
Fig 3
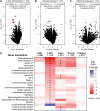
Fig 3. Gene expression across aphid biotypes.
A-C: Volcano plots of expression data comparing control vs. Regiella-infected aphids. Each expressed gene in the aphid genome is represented by a point. The x-axes show the log2 fold change of each gene, with points to the right side of each plot indicating increased expression in the presence of symbionts, and points to the left showing decreased expression. The y-axes show the -log10 of the p-values indicating statistical significance of each gene’s expression change. Colored points are those where the expression change was found to be statistically significant at FDR < 0.05. Panels A, B, and C show plots for the Lotus, Ononis, and Trifolium genotypes respectively, as shown along the top of the figures. D: A heat-map comparing gene expression in response to Regiella strain .313 infection across host genotypes. The 22 differentially expressed genes identified in the LSR1 transcriptome, above, are listed to the left of the figure. Colors represent the log2 fold change of these genes in response to Regiella as indicated in the key to the right of the figure (with red panels representing a decrease in expression, and blue indicating an increase in expression). The five transcriptomes generated in this study are shown in each column, as indicated at the top of the figure. Statistical significance of each gene is indicated by an asterisk at an FDR < 0.05.
Fig 4
Fig 4. Regiella density and immune gene expression in F1 hybrid lines.
A: Diagram of the crossing scheme. B: Regiella density in parental and F1 lines. The y-axis shows the -ΔCT values reflecting Regiella density, which can be interpreted on a log2 scale. The genotypes are shown along the bottom of the figure; the letters represent different replicate lines of each direction of the F1 cross. Each biological replicate, representing an independently injected aphid + Regiella line, is shown by a colored point, with the means for each genotype shown with grey bars. Significance groups (ANOVA & Tukey’s HSD post-hoc analysis) are shown along the top of the figure at p < 0.05. C: Immune gene expression in lines with and without Regiella. The y-axis of each plot shows -ΔCT values (qPCR output) of gene expression. Aphid genotype is shown along the bottom of each figure. Each biological replicate (an independently injected line) is shown by a colored point, with lines harboring Regiella indicated by a dark black outline as indicated in the legend. Statistical significance (2-way ANOVA & post-hoc analysis) is shown with light grey lines: at the top of the figures, the interaction term between Regiella presence/absence and host genotype is indicated with an *, **, or *** indicating that two genotypes differ in the extent to which Regiella altered gene expression at p < 0.05, p < 0.01, or p < 0.001, respectively. Within genotypes, whether Regiella significantly altered gene expression is shown with a vertical grey bracket.

Similar articles

Cited by

References

    1. Hilgenboecker K, Hammerstein P, Schlattmann P, Telschow A, Werren JH. How many species are infected with Wolbachia?—A statistical analysis of current data. FEMS Microbiol Lett. 2008;281(2):215–20. Epub 2008/03/04. 10.1111/j.1574-6968.2008.01110.x - DOI - PMC - PubMed
    1. Moran NA, McCutcheon JP, Nakabachi A. Genomics and evolution of heritable bacterial symbionts. Annu Rev Genet. 2008;42:165–90. Epub 2008/11/06. 10.1146/annurev.genet.41.110306.130119 . - DOI - PubMed
    1. Ferrari J, Vavre F. Bacterial symbionts in insects or the story of communities affecting communities. Philos Trans R Soc Lond B Biol Sci. 2011;366(1569):1389–400. Epub 2011/03/30. 10.1098/rstb.2010.0226 - DOI - PMC - PubMed
    1. Hawlena H, Rynkiewicz E, Toh E, Alfred A, Durden LA, Hastriter MW, et al.. The arthropod, but not the vertebrate host or its environment, dictates bacterial community composition of fleas and ticks. ISME J. 2013;7(1):221–3. Epub 2012/06/29. 10.1038/ismej.2012.71 - DOI - PMC - PubMed
    1. Chandler JA, Lang JM, Bhatnagar S, Eisen JA, Kopp A. Bacterial communities of diverse Drosophila species: ecological context of a host-microbe model system. PLoS Genet. 2011;7(9):e1002272. Epub 2011/10/04. 10.1371/journal.pgen.1002272 - DOI - PMC - PubMed

Publication types

MeSH terms

LinkOut - more resources