. 2021 Jan-Jun:296:100707.
doi: 10.1016/j.jbc.2021.100707. Epub 2021 Apr 24.

CtIP suppresses primary microRNA maturation and promotes metastasis of colon cancer cells in a xenograft mouse model

Affiliations

CtIP suppresses primary microRNA maturation and promotes metastasis of colon cancer cells in a xenograft mouse model

Jianping Ren et al. J Biol Chem. 2021 Jan-Jun.

Abstract

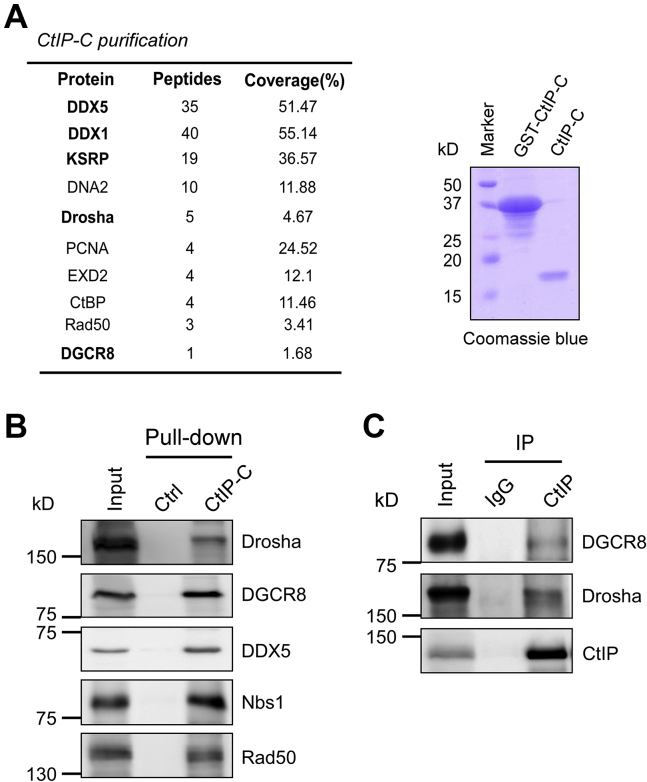
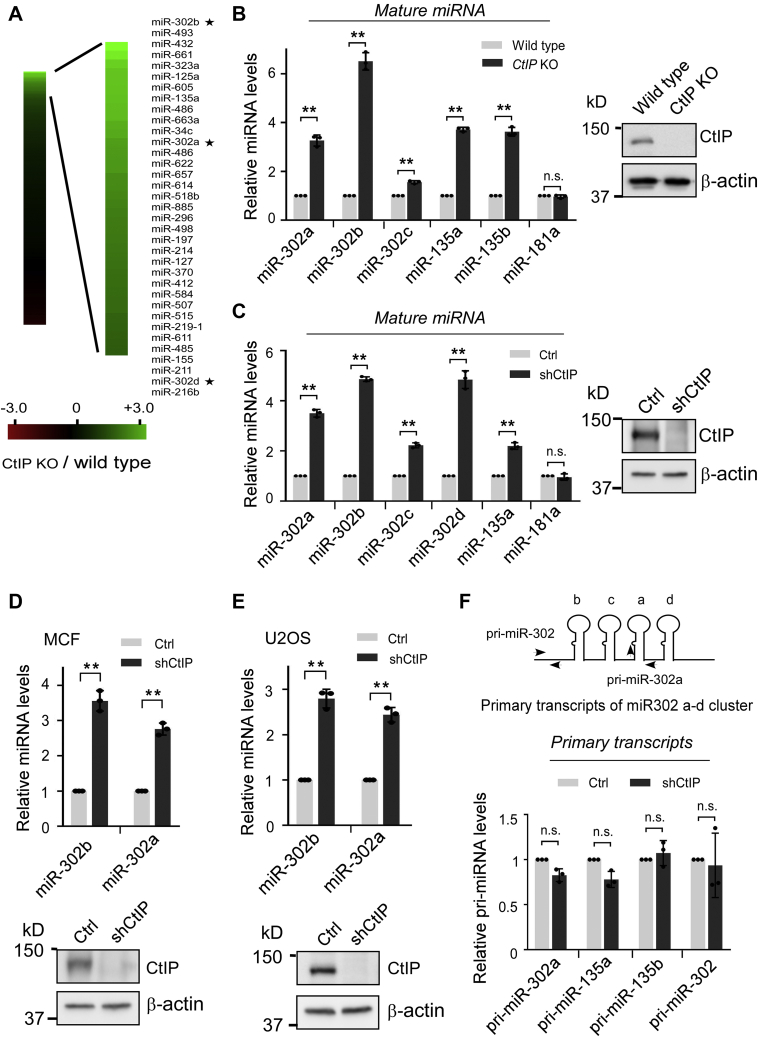
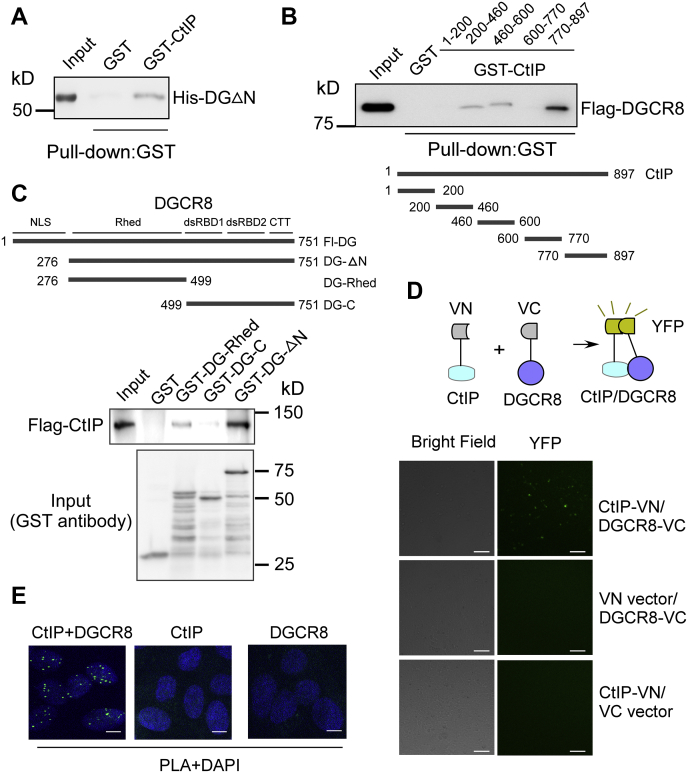
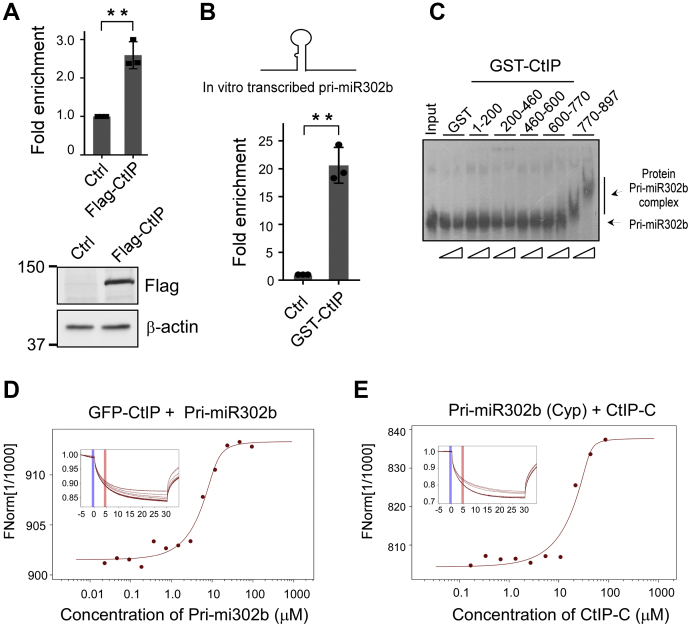
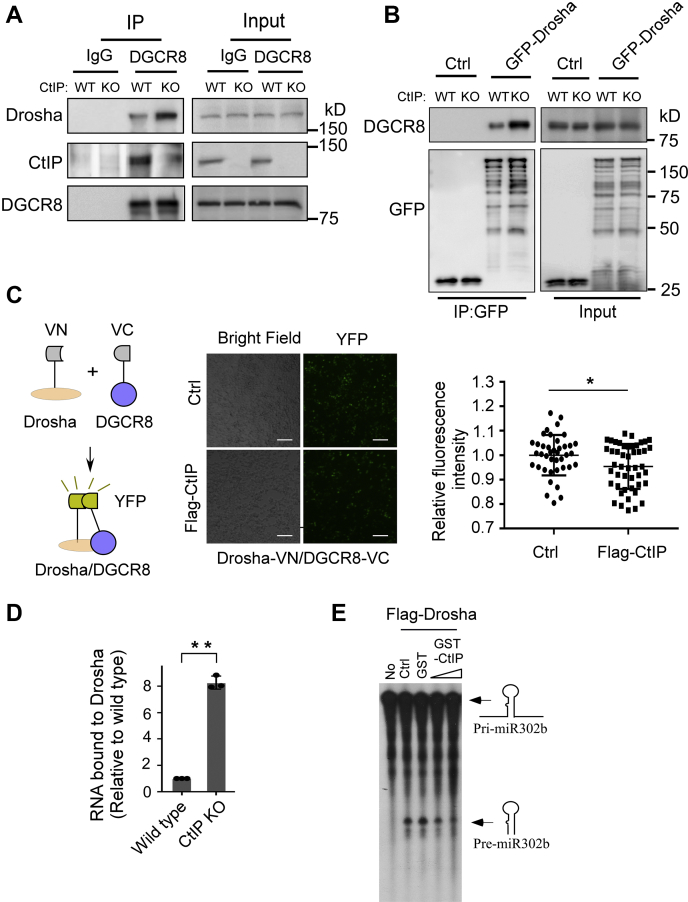
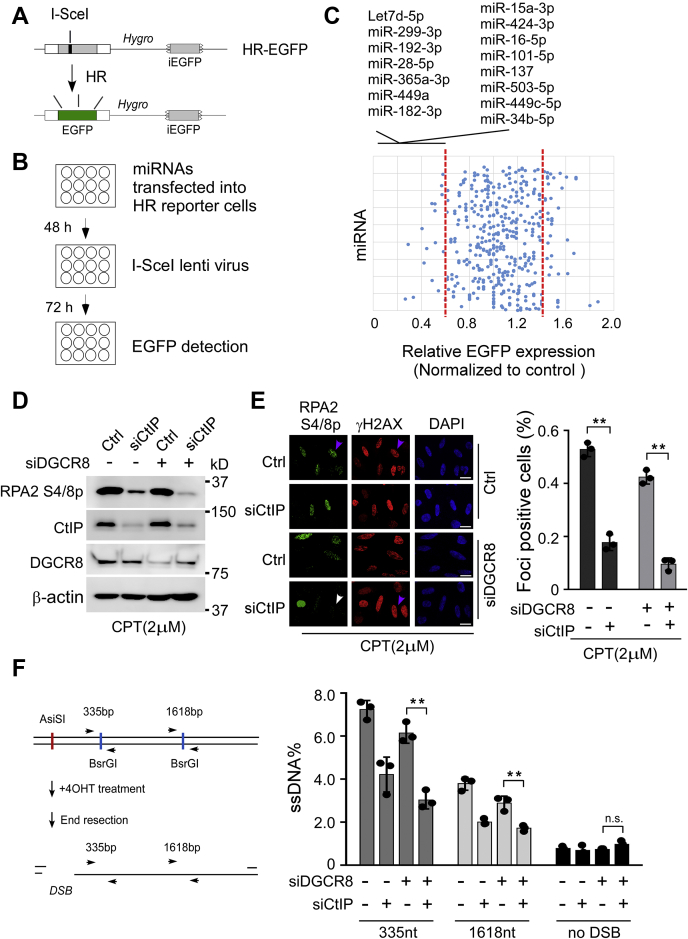
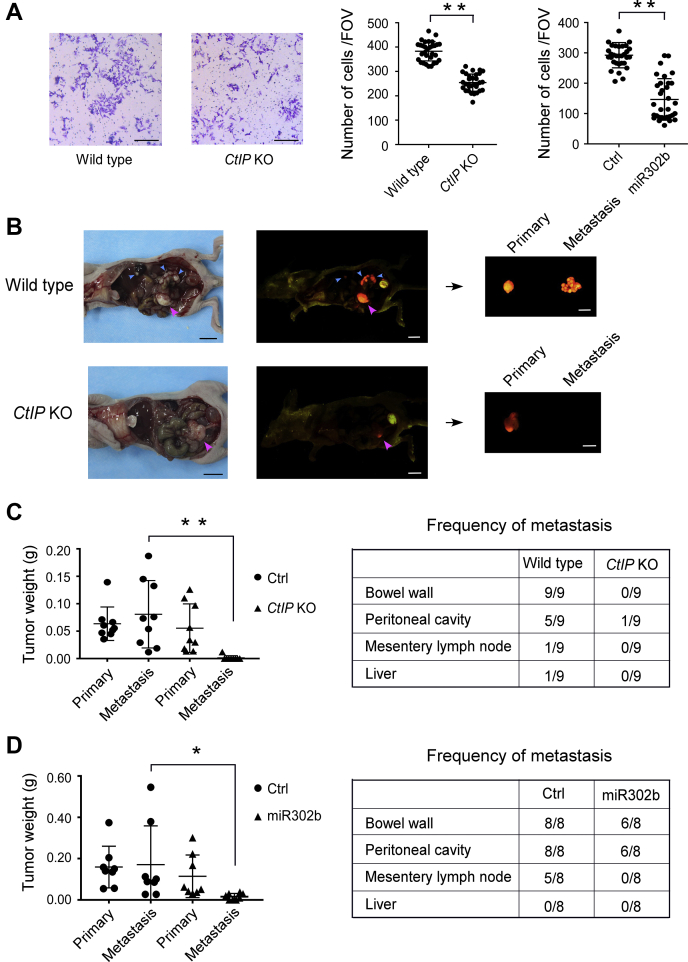
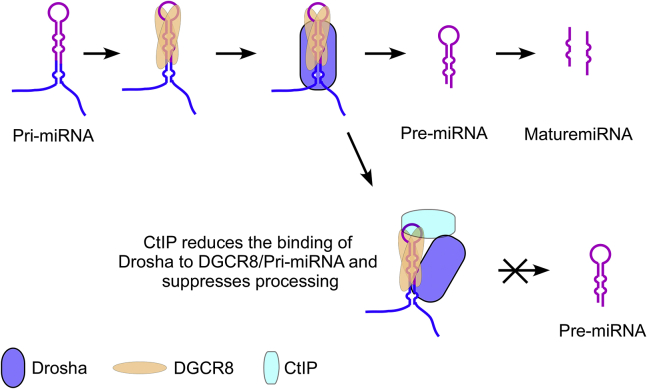
miRNAs are important regulators of eukaryotic gene expression. The post-transcriptional maturation of miRNAs is controlled by the Drosha-DiGeorge syndrome critical region gene 8 (DGCR8) microprocessor. Dysregulation of miRNA biogenesis has been implicated in the pathogenesis of human diseases, including cancers. C-terminal-binding protein-interacting protein (CtIP) is a well-known DNA repair factor that promotes the processing of DNA double-strand break (DSB) to initiate homologous recombination-mediated DSB repair. However, it was unclear whether CtIP has other unknown cellular functions. Here, we aimed to uncover the roles of CtIP in miRNA maturation and cancer cell metastasis. We found that CtIP is a potential regulatory factor that suppresses the processing of miRNA primary transcripts (pri-miRNA). CtIP directly bound to both DGCR8 and pri-miRNAs through a conserved Sae2-like domain, reduced the binding of Drosha to DGCR8 and pri-miRNA substrate, and inhibited processing activity of Drosha complex. CtIP depletion significantly increased the expression levels of a subset of mature miRNAs, including miR-302 family members that are associated with tumor progression and metastasis in several cancer types. We also found that CtIP-inhibited miRNAs, such as miR-302 family members, are not crucial for DSB repair. However, increase of miR-302b levels or loss of CtIP function severely suppressed human colon cancer cell line tumor cell metastasis in a mouse xenograft model. These studies reveal a previously unrecognized mechanism of CtIP in miRNA processing and tumor metastasis that represents a new function of CtIP in cancer.

Keywords: CtIP; DGCR8; Drosha; metastasis; microRNA maturation; microprocessor.


Conflict of interest statement

Conflict of interest The authors declare that they have no conflicts of interest with the contents of this article.

Figures

Figure 1
Figure 1
CtIP interacts with Drosha complex.A, left, mass spectrometry identification of CtIP-C–associated protein. Right, Coomassie blue staining of SDS-PAGE gel indicating purified proteins. B, pull-down experiments were performed by incubating 293T cell lysates with purified GST-CtIP-C fusion protein, followed by immunoblotting using indicated antibodies. C, anti-CtIP immunoprecipitation (IP) was performed, followed by Western blot analysis using indicated antibodies. CtIP, C-terminal-binding protein–interacting protein.
Figure 2
Figure 2
CtIP suppresses Drosha-mediated pri-miRNA processing.A, depletion of CtIP promotes the expression of a subset of miRNAs. Total RNAs from control and CtIP-KO cells were subjected to miRNA-profiling analysis using Cancer miRNA quantitative PCR array. Green and red on the heat map indicate a decrease and increase in miRNA levels, respectively, and the color intensity corresponds to relative signal levels. A portion of upregulated miRNAs in CtIP-KO cells is indicated. The stars indicated miR-302 family members. B, expression levels of mature miRNAs in wildtype and CtIP-KO cells were verified by quantitative PCR. CE, expression levels of indicated miRNAs were examined in HCT116 (C), MCF7 (D), or U2OS (E) cells expressing CtIP shRNA or vector control. Western blots showing CtIP expression. F, expression levels of indicated pri-miRNAs were examined in HCT116 cells expressing CtIP shRNA or vector control. The primer sets used for pri-miR-302 cluster and pri-miR302a detection are shown at the top. In the BF panel, the data represent the means ± SD of three independent experiments. The p value is indicated as ∗∗p < 0.01. CtIP, C-terminal-binding protein–interacting protein; HCT116, human colon cancer cell line; ns, not significant; MCF7, Michigan Cancer Foundation-7; pri-miRNA, miRNA primary transcripts; U2OS, human osteosarcoma cell line.
Figure 3
Figure 3
Direct interaction of CtIP with GDCR8.A, the direct interaction between CtIP and DGCR8 was shown using a GST pull-down assay. B, pull-down experiments were performed by incubating lysates prepared from insect cells infected with Flag-DGCR8 baculoviruses with different purified GST-CtIP fragments. C, pull-down experiments were performed by incubating lysates prepared from insect cells infected with Flag-CtIP baculoviruses with different purified GST-DGCR8 fragments. D, 293T cells were cotransfected with CtIP-VN and DGCR8-VC. Reconstituted YFP fluorophore was visualized via total internal reflection fluorescence microscope at 24 h after transfection. Top, schematic of BiFC system. Bottom, representative fluorescence images of CtIP and DGCR8 interaction in cells. The scale bars represent 100 μm. E, detection of CtIP–DGCR8 colocalization was performed using a PLA probe in U2OS cells. Representative PLA foci (green) are shown. The scale bars represent 10 μm. CtIP, C-terminal-binding protein–interacting protein; GDCR8, DiGeorge syndrome critical region gene 8; GST, glutathione-S-transferase; U2OS, human osteosarcoma cell line; PLA, proximity ligation assay; VC, Venus C-terminal fragment; VN, Venus N-terminal fragment.
Figure 4
Figure 4
CtIP binds to pri-miRNA via Sae2-like domain.A, anti-Flag RNA-ChIP was performed in HCT116 cells expressing Flag-CtIP or empty vector using pri-miR302 primer sets. The ChIP value in the control was set as 1 for normalization. Data represent the means ± SD of three independent experiments. The p value is indicated as ∗∗p < 0.01. B, in vitro–transcribed pri-miR302b was mixed with bead-immobilized GST-CtIP full-length protein. RNA was eluted from beads and subjected to quantitative RT-PCR analysis using pri-miR302b primer sets. Data represent the means ± SD of three independent experiments. The p value is indicated as ∗∗p < 0.01. C, electrophoretic mobility shift assay was performed with GST alone or indicated GST-CtIP variants using an in vitro–transcribed 32P-labeled pri-miR302b probe. The band shifts resulting from specific binding to the CtIP variant are shown. D and E, microscale thermophoresis analysis showing pri-miR302b interacted with CtIP in vitro. Titration of cell lysates containing pri-miR302b in vitro–transcribed to a constant amount of GFP-CtIP or purified CtIP-C protein to Cyp-labeled pri-miR302b induced a pronounced microscale thermophoresis signal change and yielded Kd = 3.94 μM (D) and Kd = 2.39 μM (E), respectively. ChIP, chromatin immunoprecipitation; CtIP, C-terminal-binding protein–interacting protein; GST, glutathione-S-transferase; HCT116, human colon cancer cell line; pri-miRNA, miRNA primary transcripts.
Figure 5
Figure 5
CtIP weakened the binding of Drosha with DGCR8 and RNA substrates.A, coimmunoprecipitation of Drosha and DGCR8 was performed in wildtype HCT116 cells and CtIP-KO cells using anti-DGCR8 antibody. B, coimmunoprecipitation between GFP-Drosha and DGCR8 was performed in wildtype HCT116 cells and CtIP-KO cells expressing GFP-Drosha or empty vector using anti-GFP antibody. C, 293T cells cotransfected with Drosha-VN and DGCR8-VC, along with Flag-CtIP or control vector, fluorescent images were taken at 24 h after transfection. The scale bars represent 100 μm. The chart showed the cell fluorescence quantified by ImageJ. Data represent the means ± SD. The p value is indicated as ∗p < 0.05. D, RNA-ChIP analysis of association between Drosha and pri-miR302b was performed in wildtype HCT116 cells and CtIP-KO cells using anti-Drosha antibody and pri-miR302b primer sets. The ChIP value in wildtype cells was set as 1 for normalization. Data represent the means ± SD of three independent experiments. The p value is indicated as ∗∗p < 0.01. E, in vitro pri-miRNA processing assay was performed by incubating pri-miR302b substrate with immunoprecipitated Flag–Drosha complex in the presence or absence of recombinant GST-CtIP protein. ChIP, chromatin immunoprecipitation; CtIP, C-terminal-binding protein–interacting protein; DGCR8, DiGeorge syndrome critical region gene 8; HCT116, human colon cancer cell line; pri-miRNA, miRNA primary transcripts; VC, Venus C-terminal fragment; VN, Venus N-terminal fragment.
Figure 6
Figure 6
CtIP-dependent miRNAs are not essential for HR.A, diagram showing the function of the EGFP-HR DSB repair reporter. B, schematic of HR assays workflow. U2OS cells carrying EGFP-HR reporter were transfected with synthesized miRNA mimics; DSB was induced by I-SceI–containing lentivirus, and EGFP-positive signals were analyzed by flow cytometry (fluorescence-activated cell sorting). C, scatter plot showing the relative levels of EGFP-HR reporter after all individual miRNAs mimicked transfection. HR value in miRNA control mimic-transfected cells was set as 1 for normalization. The dotted line represents the cutoff used to determine decreased and increased HR. MiRNAs that suppressed HR efficiency are indicated at the top. DF, end resection function of CtIP is DGCR8 independent. D and E, U2OS cells were transfected with indicated siRNA or siRNA combination, treated with CPT (2 μM) for 1 h followed by RPA phosphorylation analysis by Western blotting (D) and RPA foci formation analysis by immunostaining (E) with indicated antibodies. E, the pink and white arrows indicate representative RPA2 and γH2AX foci-positive and foci-negative cells, respectively. The scale bars represent 10 μm. The percentage of RPA2 foci–positive cells among γH2AX-positive cells for each sample is shown. Data shown represent the means of three independent experiments, with error bars as SD. The p value is indicated as ∗∗p < 0.01. F, schematic and quantification of a quantitative PCR–based cellular resection assay of ER-AsiSI U2OS cells transfected with indicated siRNA or siRNA combination. Data represent the means ± SD of three independent experiments. The p value is indicated as ∗∗p < 0.01. CtIP, C-terminal-binding protein–interacting protein; DGCR8, DiGeorge syndrome critical region gene 8; DSB, DNA double-strand break; EGFP, enhanced GFP; HR, homologous recombination; n.s., not significant; RPA, replication protein A; U2OS, human osteosarcoma cell line.
Figure 7
Figure 7
Depletion of CtIP or overexpression of miR-302b suppresses invasion and metastasis of colon cancer cells.A, Matrigel invasion assays were performed using the indicated cells. Left, representative micrographs for the CtIP-KO and wildtype cells. The scale bars represent 100 μm. Right, quantification of the numbers of invasive cells per field of view (FOV). Data represent mean ± SD. The p values are indicated as ∗∗p < 0.01. B, left, representative photographs and corresponding fluorescence images of orthotopic RFP colon colorectal cancer nude-mouse model autopsies of the control and CtIP-KO groups. Pink and blue arrows indicate primary and metastatic tumors, respectively. Right, fluorescence images of collected primary and metastatic tumors. The scale bars represent 1 cm. C, quantification of tumor weights (left) and frequency of metastases (right) in control and CtIP-KO groups. Data represent mean ± SD. The p values are indicated as ∗∗p < 0.01. D, quantification of tumor weights (left) and frequency of metastases (right) in control and miR-302b–overexpression groups. Data represent mean ± SD. The p values are indicated as ∗p < 0.05. CtIP, C-terminal-binding protein–interacting protein.
Figure 8
Figure 8
A model description of the role of CtIP in pri-miRNA processing (seeDiscussionsection). CtIP, C-terminal-binding protein–interacting protein; pri-miRNA, miRNA primary transcripts.

Similar articles

Cited by

References

    1. Ghildiyal M., Zamore P.D. Small silencing RNAs: An expanding universe. Nat. Rev. Genet. 2009;10:94–108. - PMC - PubMed
    1. Bartel D.P. MicroRNAs: Target recognition and regulatory functions. Cell. 2009;136:215–233. - PMC - PubMed
    1. Huntzinger E., Izaurralde E. Gene silencing by microRNAs: Contributions of translational repression and mRNA decay. Nat. Rev. Genet. 2011;12:99–110. - PubMed
    1. Kim V.N., Han J., Siomi M.C. Biogenesis of small RNAs in animals. Nat. Rev. Mol. Cell Biol. 2009;10:126–139. - PubMed
    1. Lee Y., Kim M., Han J., Yeom K.H., Lee S., Baek S.H., Kim V.N. MicroRNA genes are transcribed by RNA polymerase II. EMBO J. 2004;23:4051–4060. - PMC - PubMed

Publication types

LinkOut - more resources