. 2021 May;593(7860):597-601.
doi: 10.1038/s41586-021-03536-w. Epub 2021 Apr 26.

Small-molecule inhibition of METTL3 as a strategy against myeloid leukaemia

Affiliations

Small-molecule inhibition of METTL3 as a strategy against myeloid leukaemia

Eliza Yankova et al. Nature. 2021 May.

Abstract

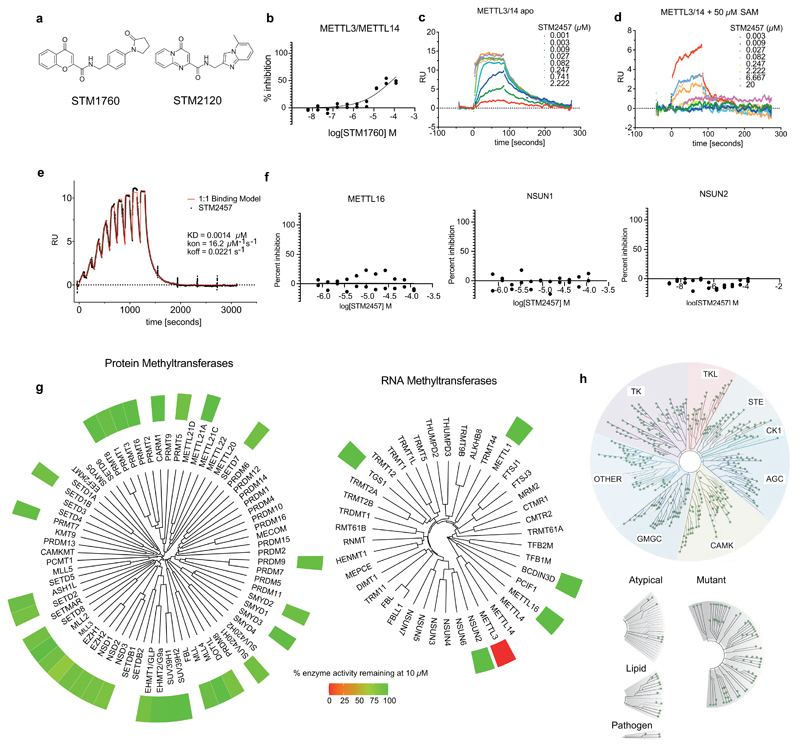
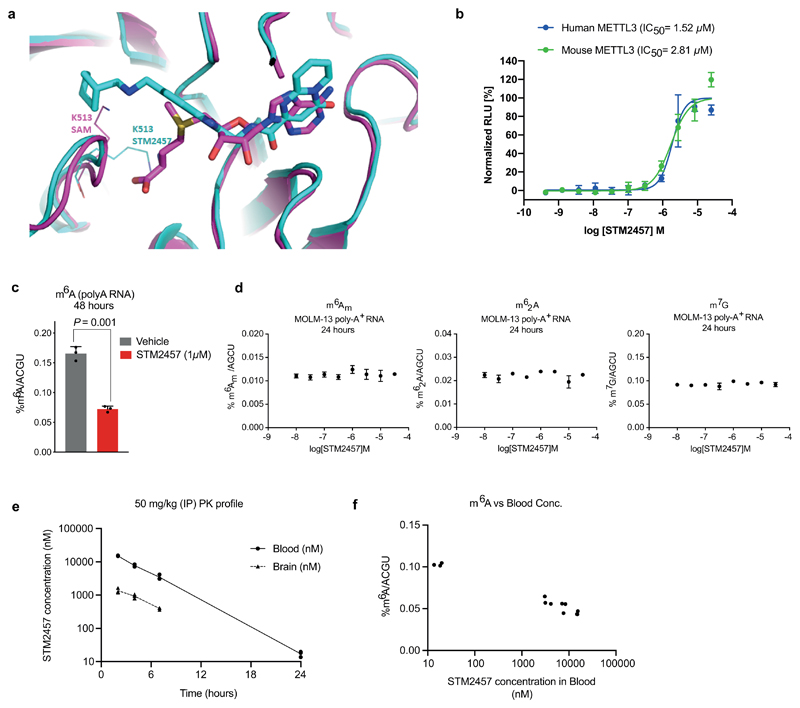
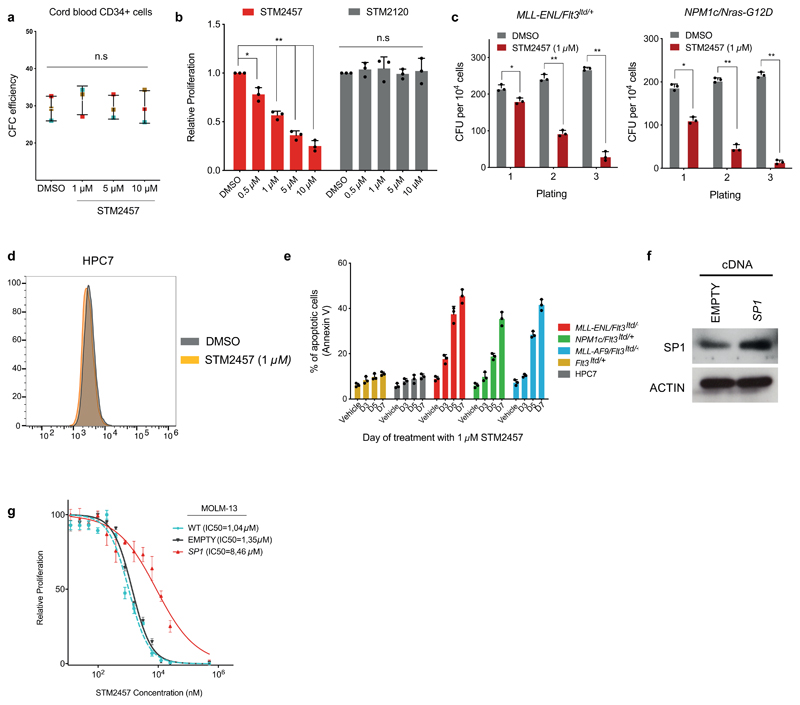
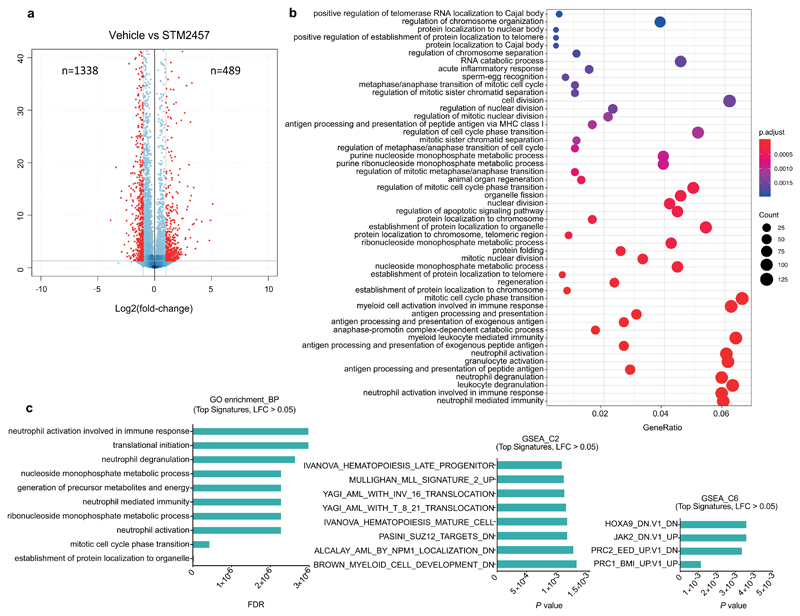
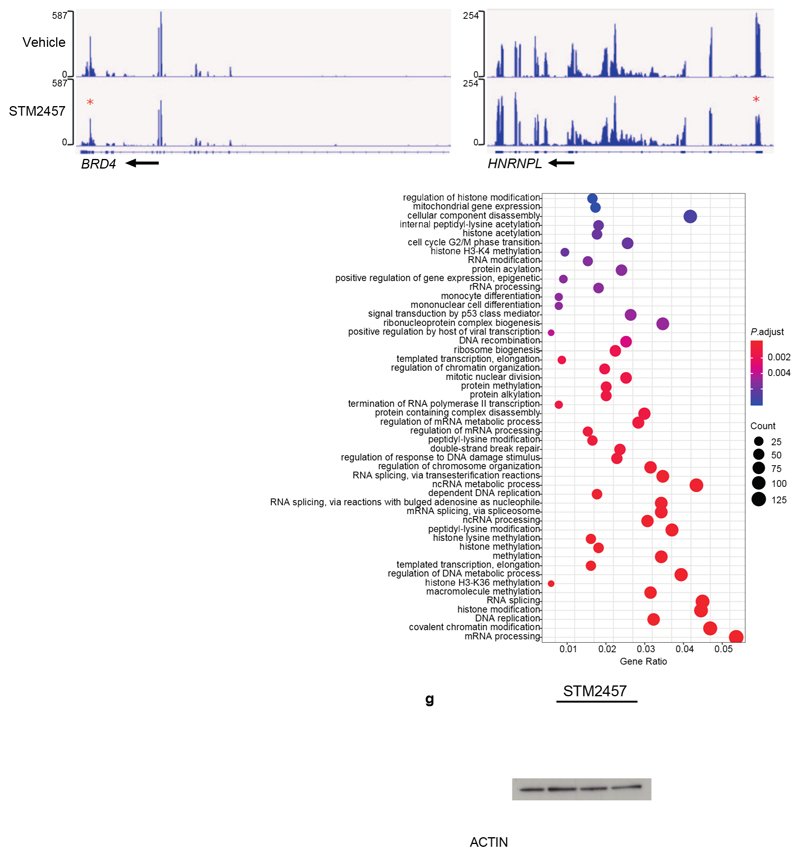
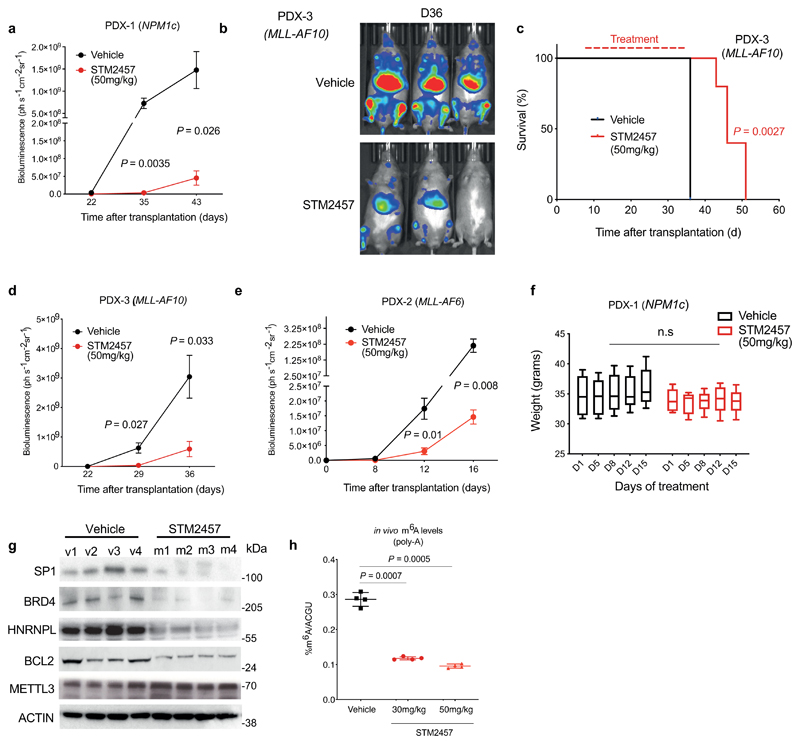
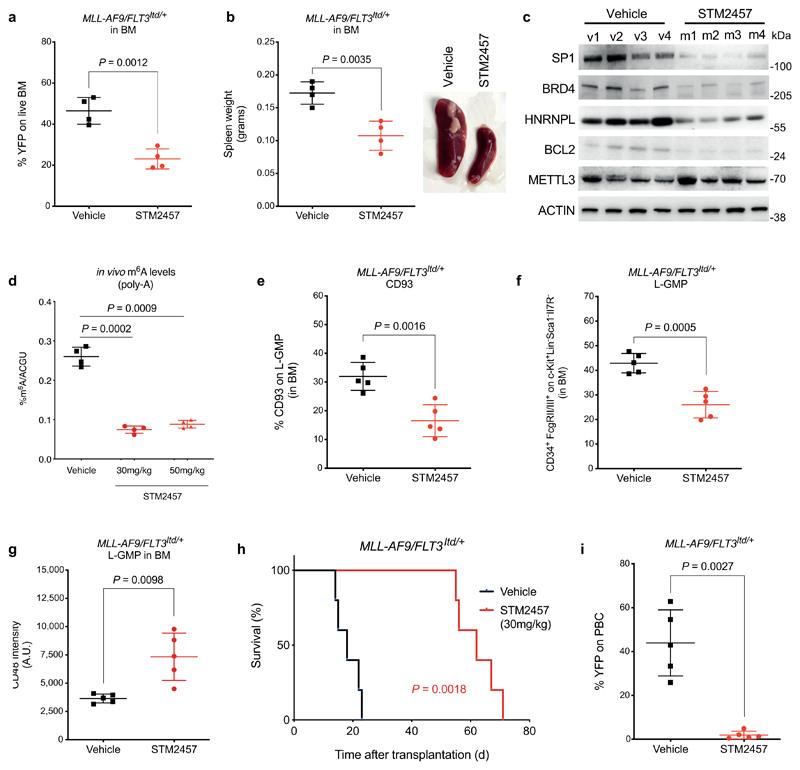
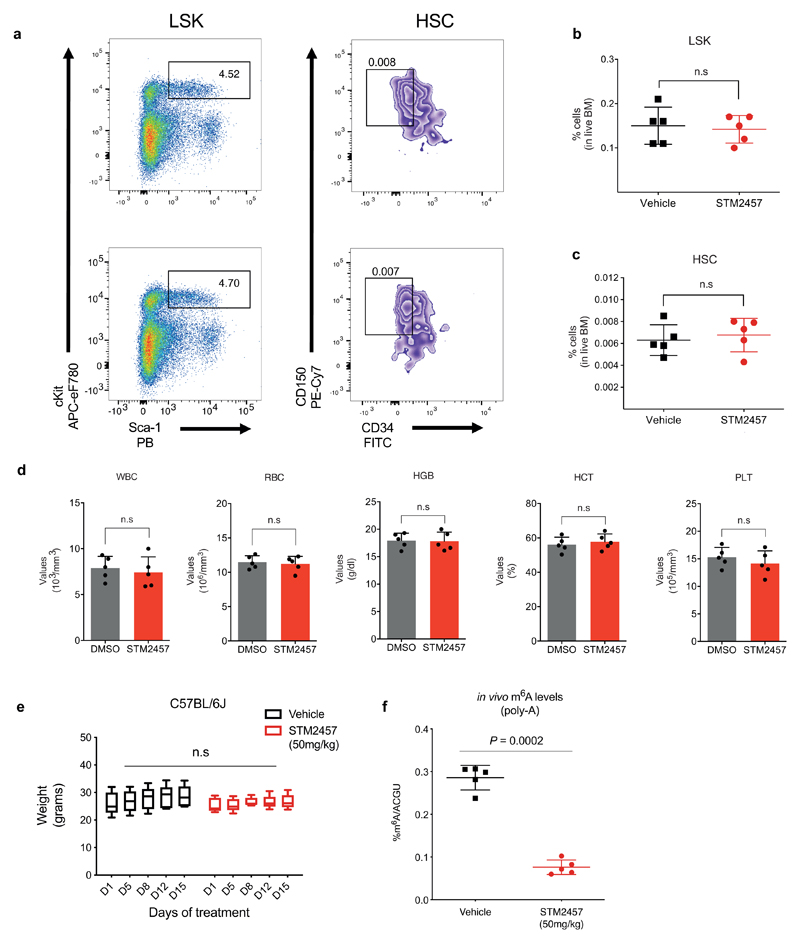
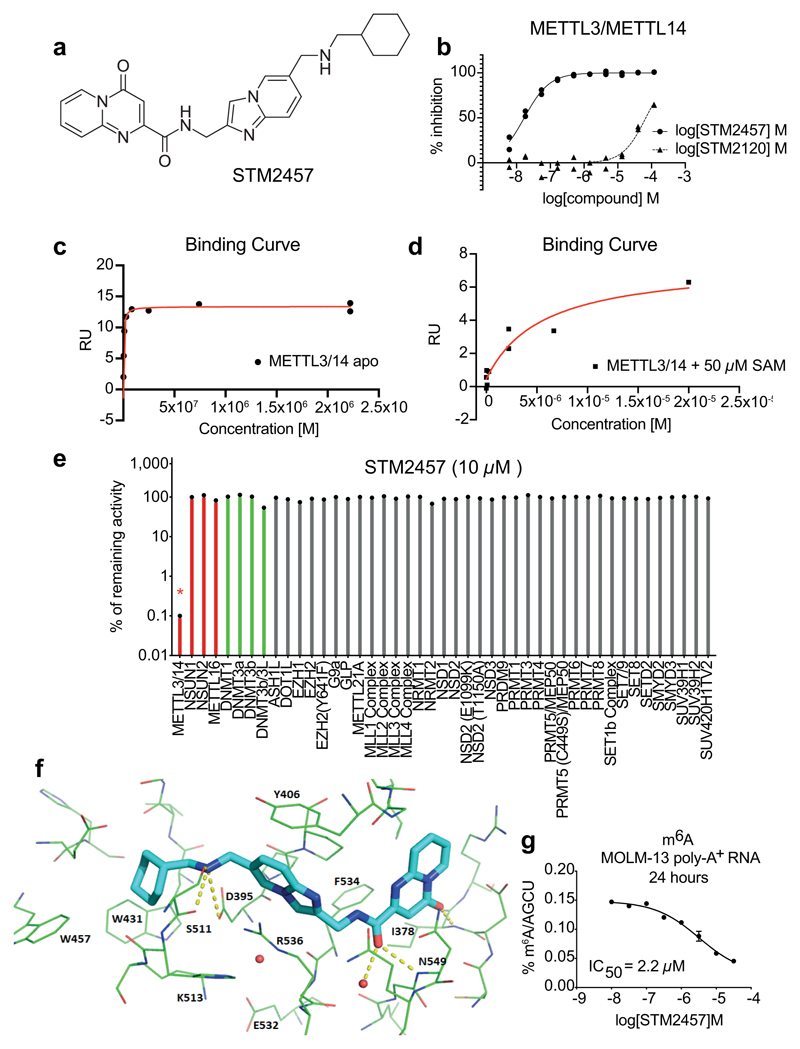
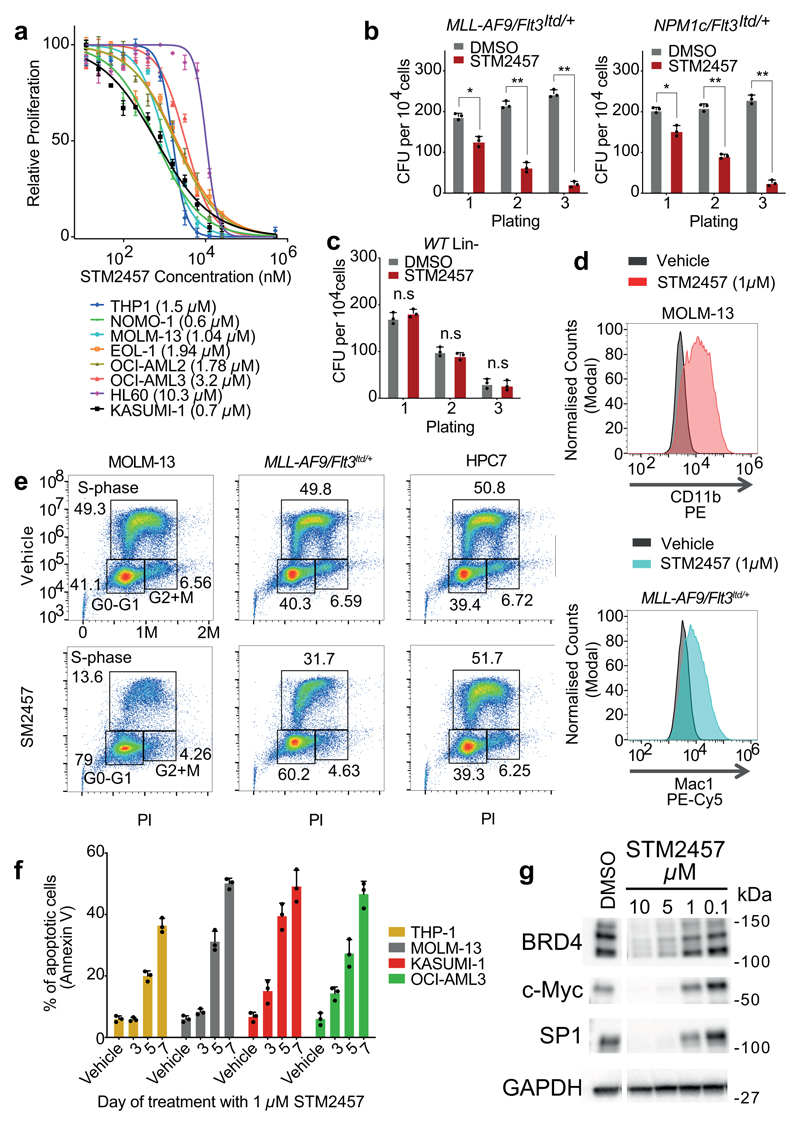
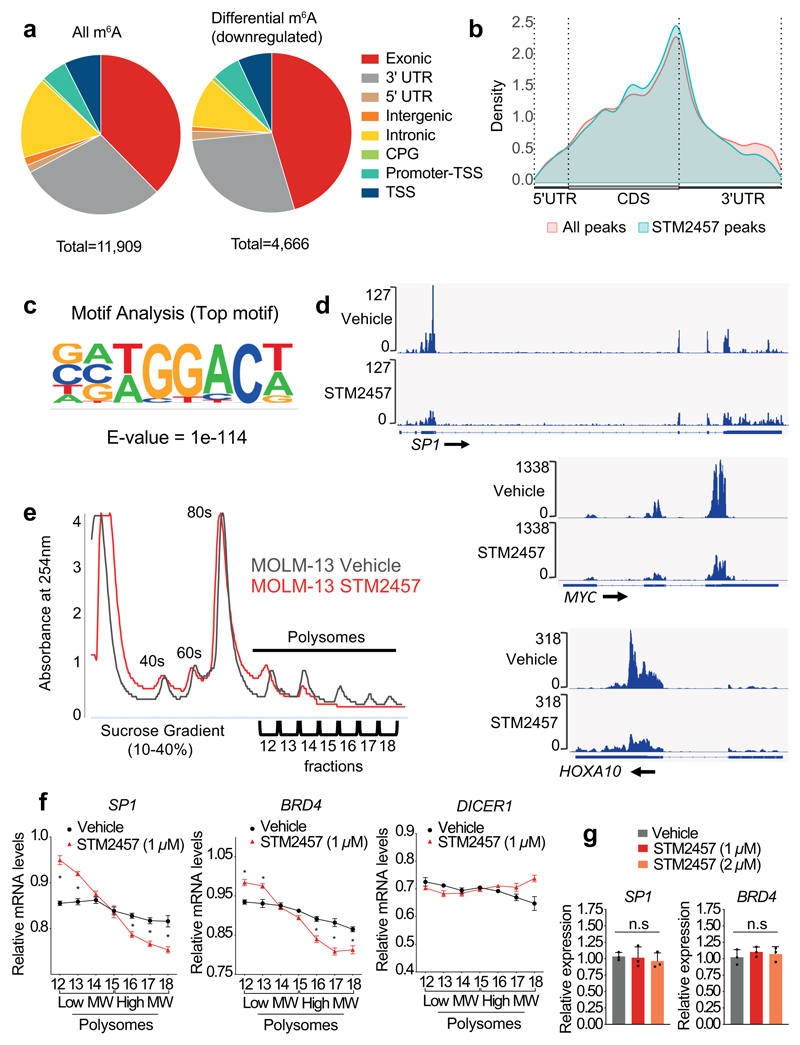
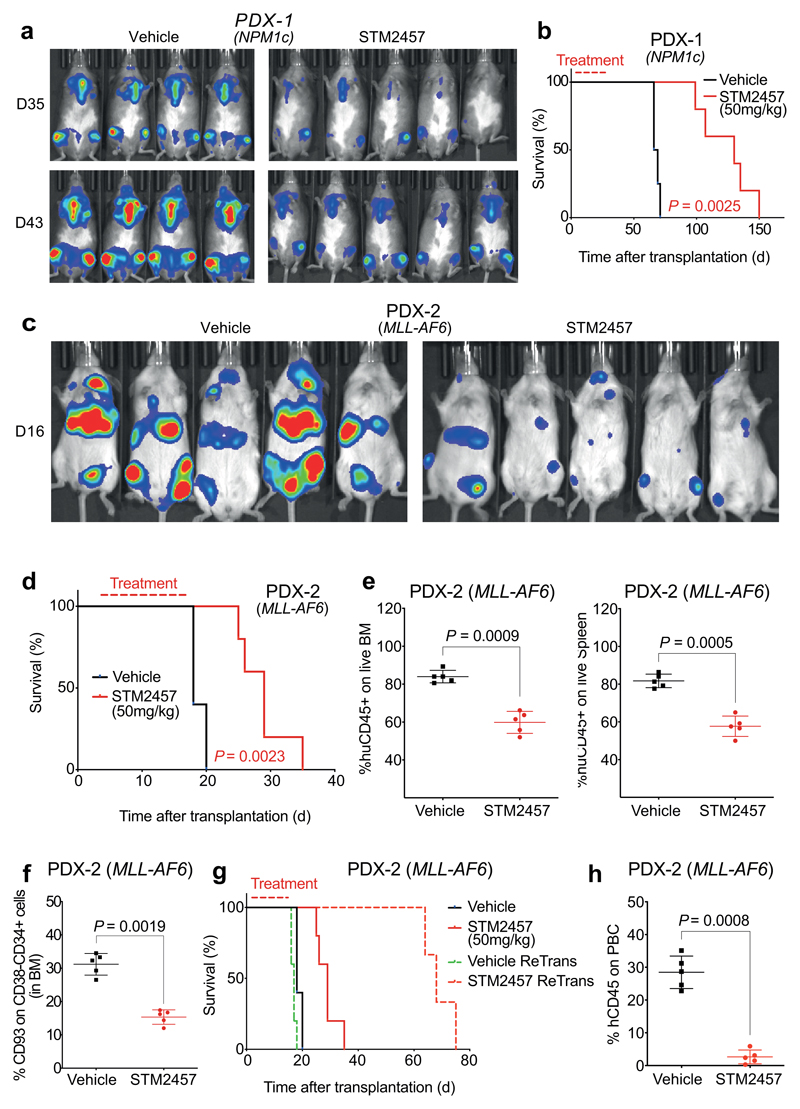
N6-methyladenosine (m6A) is an abundant internal RNA modification1,2 that is catalysed predominantly by the METTL3-METTL14 methyltransferase complex3,4. The m6A methyltransferase METTL3 has been linked to the initiation and maintenance of acute myeloid leukaemia (AML), but the potential of therapeutic applications targeting this enzyme remains unknown5-7. Here we present the identification and characterization of STM2457, a highly potent and selective first-in-class catalytic inhibitor of METTL3, and a crystal structure of STM2457 in complex with METTL3-METTL14. Treatment of tumours with STM2457 leads to reduced AML growth and an increase in differentiation and apoptosis. These cellular effects are accompanied by selective reduction of m6A levels on known leukaemogenic mRNAs and a decrease in their expression consistent with a translational defect. We demonstrate that pharmacological inhibition of METTL3 in vivo leads to impaired engraftment and prolonged survival in various mouse models of AML, specifically targeting key stem cell subpopulations of AML. Collectively, these results reveal the inhibition of METTL3 as a potential therapeutic strategy against AML, and provide proof of concept that the targeting of RNA-modifying enzymes represents a promising avenue for anticancer therapy.


Conflict of interest statement

Competing interests

T.K. is a co-founder of Abcam Plc and Storm Therapeutics Ltd, Cambridge, UK and Scientific Advisor to Foghorn Therapeutics and EpiVario. E.Y. is funded by Storm Therapeutics Ltd, Cambridge, UK. W.B., M.A., G.T., D.L., B.A., R.F., A.G.H., N.A.W., P.G. and O.R. are employees of Storm Therapeutics Ltd, Cambridge, UK. E.S.P. is an employee of Evotec (UK) Ltd, Abingdon, UK. George S. Vassiliou is a consultant for Kymab, Cambridge, UK. Storm Therapeutics Ltd is the owner of a patent application (WO2020201773) covering the development of METTL3 RNA methyltrasferase inhibitors.

Figures

Extended Data Figure. 1
Extended Data Figure. 1. STM2457 is a specific small molecule inhibitor of METTL3 with no evidence of off-target effects.
a) Chemical structures of STM1760 and STM2120. b) Biochemical activity assay showing inhibition of the METTL3/METTL14 enzyme complex using a dose-range of STM1760. c) Surface plasmon resonance (SPR) sensorgram showing the binding of STM2457 to the METTL3/METTL14 protein complex. d) SPR sensorgram showing reduced binding of STM2457 to the METTL3/METTL14 protein complex in the presence of 50 µM SAM, illustrating that STM2457 is SAM competitive. e) SPR assay showing single-cycle binding kinetics of STM2457. f) Biochemical activity assay showing no inhibition of METTL16, NSUN1 and NSUN2 RNA methyltransferases using a dose-range of STM2457. g) Methyltransferase dendrograms showing that 10 µM STM2457 has selective inhibitory activity for METTL3/METTL14 over the indicated RNA and protein methyltransferases. h) Treatment with 10 µM STM2457 did not inhibit (ie result in less than 50% control activity) any of the 468 kinases in the ScanMax (DiscoverX) kinase panel tested (marked by green dots).
Extended Data Figure. 2
Extended Data Figure. 2. Binding of STM2457 to the SAM pocket of METTL3.
a) Overlay of crystal structures of METTL3/METTL14 in complex with STM2457 (carbon atoms in cyan) and METTL3/14 in complex with SAM (carbon atoms in magenta, PDB code 7O2I). The position of K513 is shown in lines of the corresponding color for each structure. b) Cellular thermal shift target engagement assay measuring binding affinity of STM2457 against human and mouse METTL3 proteins expressed in HeLa cells. The IC50 represents the concentration of STM2457 at which 50% of METTL3 is bound to STM2457. (mean +/- s.d., n=3). c) Quantification of m6A levels on poly-A+-enriched RNA using RNA-mass spectrometry after 48 hours of in vitro treatment of MOLM-13 with 1 µM of STM2457 or vehicle (DMSO). (mean +/- s.d., n=3). d) Quantification of m6Am, m62A and m7G levels on poly-A+-enriched RNA 24 hours of treatment of MOLM-13 with the indicated STM2457 concentrations (mean +/- s.d., n=3). e) STM2457 in vivo pharmacokinetic profile in mouse blood and brain tissue using a dose of 50 mg/kg. f) STM2457 in vivo PK/PD relationship in non-tumour bearing animals from the PK study shown in (e), demonstrating inhibition of m6A in spleen tissue over a range of STM2457 blood concentrations (n=3). two-tailed Student’s t-test.
Extended Data Figure. 3
Extended Data Figure. 3. Treatment with STM2457 triggers colony forming deficiency and apoptosis in AML cells.
a) Colony-forming efficiency of CD34+ human cord blood cells (n?=?3) in the presence of 1, 5, or 10?µM STM2457 (mean?±?s.d., n=3). These changes are not significant at the 95% confidence level according to one-way Anova on repeated measures. Error bars refer to variation across 3 different individuals (blue, brown and red square). b) Proliferation assay in MOLM-13 cells after treatment with the indicated doses of STM2457 and STM2120, illustrating no sensitivity to the latter at any tested dose (mean ± s.d., n=3). c) Colony forming efficiency of primary murine MLL-ENL/Flt3ITD/+ and NPM1c/NRAS-G12D AML cells treated with 1 μM STM2457 showing decreased clonogenic potential compared with vehicle-treated (DMSO) controls (mean ± s.d., n=3). d) Mac1 levels were used to assess differentiation of non-leukaemic haemopoietic cell line HPC7. Flow cytometry comparison on day 4 post-treatment between vehicle (DMSO) and 1 µM STM2457. e) Selective increased apoptosis in AML cells but not in non-leukaemic haematopoietic cells, following treatment with 1 µM of STM2457 at the presented time points (mean ± s.d., n=3). f) Western blot for SP1 and ACTIN in MOLM-13 cells transduced with plasmids expressing SP1 cDNA or an empty control (n=3). g) Dose-response curves of MOLM-13 cells to STM2457 after transduction with vectors expressing SP1 cDNA or an empty control, showing selective decrease of drug sensitivity upon ectopic expression the former. The dose-response curve of parental MOLM-13 (WT, light blue) shown in Fig. 2a is illustrated for comparison purposes. (mean ± s.d., n = 3). d, days; two-tailed Student’s t-test; *P < 0.05, **P < 0.01
Extended Data Figure. 4
Extended Data Figure. 4. Differential expression analysis of AML cells after treatment with STM2457.
a) Volcano plot for MOLM13 cells treated with 1 µM STM2457 versus control samples after 48 hours of treatment, showing significantly dysregulated genes in red (Padj = 0.01). b) Extended gene ontology analysis of the differentially expressed genes post-treatment with 1 µM STM2457 in MOLM-13 cells. c) Representative GO signatures of the differentially expressed genes post-treatment with STM2457 in MOLM-13 cells. LFC, Log Fold Change.
Extended Data Figure. 5
Extended Data Figure. 5. Pharmacological inhibition of METTL3 significantly reduces m6A on leukaemia-associated substrates
a) Overlap between METTL3-dependent m6A poly-A+ RNAs in MOLM-13 cells either treated with 1 µM STM2457 or with genetic downregulation of METTL3 from Barbieri et al. b) Overlap between differential downregulated m6A peaks in MOLM-13 cells either treated with 1 µM STM2457 or with genetic downregulation of METTL3 from Barbieri et al. c) Genomic visualization of the m6A-meRIP normalized signal in MOLM13 cells following treatment with vehicle (DMSO) or 1 µM STM2457 for the METTL3-dependent m6A substrates BRD4 and HNRNPL (red stars indicate loss of m6A signal). d) m6A-meRIP-qPCR analysis of METTL3-dependent and METTL3-independent m6A substrates normalized to input in MOLM-13 cells treated for 24 or 48 hours with either vehicle (DMSO) or 1 µM STM2457 (mean ± s.d., n=3). e) Gene ontology analysis of differentially m6A-methylated mRNAs upon treatment with 1 µM STM2457. f) RT-qPCR quantification of METTL3 and DICER1 in total RNA samples from MOLM-13 cells treated with vehicle or STM2457 (mean +/- s.d., n=3). g) Western blot for METTL3, METTL14, DDX3X, DICER1 and ACTIN in MOLM-13 cells treated with 10, 5 and 1 µM of STM2457 or vehicle (DMSO) for 72 hours (n=3). two-tailed Student’s t-test; n.s., not significant; KD, knockdown.
Extended Data Figure. 6
Extended Data Figure. 6. STM2457 shows high efficacy and strong target engagement in PDX models.
a) Quantification of luminescence for the animal experiment depicted in Fig. 4a (mean ± s.d, n=5). b) Bioluminescence imaging of mice transplanted with AML PDX-3 (MLL-AF10) treated with vehicle or 50 mg/kg STM2457 (n=5). c) Kaplan-Meier survival of AML PDX-3 (MLL-AF10) following 12 consecutive treatments with vehicle or 50 mg/kg STM2457 at indicated times (n=5). d) Quantification of luminescence for the animal experiment depicted in Extended Data Fig. 4c (mean ± s.d, n=5). e) Quantification of luminescence for the animal experiment depicted in Fig. 4c (mean ± s.d, n=5). f) Body weight for the animal experiment depicted in Fig. 4a (n=5). Statistical significance was determined by two-tailed Mann–Whitney U test and box plots showing median, IQR and extremes. g) Western blot for SP1, BRD4, HNRNPL, BCL2, METTL3 and ACTIN protein levels in AML PDX-3 (MLL-AF6) treated with vehicle or 50 mg/kg STM2457 (n=4). h) RNA-mass spectrometry quantification of m6A levels on poly-A+-enriched RNA from bone marrow of AML PDX-3 (MLL-AF10) treated in vivo with vehicle, 30 mg/kg STM2457 or 50 mg/kg STM2457 (mean ± s.d., n=4). D, day; n.s. not significant; two-tailed Student’s t-test; Log-rank (Mantel–Cox) test was used for survival comparisons.
Extended Data Figure. 7
Extended Data Figure. 7. STM2457 treatment is efficacious and targeted in primary murine AML.
a) Percentage of YFP+ MLL-AF9/Flt3Itd/+ cells in the bone marrow of mice treated with vehicle or 30 mg/kg STM2457 (mean ± s.d., n=4). b) Spleen weight of MLL-AF9/Flt3Itd/+ murine AML models following treatment with vehicle or 30 mg/kg STM2457 (mean ± s.d., n=4). c) Western blot showing SP1, BRD4, HNRNPL, BCL2, METTL3 and ACTIN protein levels in murine AML (MLL-AF9/Flt3Itd/+) models treated with either vehicle or 30 mg/kg STM2457 (n=4). d) RNA-mass spectrometry quantification of m6A levels on poly-A+-enriched RNA in vivo from AML murine models (MLL-AF9/Flt3Itd/+) treated with vehicle, 30 mg/kg STM2457 or 50 mg/kg STM2457 (mean ± s.d., n=4). e) Percentage of CD93+ cells in the bone marrow of MLL-AF9/Flt3Itd/+ murine models following treatment with either vehicle or 30 mg/kg STM2457 (mean ± s.d., n=5). f) Percentage of L-GMP cells in the bone marrow of MLL-AF9/Flt3Itd/+ murine models following treatment with either vehicle or 30 mg/kg STM2457 (mean ± s.d., n=5). g) CD48 levels of L-GMP cells in the bone marrow of MLL-AF9/Flt3Itd/+ murine models following treatment with either vehicle or 30 mg/kg STM2457 (mean ± s.d., n=5). h) Kaplan-Meier survival after re-transplantation of cells isolated from primary transplanted animals with MLL-AF9/Flt3Itd/+ treated and treated with either vehicle or 30 mg/kg STM2457 (n=5). i) Percentage of YFP+ cells in the peripheral blood 12 days after re-transplantation with MLL-AF9/Flt3Itd/+ (mean ± s.d., n=5). D, day; BM, bone marrow; PBC, peripheral blood count; n.s. not significant; two-tailed Student’s t-test; Log-rank (Mantel–Cox) test was used for survival comparisons.
Extended Data Figure. 8
Extended Data Figure. 8. Pharmacological inhibition of METTL3 has no lasting effects on normal haematopoiesis.
a-c) Quantification of LSK (Lin-/Ska1+/c-Kit+) and HSC (LSK/CD150+/CD34-) compartments in bone marrow from WT C57BL/6J mice following 14 consecutive daily treatments with either vehicle or 50 mg/kg STM2457 (mean ± s.d., n=5). d) Blood count results from animal experiments related to a-c. e) Body weight of mice from animal experiments related to a-d (n = 5). Statistical significance was determined by two-tailed Mann–Whitney U test and box plots showing median, IQR and extremes. f) RNA-mass spectrometry quantification of m6A levels on poly-A+-enriched RNA from healthy bone marrow related to the animal experiments a-d, following 14 days of consecutive treatments with either vehicle or 50 mg/kg STM2457 (mean ± s.d., n=5). HSC, hematopoietic stem cells; two-tailed Student’s t-test; n.s., not significant.
Fig. 1
Fig. 1. Characterisation of the RNA methyltransferase inhibitor STM2457.
a) Chemical structure of STM2457. b) Biochemical activity assay showing inhibition of the METTL3/14 enzyme complex using a dose-range of STM2457 and STM2120. c) Surface plasmon resonance (SPR) assay showing binding affinity of STM2457 to the METTL3/14 protein complex. d) SPR assay showing binding affinity to the METTL3/METTL14 protein complex is reduced in the presence of SAM, indicative of SAM-competitive binding. e) STM2457 inhibits METTL3/METTL14 selectively in a methyltransferase profiling panel of 45 RNA (red bars), DNA (green bars) and protein methyltransferases (grey bars) (red star indicates <50% activity remaining) (n=2). f) Crystal structure of METTL3/METTL14 (carbon atoms in green) in complex with STM2457 (carbon atoms in cyan). Hydrogen bonds (yellow dashed lines) and water molecules proximal to the inhibitor (red sphere) are shown (PDB code 7O2I). g) Quantification of m6A levels on poly-A+-enriched RNA after 24 hours of treatment of MOLM-13 with the indicated STM2457 concentrations (mean +/- s.d., n=3). IC50, half maximum inhibitory concentration.
Fig. 2
Fig. 2. Pharmacological inhibition of METTL3 affects AML cells.
a) Dose-response curves of an AML cell line panel to STM2457 (mean +/- s.d., n=3). b) Colony forming efficiency of primary murine MLL-AF9/Flt3Itd/+ and NPM1c/Flt3Itd/+ AML cells treated with vehicle or STM2457 (mean +/- s.d., n=3). Half maximum inhibitory concentration (IC50) per cell line is illustrated in brackets. c) Colony forming efficiency of WT Lin- cells treated with vehicle or STM2457 (mean +/- s.d., n=3). d) CD11b and Mac1 levels of MOLM-13 and MLL-AF9/Flt3Itd/+ primary murine cells, respectively, treated with vehicle or STM2457. e) BrdU staining and cell cycle analysis in MOLM-13, HPC7 and MLL-AF9/Flt3Itd/+ primary murine cells treated with vehicle or STM2457. f) Percentage of apoptotic cells in a human AML cell line panel, following treatment with STM2457 at the indicated time-points (mean +/- s.d., n=3). g) Western blot analysis of BRD4, c-MYC, SP1 and GAPDH in MOLM-13 cells treated with the indicated doses of STM2457 or vehicle (n=3). two-tailed Student’s t-test; *P < 0.01; **P < 0.0001, n.s. not significant; WT, wild-type.
Fig. 3
Fig. 3. STM2457 reduces m6A levels and causes mRNA translation defects.
a) Genomic distribution of all m6A peaks called (left) and/or the genomic distribution of downregulated m6A peaks (right) on poly-A+-enriched RNAs from STM2457-treated MOLM-13 cells. b) The distribution of all (red) or down-regulated (light blue) m6A peaks of MOLM-13 cells upon treatment with STM2457. c) Motif analysis of the sequences under depleted peaks, following treatment with STM2457 (hypergeometric test). d) Genomic visualization of the m6A-meRIP normalized signal for SP1, MYC and HOXA10 in MOLM13 cells following treatment with vehicle or STM2457. e) Polysome fractionation analysis in MOLM-13 cells treated with vehicle or STM2457. Absorbance was continuously measured at 254 nm. f) RT-qPCR quantification of SP1, BRD4 and DICER1 mRNAs in each polysome fraction presented as a percentage of total mRNA (mean +/- s.d., n=3). g) RT-qPCR quantification of SP1 and BRD4 in total RNA samples isolated from MOLM-13 cells treated with vehicle or STM2457 (mean +/- s.d., n=3). UTR, untranslated region; CPG, CPG island; TSS, transcription start site; CDS, coding sequence; nm, nanometres; MW, molecular weight; n.s., not significant; two-tailed Student’s t-test; *P < 0.05.
Fig. 4
Fig. 4. STM2457 prevents AML expansion and reduces key leukaemia stem cells in vivo.
a) Bioluminescence imaging of AML PDX-1 (NPM1c) treated with vehicle or 50 mg/kg STM2457 (n=5). b) Kaplan-Meier survival of AML PDX-1 (NPM1c) after treatment with vehicle or 50 mg/kg STM2457 at indicated times (n=5). c) Bioluminescence imaging of AML PDX-2 (MLL-AF6) treated with vehicle or 50 mg/kg STM2457 (n=5). d) Kaplan-Meier survival of AML PDX-2 (MLL-AF6) after treatment with vehicle or 50 mg/kg STM2457 at indicated times (n=5). e) Percentage of CD45+ cells in live bone marrow and spleen after treatment with vehicle or 50 mg/kg STM2457 (n=5). f) Percentage of CD93+ on CD38-/CD34+ cells in bone marrow after treatment with vehicle or 50 mg/kg STM2457 (n=5). g) Kaplan-Meier survival after re-transplantation of AML PDX-2 (MLL-AF6) which was treated with vehicle or 50 mg/kg STM2457 at indicated times (n=5). Treatment (in red) and non-dashed lines in red or black refer to the primary transplantation illustrated in Fig. 4d. h) Percentage of human CD45+ cells in peripheral blood after re-transplantation of AML PDX-2 (MLL-AF6) (n=5). Related to Fig. 4g. PBC, peripheral blood count; d, day; two-tailed Student’s t-test; Log-rank (Mantel–Cox) test was used for survival comparisons.

Comment in

References

    1. Dominissini D, et al. Topology of the human and mouse m6A RNA methylomes revealed by m6A-seq. Nature. 2012;485:201–206. doi: 10.1038/nature11112. - DOI - PubMed
    1. Meyer KD, et al. Comprehensive analysis of mRNA methylation reveals enrichment in 3′ UTRs and near stop codons. Cell. 2012;149:1635–1646. doi: 10.1016/j.cell.2012.05.003. - DOI - PMC - PubMed
    1. Liu J, et al. A METTL3-METTL14 complex mediates mammalian nuclear RNA N6-adenosine methylation. Nat Chem Biol. 2014;10:93–95. doi: 10.1038/nchembio.1432. - DOI - PMC - PubMed
    1. Wang X, et al. Structural basis of N(6)-adenosine methylation by the METTL3-METTL14 complex. Nature. 2016;534:575–578. doi: 10.1038/nature18298. - DOI - PubMed
    1. Tzelepis K, et al. A CRISPR Dropout Screen Identifies Genetic Vulnerabilities and Therapeutic Targets in Acute Myeloid Leukemia. Cell Rep. 2016;17:1193–1205. doi: 10.1016/j.celrep.2016.09.079. - DOI - PMC - PubMed

Publication types