

doi: 10.1161/CIRCRESAHA.120.318501.
Epub 2021 Apr 27.
Prdm16 Supports Arterial Flow Recovery by Maintaining Endothelial Function
Affiliations
- PMID: 33902304
- PMCID: PMC8221541
- DOI: 10.1161/CIRCRESAHA.120.318501
Item in Clipboard
Prdm16 Supports Arterial Flow Recovery by Maintaining Endothelial Function
Circ Res.
.
Abstract
[Figure: see text].
Keywords: arteries; endothelium; homeostasis; ischemia; transcription factor; vasodilation.
Figures
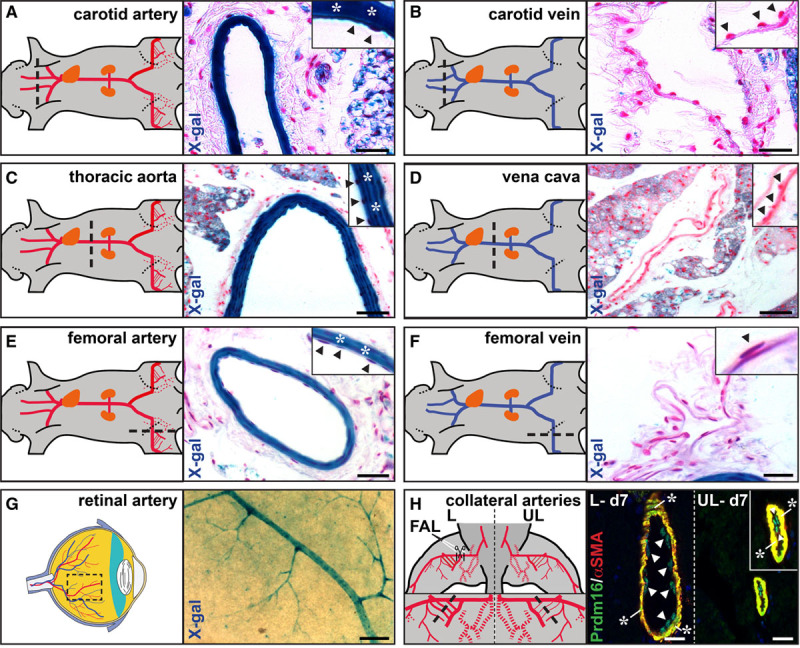
Prdm (positive regulatory domain-containing protein) 16 is a universal arterial marker in health and disease.
A–F, X-gal (5-bromo-4-chloro-3-indolyl–D-galactopyranoside) staining on cross-sections of adult Prdm16+/− arteriovenous pairs. Arteries are shown in (A, C, and E), venous counterparts in (B, D, and F). G, Whole-mount X-gal staining on a flat-mounted retina of a Prdm16+/− adult mouse. H, Immunofluorescence staining for Prdm16 (green) and αSMA (smooth muscle actin; red) on adductor sections of the unligated (UL) and ligated (L) side 7 d after femoral artery ligation (FAL). Arrowheads and asterisks indicate endothelial and smooth muscle cells, respectively, in A–F, and H. Black dashed lines in A–F, and H and dashed box in G show location of the cross-section or whole-mount staining. Scale bars: 50 μm in A–F, 25 μm in G, and 10 μm in H.
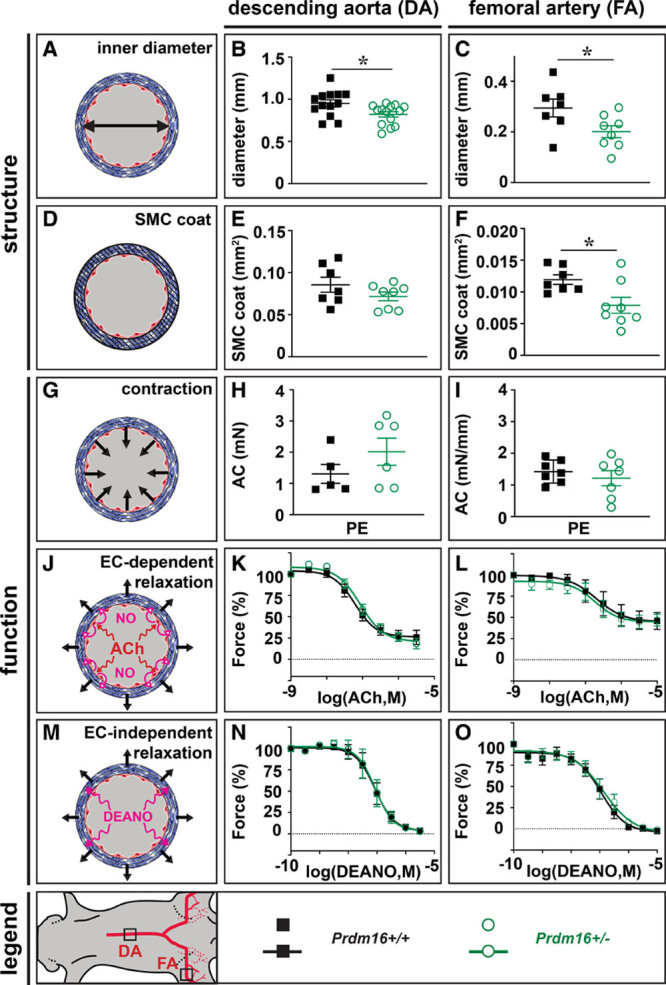
Ubiquitous heterozygous Prdm (positive regulatory domain-containing protein) 16 deficiency slightly affects arterial geometry but not vasomotor function.
A–C, Schematic representation (A) and quantification of descending aorta (DA; B) and femoral artery (FA; C) diameter of Prdm16+/+ (n=13 for DA; n=7 for FA) and Prdm16+/− (n=14 for DA; n=8 for FA) mice. D–F, Schematic representation (D) and quantification of DA (E) and FA (F) smooth muscle cell (SMC) cross-sectional area of Prdm16+/+ (n=7 for DA and FA) and Prdm16+/− (n=8 for DA and FA) mice. G–I, Schematic representation (G) and quantification of the phenylephrine (PE)-induced absolute contraction (AC) in DA (H) and FA (I) of Prdm16+/+ (n=5 for DA; n=7 for FA) and Prdm16+/− (n=6 for DA; n=7 for FA) mice (concentration PE: 3×10⁻⁶ mol/L for DA and FA). J–L, Schematic representation (J) and quantification of relative acetylcholine (ACh)-mediated relaxation of DA (K) and FA (L) from Prdm16+/+ (n=6 for DA; n=7 for FA) and Prdm16+/− (n=5 for DA; n=7 for FA) mice. M–O, Schematic representation (M) and quantification of relative diethylamine NONOate (DEANO)–mediated relaxation of DA (N) and FA (O) from Prdm16+/+ (n=6 for DA; n=7 for FA) and Prdm16+/− (n=6 for DA; n=7 for FA) mice. Data represent mean±SEM. *P<0.05: vs corresponding control (Table III in the Data Supplement ). EC indicates endothelial cell, and M in (K,L,N,O), molar.
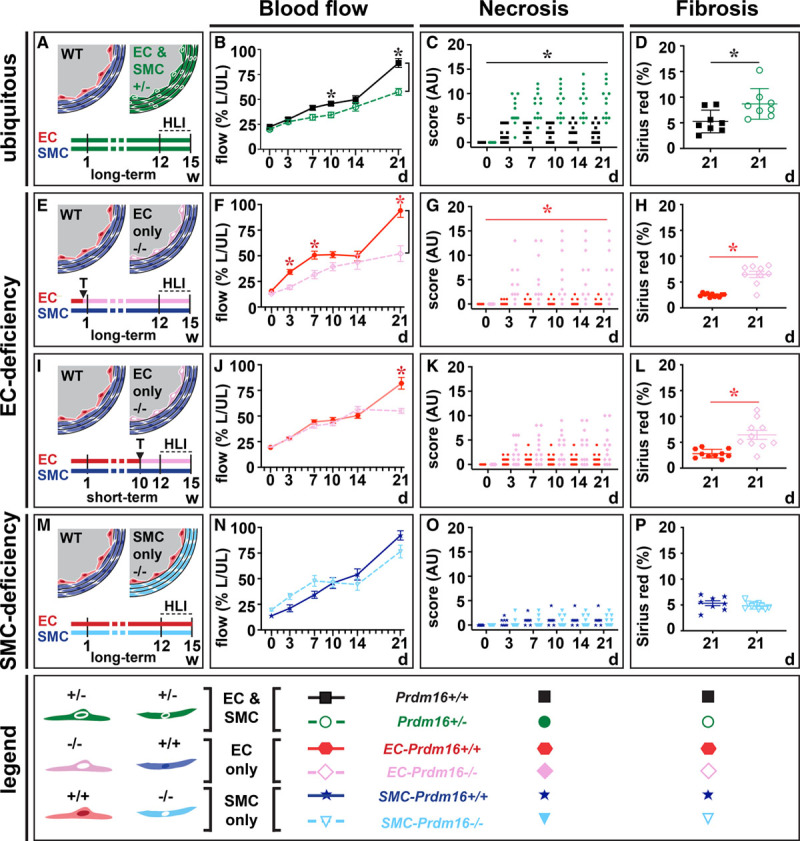
Ubiquitous or endothelial cell (EC)–specific Prdm (positive regulatory domain-containing protein) 16 deficiency impair flow recovery and boost necrosis and fibrosis upon hindlimb ischemia (HLI).
A–D, Schematic representation/time-line (A; w [weeks]; wild-type [WT]) and quantification of flow recovery (B; expressed as % of ligated [L] over unligated [UL]), d 21 necrosis (C; expressed in arbitrary units [AU]) and d 21 fibrosis scores (D) in Prdm16+/+ (n=8–12) or Prdm16+/− (n=8–12) mice after HLI induction. E–H, Schematic representation/time-line (E; T: tamoxifen) and quantification of flow recovery (F; expressed as % of L over UL), d 21 necrosis (G; expressed in AU), and d 21 fibrosis scores (H) in long-term EC-Prdm16+/+ (n=11–12) or EC-Prdm16−/− (n=9–10) mice after HLI induction. I–L, Schematic representation/time-line (I) and quantification of flow recovery (J; expressed as % of L over UL), d 21 necrosis (K; expressed in AU) and d 21 fibrosis scores (L) in short-term EC-Prdm16+/+ (n=10–16) or EC-Prdm16−/− (n=10–13) mice after HLI induction. M–P, Schematic representation/time-line (M) and quantification of flow recovery (N; expressed as % of L over UL), d 21 necrosis (O; expressed in AU), and d 21 fibrosis scores (P) in smooth muscle cell (SMC)-Prdm16+/+ (n=8) or SMC-Prdm16−/− (n=10) mice after HLI induction. Data in B, D, F, H, J, L, N, and P represent mean±SEM. *P<0.05: vs corresponding control (Table III in the Data Supplement ).
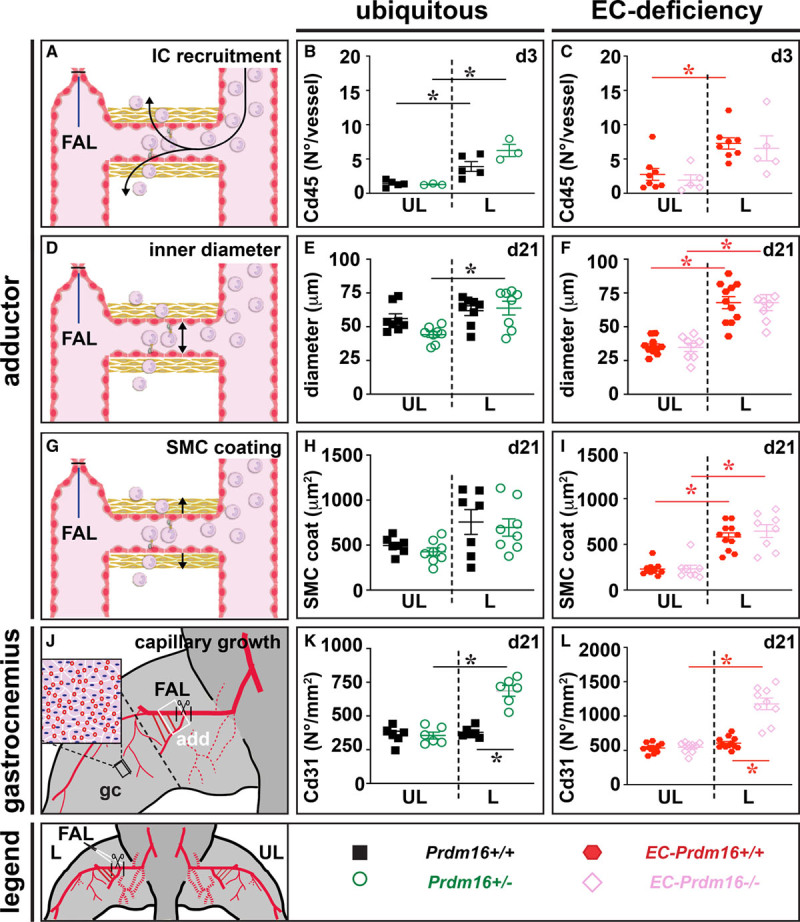
Ubiquitous or endothelial cell (EC)–specific Prdm (positive regulatory domain-containing protein) 16 deficiency do not affect structural vascular remodeling upon hindlimb ischemia.
A–C, Schematic representation (A) and quantification of Cd45+ inflammatory cell (IC) recruitment around expanding collaterals in the adductor region of the ligated (L) and unligated (UL) side at 3 d after femoral artery ligation (FAL) in Prdm16+/+ (n=5) or Prdm16+/− (n=3) mice (B) and long-term EC-Prdm16+/+ (n=8) or EC-Prdm16−/− (n=5) mice (C). D–F, Schematic representation (D) and quantification of collateral inner diameter at d 21 after FAL in Prdm16+/+ (n=8) or Prdm16+/− (n=8) mice (E) and long-term EC-Prdm16+/+ (n=11) or EC-Prdm16−/− (n=8) mice (F). G–I, Schematic representation (G) and quantification of smooth muscle cell (SMC)–coating (measured as cross-sectional medial area) of remodeled collateral arteries at d 21 after FAL in Prdm16+/+ (n=7) or Prdm16+/− (n=8) mice (H) and long-term EC-Prdm16+/+ (n=11) or EC-Prdm16−/− (n=8) mice (I). J–L, Schematic representation (J) and quantification of capillary density in gastrocnemius (gc; black box) muscle at d 21 after FAL in Prdm16+/+ (n=6) or Prdm16+/− (n=6) mice (K) and long-term EC-Prdm16+/+ (n=12) or EC-Prdm16−/− (n=9) mice (L). Data represent mean±SEM. *P<0.05: vs indicated condition (Table III in the Data Supplement ). Adductor region (add) studied in A–I is indicated by a white box in J.
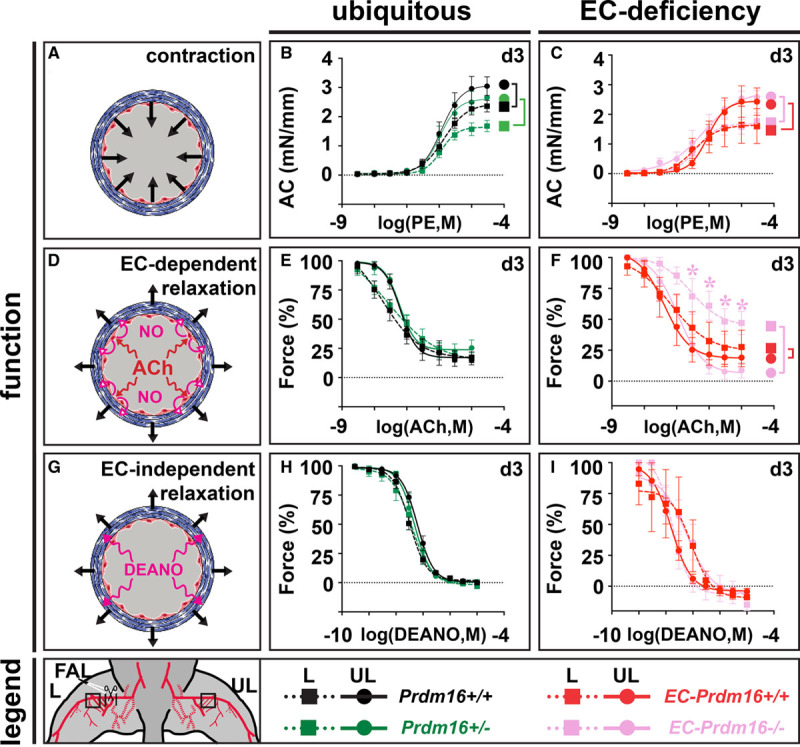
Endothelial cell (EC)–specific Prdm (positive regulatory domain-containing protein) 16 deficiency causes impaired EC-dependent relaxation upon hindlimb ischemia.
A–C, Schematic representation (A) and quantification of phenylephrine (PE)-mediated absolute contraction (AC) in femoral artery (FA) segments of the ligated (L) and unligated (UL) side 3 d after FA ligation (FAL) in Prdm16+/+ (n=7) or Prdm16+/− (n=5–6) mice (B) and long-term EC-Prdm16+/+ (n=3–5) or EC-Prdm16−/− (n=4–5) mice (C). D–F, Schematic representation (D) and quantification of relative EC-dependent relaxation upon administration of acetylcholine (ACh) in FA segments at d 3 after FAL in Prdm16+/+ (n=7) or Prdm16+/− (n=5–6) mice (E) and long-term EC-Prdm16+/+ (n=3–5) or EC-Prdm16−/− (n=4–5) mice (F). G–I, Schematic representation (G) and quantification of relative EC-independent relaxation upon administration of diethylamine NONOate (DEANO) in FA segments at d 3 after FAL in Prdm16+/+ (n=7) or Prdm16+/− (n=5–6) mice (H) and long-term EC-Prdm16+/+ (n=3–5) or EC-Prdm16−/− (n=4–5) mice (I). Data represent mean±SEM. *P<0.05: vs indicated condition (significance is only indicated in case of a differential genotypic response to FAL; Table III in the Data Supplement ). M in (B, C, E, F, H, I) indicates molar.

In situ analyses upon hindlimb ischemia induction in endothelial cell (EC)–specific Prdm (positive regulatory domain-containing protein) 16–deficient mice and their wild-type littermates reveal differential expression changes related to NO bioavailability and Ca2+ homeostasis.
A, Schematic representation of the study design for the in situ differential expression analysis based on single-cell RNA sequencing 3 d after femoral artery ligation (FAL). The regions of interest (ROI) from which single-cell suspensions from the ligated (L) or unligated (UL) side were generated for EC-Prdm16+/+ (red) and EC-Prdm16−/− (dark pink) mice are indicated by a black box. The ROI material from 4 animals was pooled to obtain sufficient cells. B, Uniform Manifold Approximation and Projection (UMAP) plot highlighting cell clusters annotated as arterial endothelial cell (aEC) in red. C, Schematic representation of the 2-step model used for identification of differentially expressed genes (DEGs) in aECs that were commonly (type A; red) or genotype-dependently (type B; light pink) altered when comparing the ligated (L) vs the unligated (UL) side. D, Diagrams showing results of the combined functional annotation analysis by Database for Annotation, Visualization and Integrated Discovery and Gene Set Enrichment Analysis for Kyoto Encyclopedia of Genes and Genomes (KEGG; left) and for Gene Ontology terms molecular_functions (GO-MF; right), expressed as % of genes of the total number of DEGs. Functional categories prioritized because of their known association with EC (dys)function are named. E, Heat maps (upper left) showing the 30 genes represented by the prioritized functional terms in D. Color scale code is shown on top. Table (lower left) showing the documented involvement of the genes in regulation of eNOS (endothelial NO synthase)/NO production, redox state, and Ca2+ homeostasis. Cartoon (right) reveals location of genes encoding for structural components of caveolae or clathrin-coated pits. Arrows indicate caveolae recycling. LDL indicates low-density lipoprotein.
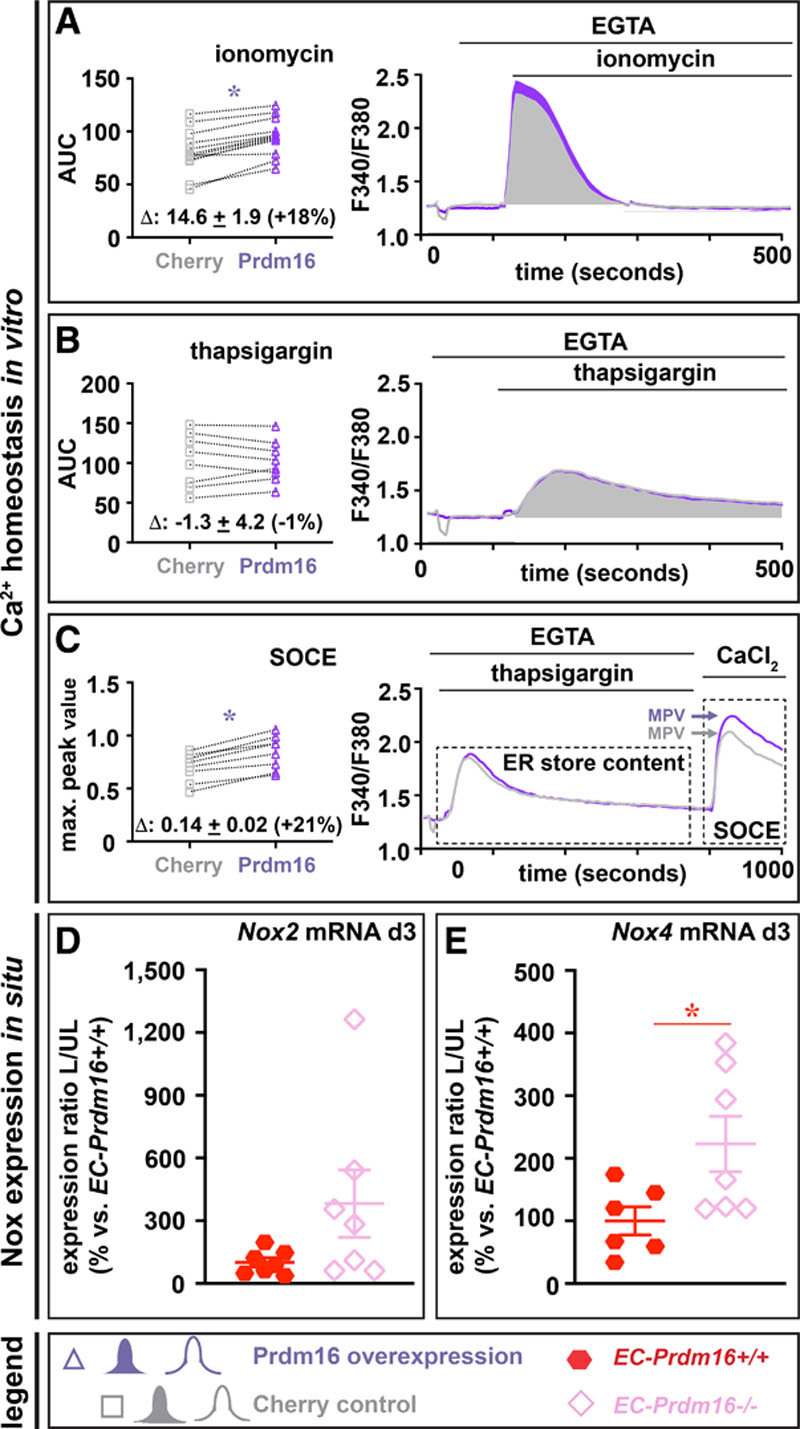
Prdm (positive regulatory domain-containing protein) 16 regulates Ca2+ homeostasis and Nox (NADPH-oxidase) gene expression.
A–C, In vitro Ca2+ handling experiments following treatment of Prdm16- or Cherry-overexpressing human umbilical vein endothelial cells (ECs) with ionomycin in Ca2+-free medium (A; n=12; quantified as area under the curve [AUC]), thapsigargin in Ca2+-free medium (B; n=8; quantified as AUC) and exposure to high extracellular Ca2+ following endoplasmic reticulum (ER) Ca2+ depletion using thapsigargin treatment as a measure for store-operated calcium entry (C; n=8; quantified as maximum peak value (MPV) of the response to CaCl2). Mean differences between Cherry and Prdm16 overexpression conditions and corresponding % change are indicated above the X-axis in diagrams on the left. D and E, Diagram showing expression of Nox2 (D) and Nox4 (E; expressed as ratio of ligated (L) vs unligated (UL) side and as % of EC-Prdm16+/+) in the adductor muscle of long-term EC-Prdm16+/+ (red; n=6–7) or EC-Prdm16−/− (pink; n=7) mice at 3 d postligation. Data represent mean±SEM. *P<0.05 vs indicated condition (Table III in the Data Supplement ). EGTA indicates ethylene glycol tetraacetic acid; and SOC, store-operated Ca2+ entry.
Comment in
-
Is Endothelial Dysfunction a Therapeutic Target for Peripheral Artery Disease?: PRDM16 is going out on a limb.Circ Res. 2021 Jun 25;129(1):78-80. doi: 10.1161/CIRCRESAHA.121.319448. Epub 2021 Jun 24. Circ Res. 2021. PMID: 34166078 Free PMC article. No abstract available.
References
-
- Potente M, Mäkinen T. Vascular heterogeneity and specialization in development and disease. Nat Rev Mol Cell Biol. 2017;18:477–494. doi: 10.1038/nrm.2017.36 - PubMed
-
- Fowkes FG, Rudan D, Rudan I, Aboyans V, Denenberg JO, McDermott MM, Norman PE, Sampson UK, Williams LJ, Mensah GA, et al. . Comparison of global estimates of prevalence and risk factors for peripheral artery disease in 2000 and 2010: a systematic review and analysis. Lancet. 2013;382:1329–1340. doi: 10.1016/S0140-6736(13)61249-0 - PubMed
-
- Annex BH. Therapeutic angiogenesis for critical limb ischaemia. Nat Rev Cardiol. 2013;10:387–396. doi: 10.1038/nrcardio.2013.70 - PubMed
Publication types
MeSH terms
Substances
LinkOut - more resources
Full Text Sources
Molecular Biology Databases
