

Genetic diversity structure of western-type carrots
- PMID: 33902460
- PMCID: PMC8077844
- DOI: 10.1186/s12870-021-02980-0
Genetic diversity structure of western-type carrots
Abstract
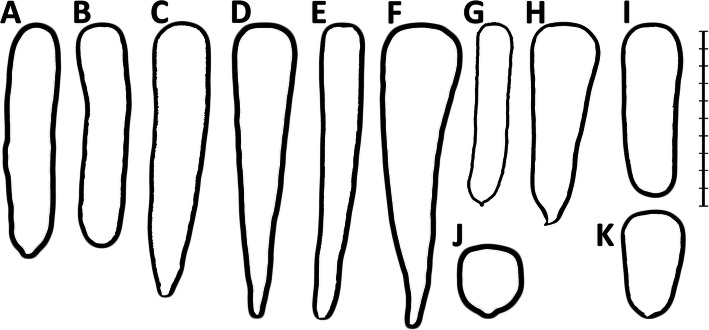
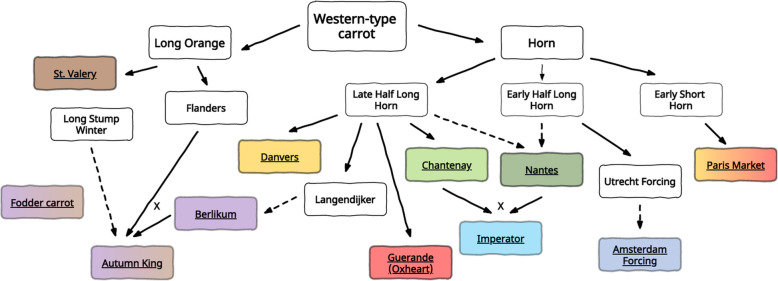
Background: Carrot is a crop with a wide range of phenotypic and molecular diversity. Within cultivated carrots, the western gene pool comprises types characterized by different storage root morphology. First western carrot cultivars originated from broad-based populations. It was followed by intercrosses among plants representing early open-pollinated cultivars, combined with mass phenotypic selection for traits of interest. Selective breeding improved root uniformity and led to the development of a range of cultivars differing in root shape and size. Based on the root shape and the market use of cultivars, a dozen of market types have been distinguished. Despite their apparent phenotypic variability, several studies have suggested that western cultivated carrot germplasm was genetically non-structured.
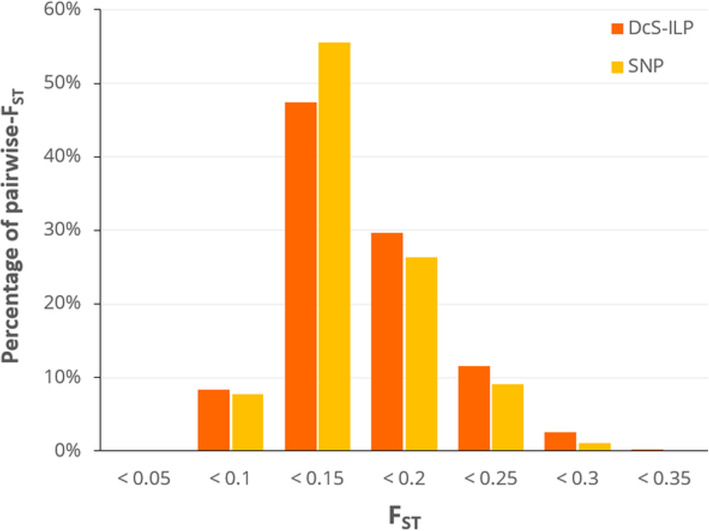
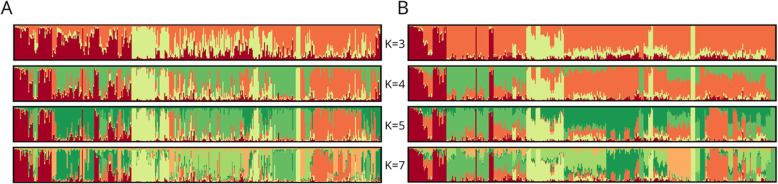
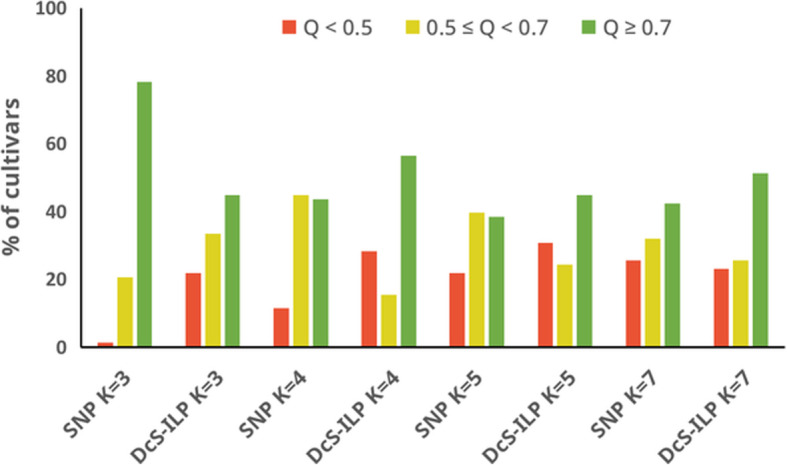
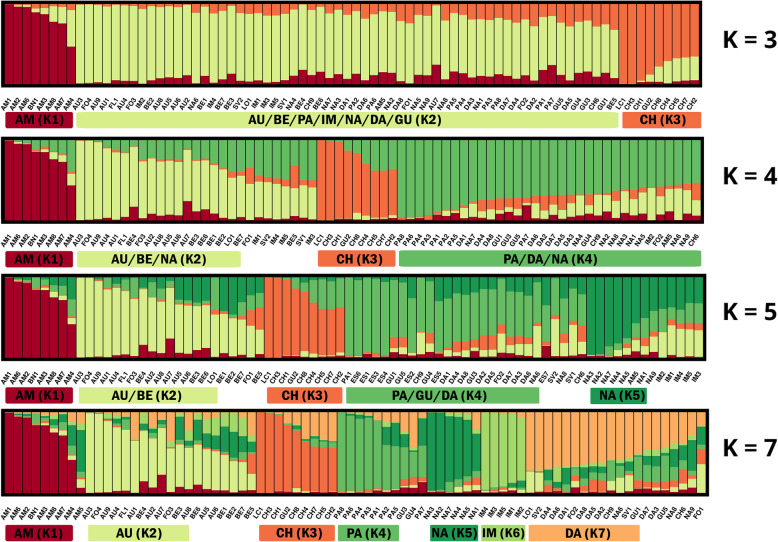
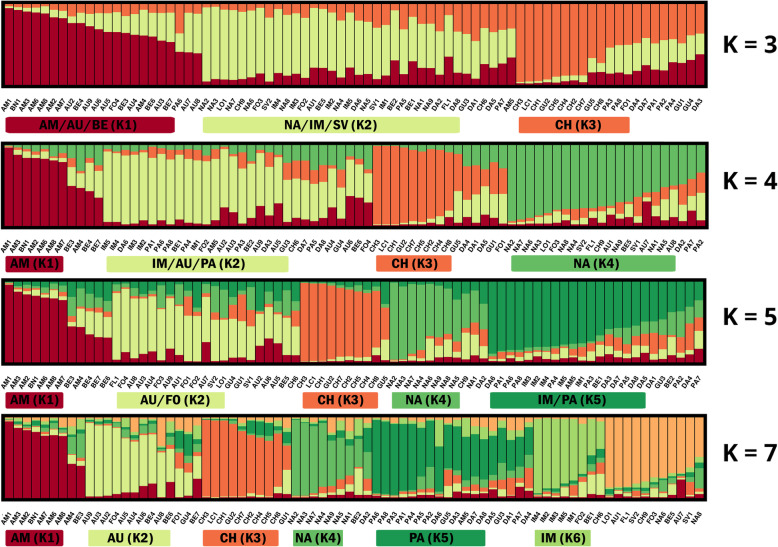
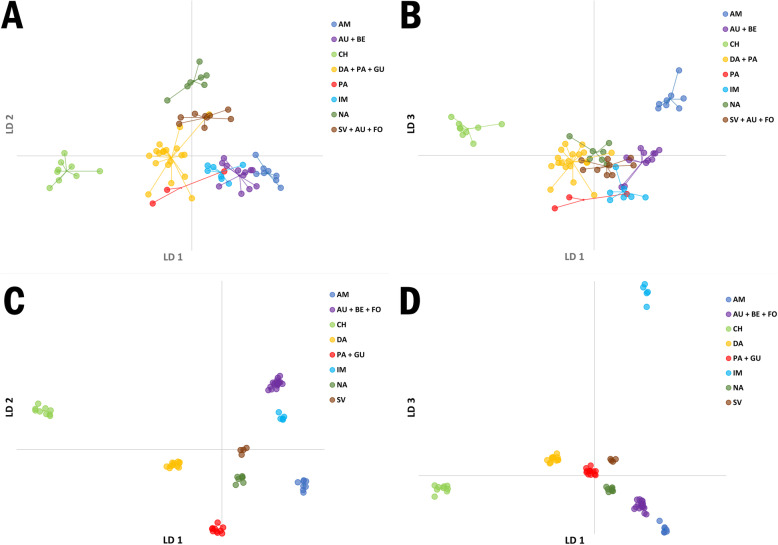
Results: Ninety-three DcS-ILP markers and 2354 SNP markers were used to evaluate the structure of genetic diversity in the collection of 78 western type open-pollinated carrot cultivars, each represented by five plants. The mean percentage of polymorphic loci segregating within a cultivar varied from 31.18 to 89.25% for DcS-ILP markers and from 45.11 to 91.29% for SNP markers, revealing high levels of intra-cultivar heterogeneity, in contrast to its apparent phenotypic stability. Average inbreeding coefficient for all cultivars was negative for both DcS-ILP and SNP, whereas the overall genetic differentiation across all market classes, as measured by FST, was comparable for both marker systems. For DcS-ILPs 90-92% of total genetic variation could be attributed to the differences within the inferred clusters, whereas for SNPs the values ranged between 91 to 93%. Discriminant Analysis of Principal Components enabled the separation of eight groups cultivars depending mostly on their market type affiliation. Three groups of cultivars, i.e. Amsterdam, Chantenay and Imperator, were characterized by high homogeneity regardless of the marker system used for genotyping.
Conclusions: Both marker systems used in the study enabled detection of substantial variation among carrot plants of different market types, therefore can be used in germplasm characterization and analysis of genome relationships. The presented results likely reveal the actual genetic diversity structure within the western carrot gene pool and point at possible discrepancies within the cultivars' passport data.
Keywords: DAPC; Daucus carota; DcSto; Genetic diversity; Market classes; Population structure; Root shape; SNP.
Conflict of interest statement
The authors declare that they have no competing interests.
Figures
References
-
- Iorizzo M, Ellison S, Senalik D, Zeng P, Satapoomin P, Huang J, Bowman M, Iovene M, Sanseverino W, Cavagnaro P, Yildiz M, Macko-Podgórni A, Moranska E, Grzebelus E, Grzebelus D, Ashrafi H, Zheng Z, Cheng S, Spooner D, van Deynze A, Simon P. A high-quality carrot genome assembly provides new insights into carotenoid accumulation and asterid genome evolution. Nat Genet. 2016;48(6):657–666. doi: 10.1038/ng.3565. - DOI - PubMed
-
- Simon PW. Economic and academic importance. In: Simon P, Iorizzo M, Grzebelus D, Baranski R, editors. The Carrot Genome. C. Cole, series editor. Compendium of Plant Genomes. Springer Nature Switzerland AG; 2019. p. 1–8.
-
- Stolarczyk J, Janick J. Carrot: history and iconography. Chron Horticult. 2011;51:13–18.
-
- Banga O. Origin and distribution of the Western cultivated carrot. Genet Agrar. 1963;17:357–370.
MeSH terms
LinkOut - more resources
Full Text Sources
Miscellaneous
