

Demand for longer quarantine period among common and uncommon COVID-19 infections: a scoping review
- PMID: 33902695
- PMCID: PMC8072089
- DOI: 10.1186/s40249-021-00847-y
Demand for longer quarantine period among common and uncommon COVID-19 infections: a scoping review
Abstract
Background: As one of the non-pharmacological interventions to control the transmission of COVID-19, determining the quarantine duration is mainly based on the accurate estimates of the incubation period. However, patients with coarse information of the exposure date, as well as infections other than the symptomatic, were not taken into account in previously published studies. Thus, by using the statistical method dealing with the interval-censored data, we assessed the quarantine duration for both common and uncommon infections. The latter type includes the presymptomatic, the asymptomatic and the recurrent test positive patients.
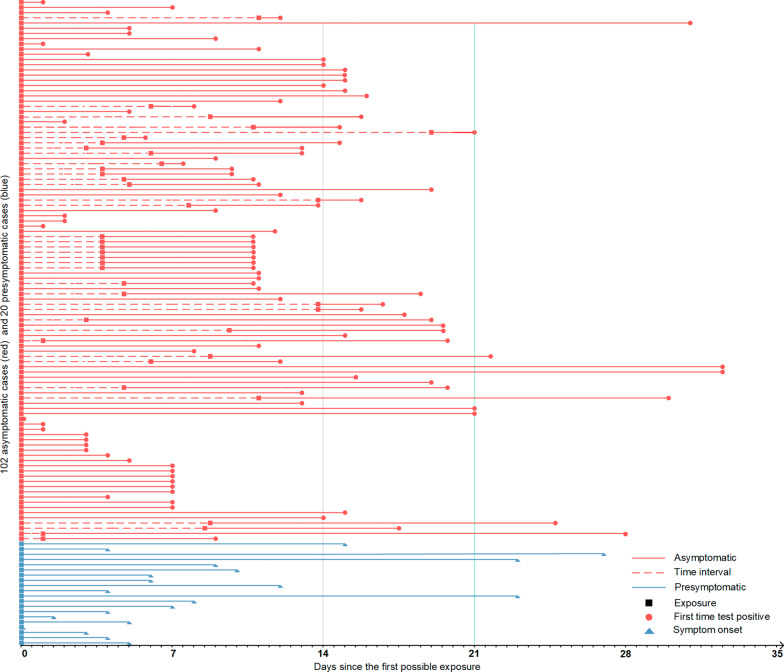
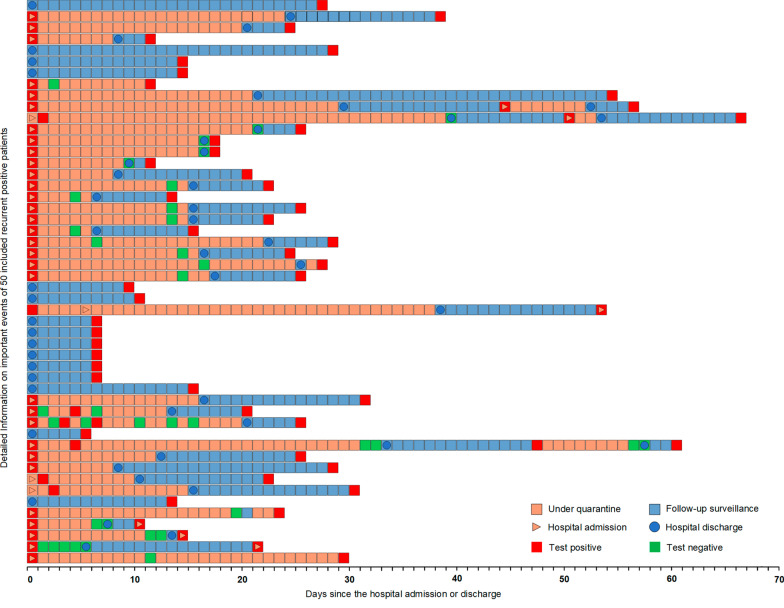
Methods: As of 10 December 2020, information on cases have been collected from the English and Chinese databases, including Pubmed, Google scholar, CNKI (China National Knowledge Infrastructure) and Wanfang. Official websites and medias were also searched as data sources. All data were transformed into doubly interval-censored and the accelerated failure time model was applied. By estimating the incubation period and the time-to-event distribution of worldwide COVID-19 patients, we obtain the large percentiles for determining and suggesting the quarantine policies. For symptomatic and presymptomatic COVID-19 patients, the incubation time is the duration from exposure to symptom onset. For the asymptomatic, we substitute the date of first positive result of nucleic acid testing for that of symptom onset. Furthermore, the time from hospital discharge or getting negative test result to the positive recurrence has been calculated for recurrent positive patients.
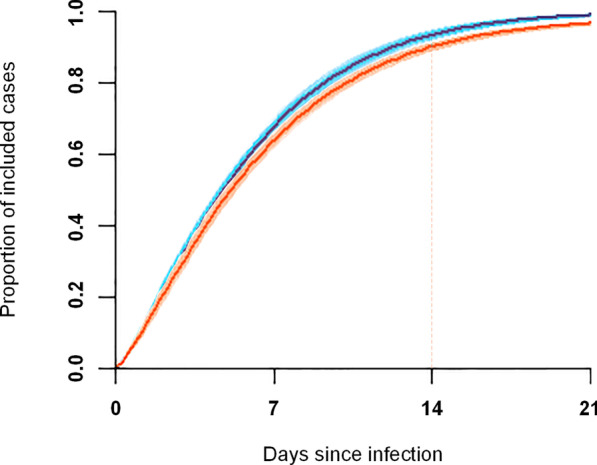
Results: A total of 1920 laboratory confirmed COVID-19 cases were included. Among all uncommon infections, 34.1% (n = 55) of them developed symptoms or were identified beyond fourteen days. Based on all collected cases, the 95th and 99th percentiles were estimated to be 16.2 days (95% CI 15.5-17.0) and 22.9 days (21.7‒24.3) respectively. Besides, we got similar estimates based on merely symptomatic and presymptomatic infections as 15.1 days (14.4‒15.7) and 21.1 days (20.0‒22.2).
Conclusions: There are a certain number of infected people who require longer quarantine duration. Our findings well support the current practice of the extended active monitoring. To further prevent possible transmissions induced and facilitated by such infectious outliers after the 14-days quarantine, properly prolonging the quarantine duration could be prudent for high-risk scenarios and in regions with insufficient test resources.
Keywords: Asymptomatic infections; COVID-19; Incubation period; Presymptomatic infection; Quarantine duration; Recurrent positive.
Conflict of interest statement
The authors declare that they have no actual or potential competing interests.
Figures

References
-
- Global distribution of COVID-19 epidemic situation. http://2019ncov.chinacdc.cn/2019-nCoV/global.html. Accessed Dec 15 2020
-
- World Health Organization. Coronavirus disease 2019 (COVID- 19): Situation Report – 175. 19 Jan 2021. https://www.who.int/publications/m/item/weekly-epidemiological-update---.... Accessed 19 Jan 2021.
Publication types
MeSH terms
Grants and funding
LinkOut - more resources
Full Text Sources
Medical
