. 2021 Apr 26;9(1):78.
doi: 10.1186/s40478-021-01180-z.

Blocking microglial activation of reactive astrocytes is neuroprotective in models of Alzheimer's disease

Affiliations

Blocking microglial activation of reactive astrocytes is neuroprotective in models of Alzheimer's disease

Jong-Sung Park et al. Acta Neuropathol Commun. .

Abstract

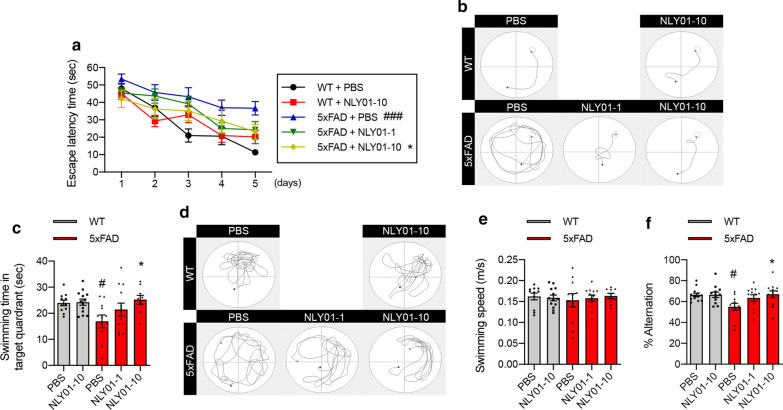
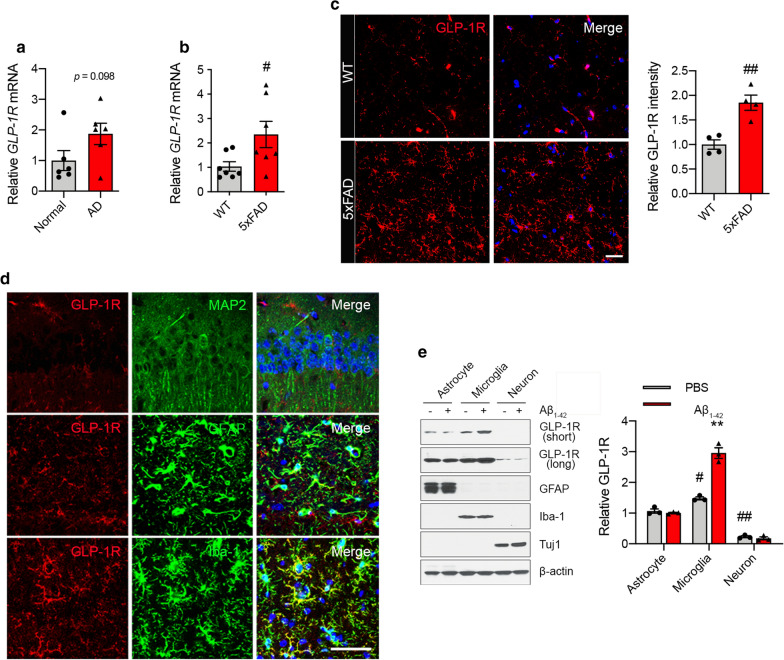
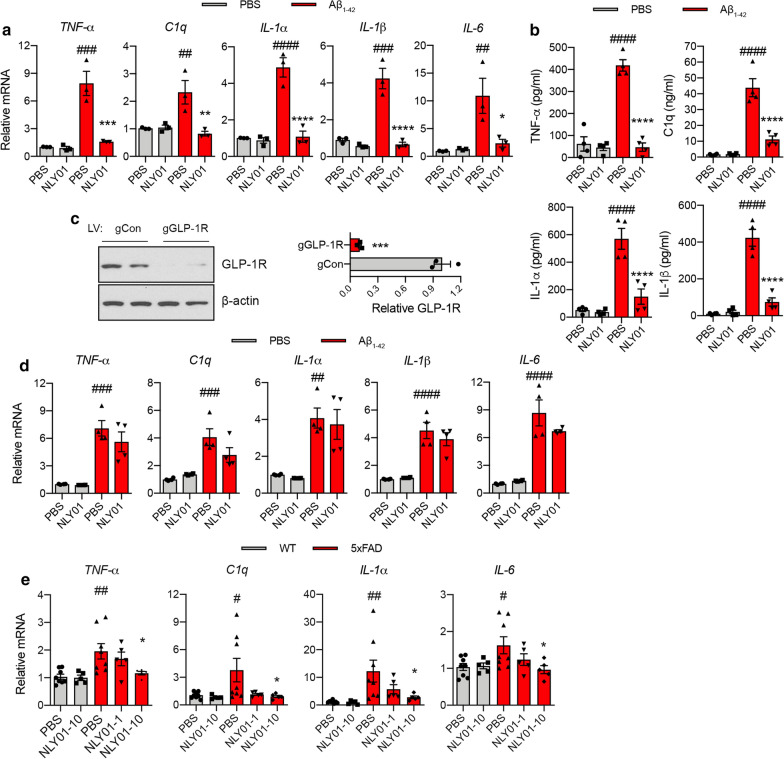
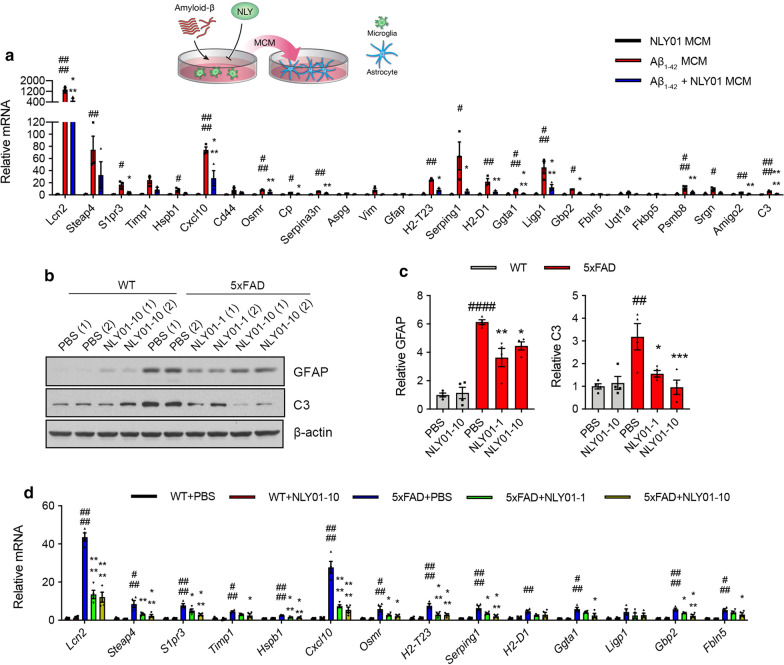
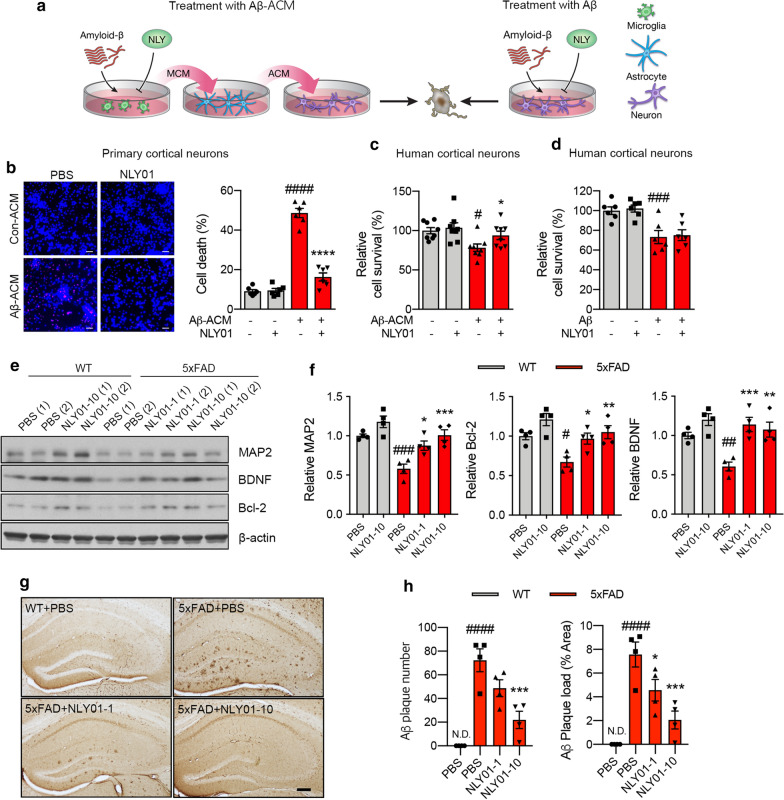
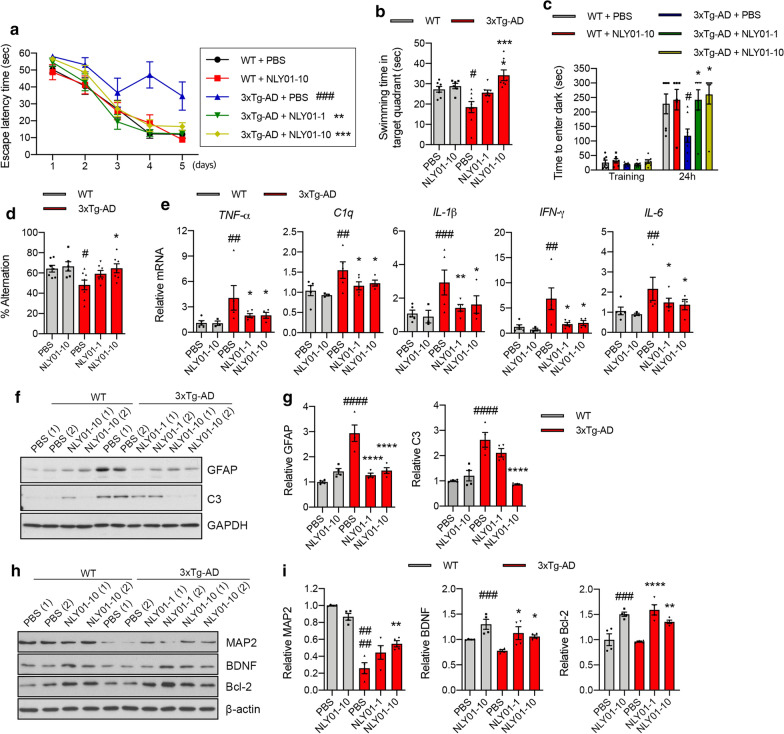
Alzheimer's disease (AD) is the most common cause of age-related dementia. Increasing evidence suggests that neuroinflammation mediated by microglia and astrocytes contributes to disease progression and severity in AD and other neurodegenerative disorders. During AD progression, resident microglia undergo proinflammatory activation, resulting in an increased capacity to convert resting astrocytes to reactive astrocytes. Therefore, microglia are a major therapeutic target for AD and blocking microglia-astrocyte activation could limit neurodegeneration in AD. Here we report that NLY01, an engineered exedin-4, glucagon-like peptide-1 receptor (GLP-1R) agonist, selectively blocks β-amyloid (Aβ)-induced activation of microglia through GLP-1R activation and inhibits the formation of reactive astrocytes as well as preserves neurons in AD models. In two transgenic AD mouse models (5xFAD and 3xTg-AD), repeated subcutaneous administration of NLY01 blocked microglia-mediated reactive astrocyte conversion and preserved neuronal viability, resulting in improved spatial learning and memory. Our study indicates that the GLP-1 pathway plays a critical role in microglia-reactive astrocyte associated neuroinflammation in AD and the effects of NLY01 are primarily mediated through a direct action on Aβ-induced GLP-1R+ microglia, contributing to the inhibition of astrocyte reactivity. These results show that targeting upregulated GLP-1R in microglia is a viable therapy for AD and other neurodegenerative disorders.

Keywords: Alzheimer’s disease; GLP-1 receptor; GLP-1R agonist; Microglia activation; NLY01; Reactive astrocytes.


Conflict of interest statement

J.S.P., K.C.L., E.J.P., and S.L. are employees of D&D Pharmatech. Sa.L., Y.O., S.H.K., and S.L. are employees of Neuraly. M.G.P., H.S.K., V.L.D, T.M.D., and S.L. hold ownership equity of D&D Pharmatech and this arrangement has been reviewed and approved by the Johns Hopkins University in accordance with its conflict of interest policies.

Figures

Fig. 1
Fig. 1
NLY01 ameliorates behavioral deficits in 5xFAD mice. 3-month-old 5xFAD mice were treated with PBS or NLY01 (1 or 10 mg/kg) subcutaneously (s.c.) for 4 months (n = 9–13 per group). a Mice were trained and tested on the spatial memory version of the Morris water maze (MWM; indicated by solid lines at 60 s escape latency) (n = 9–13 per group). b Representative swimming traces for training trials on day 5 are shown. c Mice were given a memory probe with the platform removed at 24 h after the last training trial (n = 9–13 per group). d Representative swimming traces of the memory test at 24 h after the last training trial. e Swimming speed of WT mice and 5xFAD mice treated with vehicle or NLY01 (1 or 10 mg/kg) (n = 9–13 per group). f Mice were tested on a spatial alternation task in a Y-maze (n = 11–13 per group). Data are shown as the mean ± SEM. p values were determined by one-way ANOVA. #p < 0.05, ###p < 0.001 versus WT + PBS; *p < 0.05 versus 5xFAD + PBS
Fig. 2
Fig. 2
GLP-1R is increased in the hippocampus of AD brains and in microglia exposed to Aβ1-42. a, b Relative GLP-1R mRNA expression in the hippocampus from the brain of a AD patients (n = 6 per group) and b 5xFAD mice (7-month-old; n = 7 per group). c Representative confocal images with GLP-1R (red) and DAPI (blue) in the hippocampus of 5xFAD mice (scale bars, 20 μm) and quantification of the GLP-1R immunostaining (n = 4 per group). d Representative confocal images of immunostaining with GLP-1R (red), MAP2 (green; upper), GFAP (green; middle), Iba-1 (green; lower), and DAPI (blue) in the hippocampus from 3xTg-AD mice (12-month-old; n = 3) (scale bar, 50 μm). e Primary astrocytes, microglia, and neurons were incubated with oligomeric Aβ1-42 (1 μM) for 4 h. The levels of GLP-1R (exposed to a short or long time), GFAP, Iba-1, Tuj1, and β-actin were determined using Western blot. Quantification of GLP-1R is shown as relative protein expression normalized to β-actin (n = 3 biologically independent cell cultures). Data are shown as the mean ± SEM. p values were determined by two-tailed unpaired t-test or one-way ANOVA. #p < 0.05, ##p < 0.01 versus WT or astrocyte + PBS; **p < 0.01 versus microglia + PBS
Fig. 3
Fig. 3
NLY01 suppresses Aβ-induced microglia activation. a Primary microglia were pre-treated with PBS or NLY01 (1 μM) for 30 min, and then further incubated with oligomeric Aβ1-42 (1 μM) for 4 h. mRNA levels of TNF-α, C1q, IL-1α, IL-1β, and IL-6 were determined using qPCR (n = 3 biologically independent cell cultures). b Cytokine release in media from primary microglia incubated with oligomeric Aβ1-42 (1 μM) for 18 h. TNF-α, C1q, IL-1α, and IL-1β were measured by ELISA (n = 4 biologically independent cell cultures). c GLP-1R and β-actin expression in lenti-CRISPR/Cas9 mediated GLP-1R KO microglia. Quantification of GLP-1R shown as relative protein expression normalized to β-actin (n = 3 biologically independent cell cultures). d mRNA levels of TNF-α, C1q, IL-1α, IL-1β, and IL-6 in oligomeric Aβ1-42 (1 μM) treated lenti-CRISPR/Cas9 mediated GLP-1R KO microglia (n = 4 biologically independent cell cultures). e Levels of TNF-α, C1q, IL-1α, and IL-6 analyzed by qPCR in the hippocampus of 5xFAD mice treated with PBS or NLY01 (n = 5–8 per group). Data are shown as the mean ± SEM. p values were determined by two-tailed unpaired t-test or one-way ANOVA. #p < 0.05, ##p < 0.01, ###p < 0.001, ####p < 0.0001 versus Control + PBS or WT + PBS; *p < 0.05, **p < 0.01, ***p < 0.001, ****p < 0.0001 versus Aβ1-42 + PBS or 5xFAD + PBS
Fig. 4
Fig. 4
Inhibition of Aβ-induced reactive astrocytes by NLY01. a Schematic diagram showing the treatment of astrocytes with MCM from Aβ1-42 treated microglia with or without NLY01. mRNA levels of primary astrocytes 24 h post treatment with MCM from oligomeric Aβ1-42 (1 μM)-activated microglia with or without NLY01 (1 μM) is shown (n = 3 biologically independent cell cultures). b Levels of GFAP, C3, and β-actin in the hippocampus of WT and 5 × FAD mice treated with PBS or NLY01 using Western blot. c Relative GFAP and C3 protein levels were normalized versus β-actin levels (n = 4 per group). d mRNA levels of astrocyte signatures in the isolated astrocytes from the hippocampus of WT and 5 × FAD mice treated with PBS or NLY01 using qPCR. GAPDH was used to normalize for the amounts of cDNA (n = 4 per group). Data are shown as the mean ± SEM. p values were determined by one-way ANOVA. #p < 0.05, ##p < 0.01, ###p < 0.001, ####p < 0.0001 versus Control MCM or WT + PBS; *p < 0.05, **p < 0.01, ***p < 0.001, ****p < 0.0001 versus Aβ1-42 MCM or 5xFAD + PBS
Fig.5
Fig.5
Effects of NLY01 on neuronal cell death caused by Aβ1-42-induced DAA. a Schematic diagram showing treatment of neurons with Aβ1-42-astrocyte conditioned media (ACM) or directly with Aβ1-42. b Representative images showing the death of mouse primary cortical neurons (left; Propidium iodide stain in red indicates the dead cells) and quantification of cell death caused by Aβ1-42-ACM (15 μg/ml) with or without NLY01 (1 μM) (n = 6, 2 technical repeats from 3 biologically independent cell cultures). c Quantification of cell death caused by Aβ1-42-ACM (50 μg/mL) with or without NLY01 (1 μM) in human cortical neurons (n = 8, 2 technical repeats from 4 biologically independent cell cultures). d Quantification of cell death caused by Aβ1-42 treatment (5 μM) with or without NLY01 (1 μM) in human cortical neurons (n = 6). e Protein expression of MAP2, BDNF, Bcl-2, and β-actin in the hippocampus of WT and 5xFAD mice treated with PBS or NLY01. f MAP2, BDNF and Bcl-2 protein levels were normalized versus β-actin levels (n = 4 per group). g, h Aβ plaques were stained using 4G8 antibody in WT or 5xFAD mice with NLY01 treatment. g Representative images of immunostaining with 4G8 (scale bar, 200 μm) and h quantification of Aβ plaque number and Aβ load (n = 4 per group). Data are shown as the mean ± SEM. p values were determined by one-way ANOVA. #p < 0.05, ##p < 0.01, ###p < 0.001, ####p < 0.0001 versus Control or WT + PBS; *p < 0.05, **p < 0.01, ***p < 0.001, ****p < 0.001 versus Aβ-ACM, Aβ, or 5xFAD + PBS
Fig. 6
Fig. 6
Effects of NLY01 on 3 × Tg-AD mice. 7-month-old 3 × Tg-AD mice treated with PBS or NLY01 (1 or 10 mg/kg) subcutaneously (s.c.) for 5 months (n = 6–8 per group). a Mice were trained and tested on the spatial memory version of the Morris water maze (MWM; indicated by solid lines at 60 s escape latency) (n = 6–8 per group). b Mice were given a memory probe with the platform removed at 24 h after the last training trial. 3 × Tg-AD mice treated with NLY01 exhibited dose-dependently increased time in the target quadrant (n = 6–8 per group). c Mice were placed in a light compartment and received a mild foot shock upon crossing over to the dark compartment. Mice were tested for retention of memory at 24 h after training (n = 6–8 per group). d Mice were tested on a spatial alternation task in a Y-maze (n = 6–8 per group). e The levels of TNF-α, C1q, IL-1β, IFN-γ, and IL-6 were analyzed by qPCR in the hippocampus of mice treated with PBS or NLY01 (n = 3–5 per group). f Protein expression of GFAP and C3 in the hippocampus from WT and 3xTg-AD mice treated with PBS or NLY01 using Western blot. g GFAP and C3 protein levels were normalized versus GAPDH levels (n = 4 per group). h Representative images of western blot with MAP2, BDNF, and Bcl-2. i Protein levels of (h) were normalized versus β-actin levels (n = 4 per group). Data are shown as the mean ± SEM. p values were determined by one-way ANOVA. #p < 0.05, ##p < 0.01, ###p < 0.001, ####p < 0.0001 versus WT + PBS; *p < 0.05, **p < 0.01, ***p < 0.001, ****p < 0.0001 versus 3xTg-AD + PBS

References

    1. Alzheimer's A. 2016 Alzheimer's disease facts and figures. Alzheimers Dement. 2016;12:459–509. doi: 10.1016/j.jalz.2016.03.001. - DOI - PubMed
    1. Anderson MA, Burda JE, Ren Y, Ao Y, O'Shea TM, Kawaguchi R, Coppola G, Khakh BS, Deming TJ, Sofroniew MV. Astrocyte scar formation aids central nervous system axon regeneration. Nature. 2016;532:195–200. doi: 10.1038/nature17623. - DOI - PMC - PubMed
    1. Andrabi SA, Kang HC, Haince JF, Lee YI, Zhang J, Chi Z, West AB, Koehler RC, Poirier GG, Dawson TM, Dawson VL. Iduna protects the brain from glutamate excitotoxicity and stroke by interfering with poly(ADP-ribose) polymer-induced cell death. Nat Med. 2011;17:692–699. doi: 10.1038/nm.2387. - DOI - PMC - PubMed
    1. Bomba M, Ciavardelli D, Silvestri E, Canzoniero LM, Lattanzio R, Chiappini P, Piantelli M, Di Ilio C, Consoli A, Sensi SL. Exenatide promotes cognitive enhancement and positive brain metabolic changes in PS1-KI mice but has no effects in 3xTg-AD animals. Cell Death Dis. 2013;4:e612. doi: 10.1038/cddis.2013.139. - DOI - PMC - PubMed
    1. Booth HDE, Hirst WD, Wade-Martins R. The role of astrocyte dysfunction in Parkinson's disease pathogenesis. Trends Neurosci. 2017;40:358–370. doi: 10.1016/j.tins.2017.04.001. - DOI - PMC - PubMed

Publication types

MeSH terms