

The impact of central foveal thickness and integrity of the outer retinal layers in the visual outcome of uveitic macular edema
- PMID: 33902745
- PMCID: PMC8077744
- DOI: 10.1186/s40942-021-00306-8
The impact of central foveal thickness and integrity of the outer retinal layers in the visual outcome of uveitic macular edema
Abstract
Background: To analyze the relationship between the central foveal thickness (CFT) and the integrity of the ellipsoid portion of inner segments (EPIS) and interdigitating zone (IZ) retinal layers in the visual outcome of uveitic macular edema (UME).
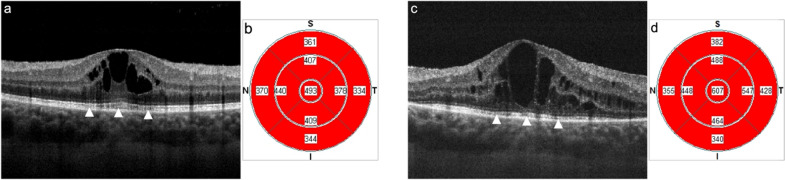
Methods: Prospective, observational, and cross-sectional study of eyes with UME. Spectral-domain optical coherence tomography (SD-OCT) macular morphological pattern, CFT, and integrity of the outer retinal layers were analyzed. We arranged the data by EPIS or IZ integrity and contrasted it with student t-test (quantitative variables) and Fisher exact test or χ² distribution (categorical variables) to evaluate visual impairment and retinal measures. Receiver operator curve (ROC) estimation and logistic regression (probit) assessed if the sample´s variance could be associated with IZ or EPIS integrity.
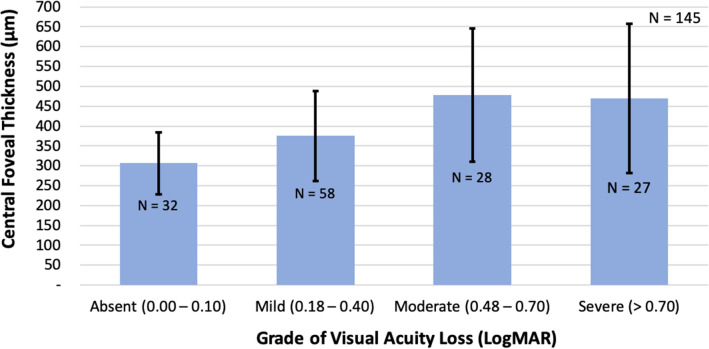
Results: We included 145 SD-OCT macular scans from 45 patients at different stages of UME. Cystoid macular edema (CME) increased the risk of severe (P ≤ 0.0162) and moderate visual loss (P ≤ 0.0032). The highest CFT values occurred in patients with moderate (478.11 ± 167.62 μm) and severe (449.4 ± 224.86 μm) visual loss. Of all morphological patterns of macular edema, only CME showed a statistically significant relationship with severe visual impairment (44.92%, p = 0.0035, OR 4.29 [1.62-11.4]). Likewise, an increased probability of severe visual loss correlated negatively with both, IZ (37.93%, P ≤ 0.001, OR 10.02) and EPIS (38.98%, P ≤ 0.001, OR 13.1) disruption. A CFT > 337 μm showed a higher probability of IZ (AUROC = 0.7341, SEN 77.59%, ESP 65.52) and EPIS (AUROC = 0.7489, SEN 76.37%, ESP 65.12%) loss of integrity. Moreover, when BCVA reached 0.44 LogMAR (≤ 20/50 Snellen eq.), it was more likely to have IZ (AUROC = 0.8706, ESP 88.51%, SEN 77.59%) and EPIS (AUROC = 0.8898, ESP 88.3%, SEN 76.27) disruption.
Conclusions: Significantly increased CFT has a higher probability for EPIS and IZ disruption, which significantly increases the risk for irreversible visual loss in eyes with UME. Evaluating these layers' integrity by optical coherence tomography helps predict the visual outcome and make the right therapeutic decisions. Trial registration The study was registered on April 13, 2020, at the Instituto Tecnologico y de Estudios Superiores de Monterrey Research Committee (License No. COFEPRIS 20 CI 19 039 002), project registration No. P000338-CAVICaREMU-CI-CR002, and the Ethics Committee (License No. CONBIOETICA 19 CEI 011-2016-10-17), project registration No. P000338-CAVICaREMU-CEIC-CR002.
Keywords: Central foveal thickness; Cystoid macular edema; Diffuse macular edema; EPIS, interdigitation zone; Macular edema; SD-OCT; Subretinal fluid; Uveitis; Visual loss.
Conflict of interest statement
The authors declare that they have no competing interests.
Figures


References
-
- Markomichelakis NN, Halkiadakis I, Pantelia E, Peponis V, Patelis A, Theodossiadis P, et al. Patterns of macular edema in patients with uveitis: qualitative and quantitative assessment using optical coherence tomography. Ophthalmology. 2004;111:946–53. doi: 10.1016/j.ophtha.2003.08.037. - DOI - PubMed
LinkOut - more resources
Full Text Sources
Miscellaneous
