Review
. 2021 May:326:106932.
doi: 10.1016/j.jmr.2021.106932.

Deuterium metabolic imaging - Back to the future

Affiliations
Review

Deuterium metabolic imaging - Back to the future

Henk M De Feyter et al. J Magn Reson. 2021 May.

Abstract

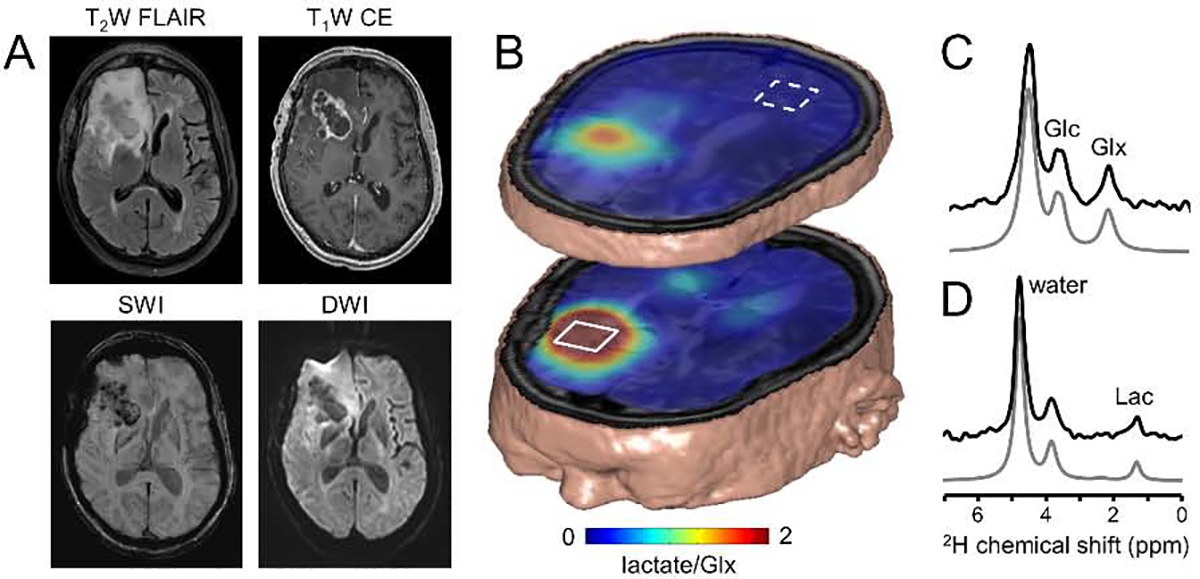
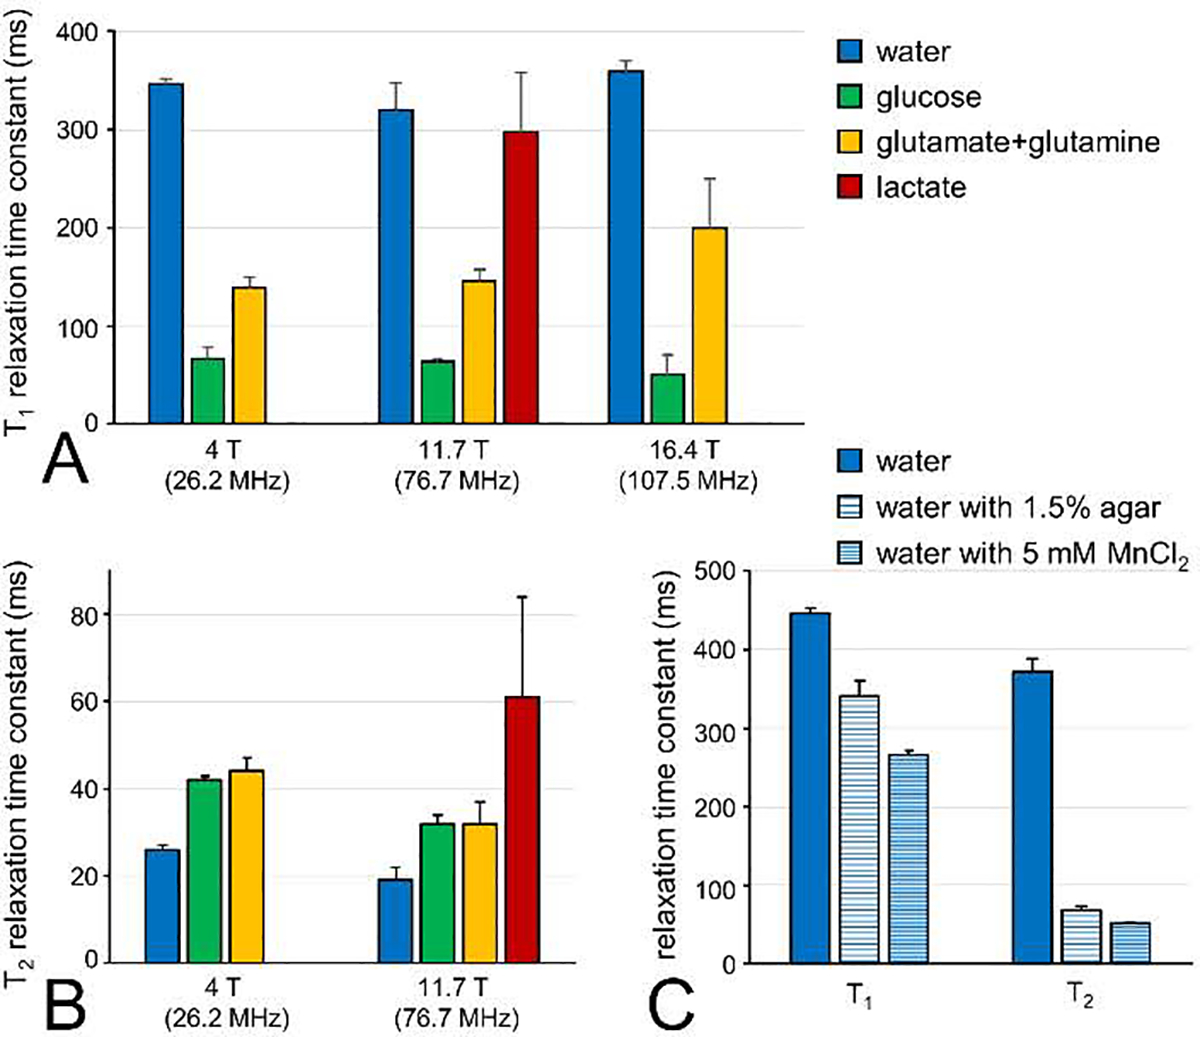
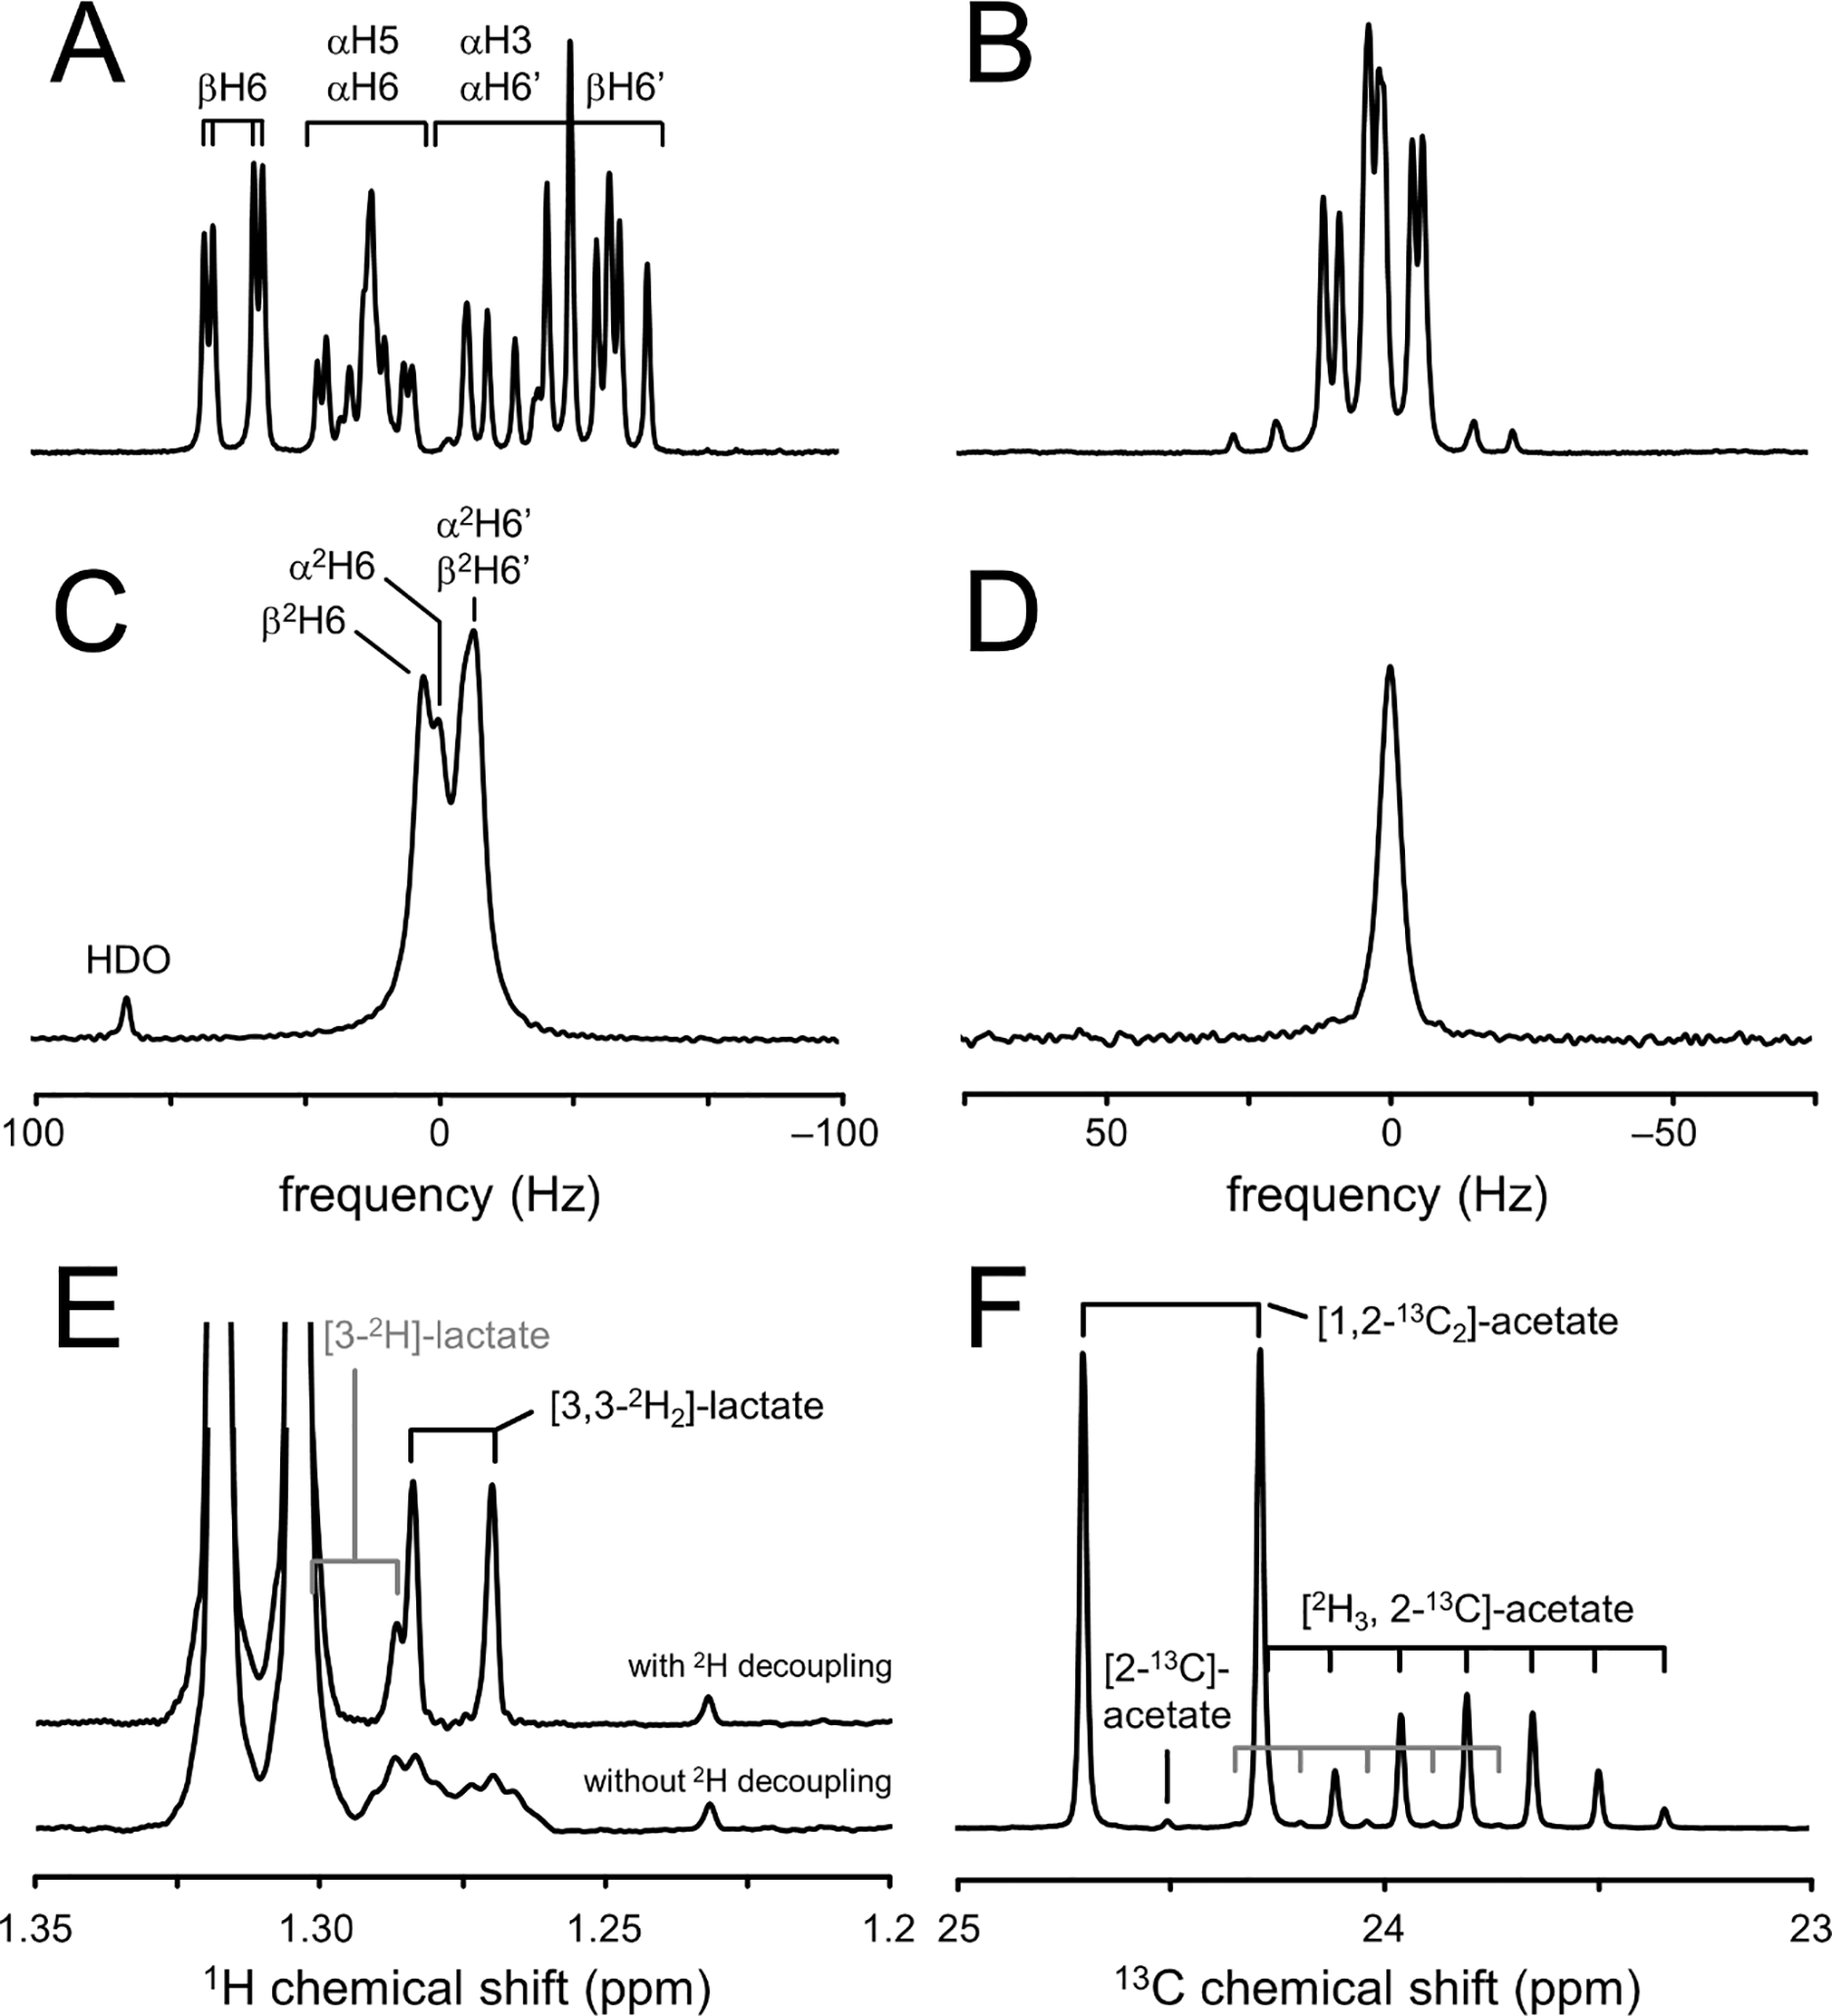
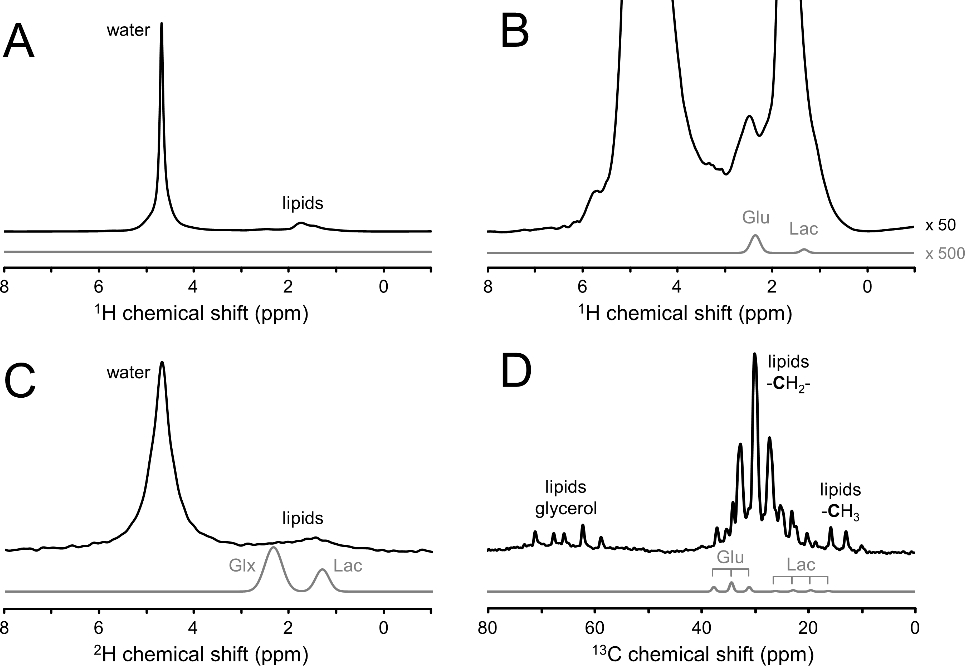
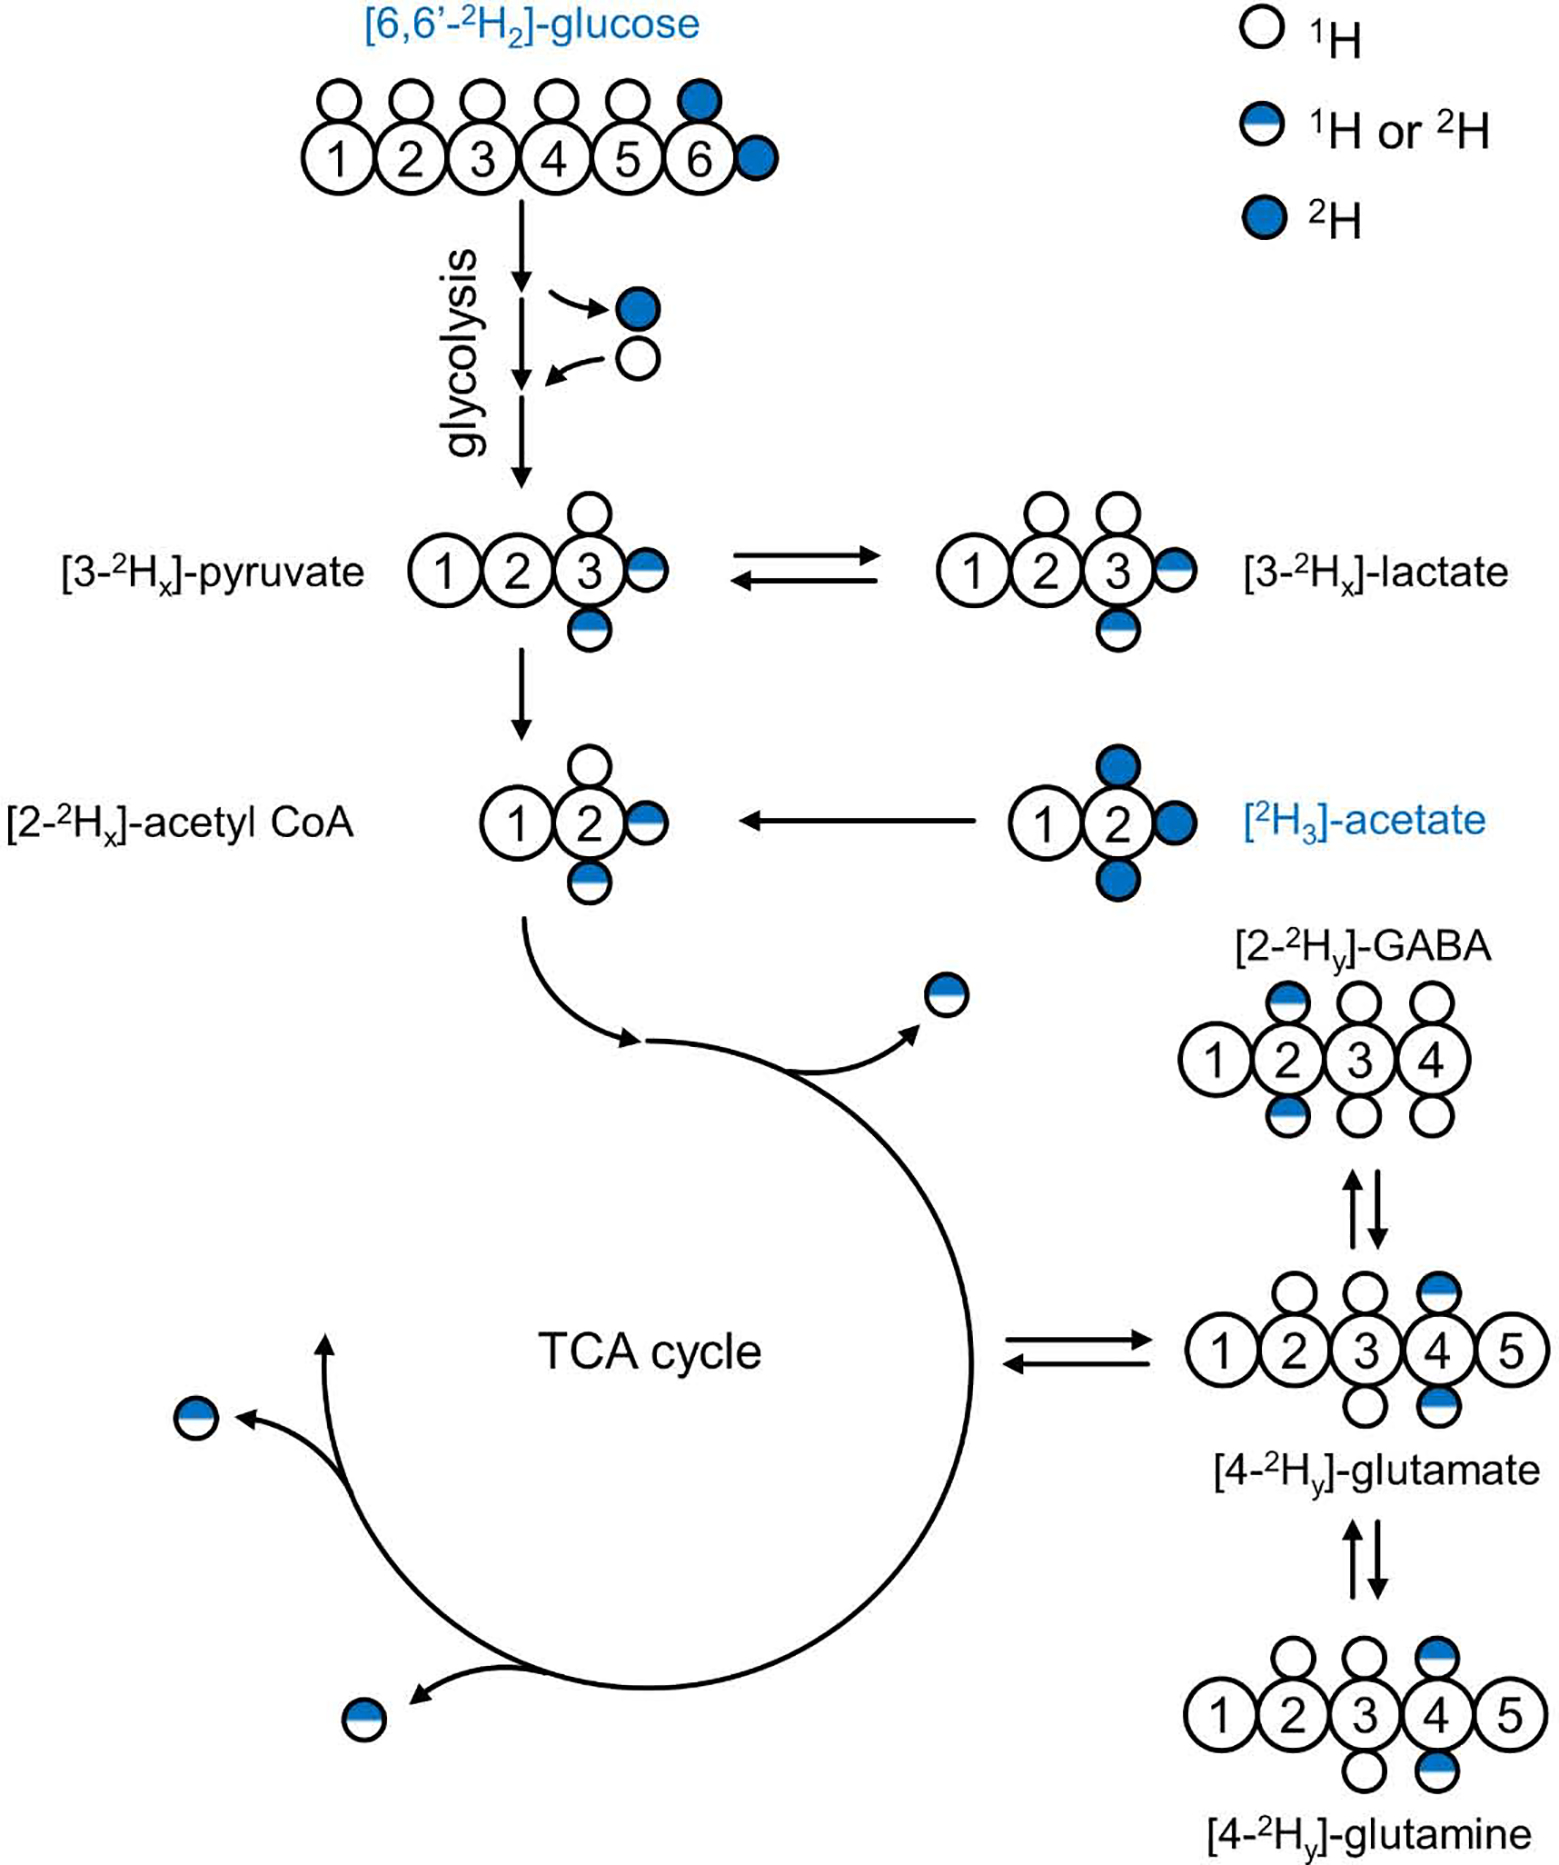
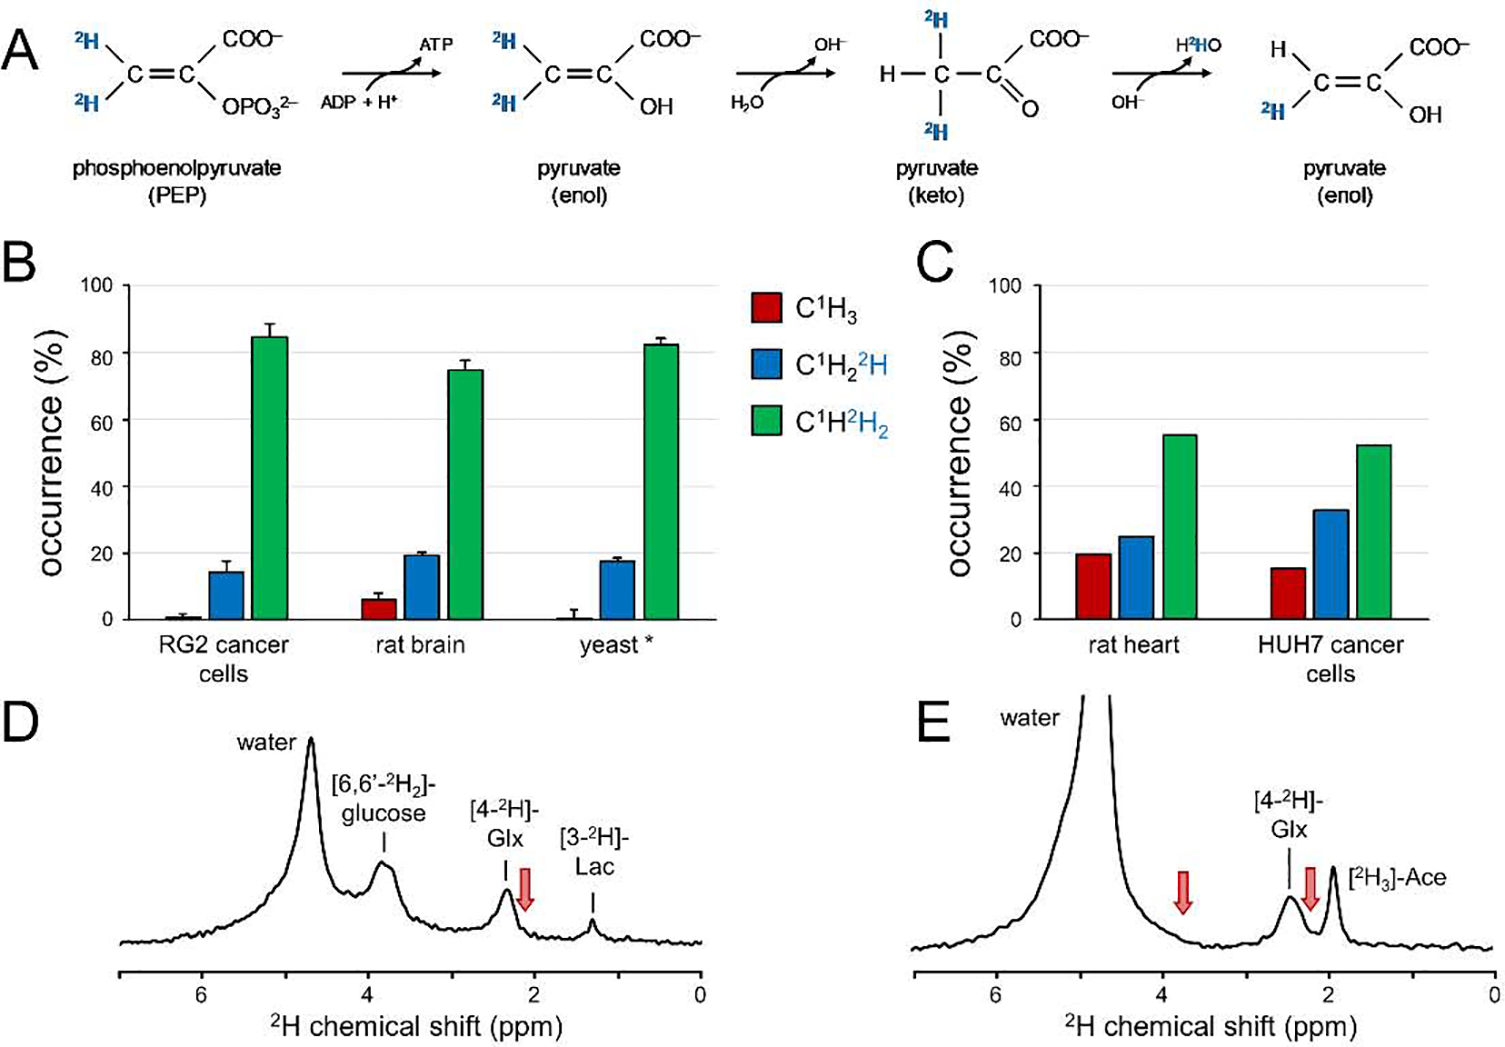
Deuterium metabolic spectroscopy (DMS) and imaging (DMI) have recently been described as simple and robust MR-based methods to map metabolism with high temporal and/or spatial resolution. The metabolic fate of a wide range of suitable deuterated substrates, including glucose and acetate, can be monitored with deuterium MR methods in which the favorable MR characteristics of deuterium prevent many of the complications that hamper other techniques. The short T1 relaxation times lead to good MR sensitivity, while the low natural abundance prevents the need for water or lipid suppression. The sparsity of the deuterium spectra in combination with the low resonance frequency provides relative immunity to magnetic field inhomogeneity. Taken together, these features combine into a highly robust metabolic imaging method that has strong potential to become a dominant MR research tool and a viable clinical imaging modality. This perspective reviews the history of deuterium as a metabolic tracer, the use of NMR as a detection method for deuterium in vitro and in vivo and the recent development of DMS and DMI. Following a review of the NMR characteristics and the biological effects of deuterium, the promising future of DMI is outlined.

Keywords: Deuterium; Glucose; Label loss; Metabolic imaging; Relaxation.


Conflict of interest statement

Declaration of Competing Interest The authors declare that they have no known competing financial interests or personal relationships that could have appeared to influence the work reported in this paper.

Figures

Fig. 1.
Fig. 1.
The future of deuterium metabolic imaging (DMI) as an integral part of MR-based clinical diagnosis. (A) Clinical MR images acquired as standard-of-care in a patient diagnosed with glioblastoma multiforme (GBM) in the right frontal lobe. MR images include T2-weighted fluid-attenuated inversion recovery (T2W FLAIR), T1-weighted contrast-enhanced imaging (T1W CE), susceptibility-weighted imaging (SWI) and diffusion-weighted imaging (DWI). (B) Metabolic image depicting the lactate/Glx ratio or Warburg effect ratio as calculated from DMI-based metabolic maps obtained circa 60–75 min following oral [6,60 −2H2]-glucose administration. The 3D DMI lactate/Glx ratio map is combined with a 3D T2W MRI. (C, D) Single-voxel 2H NMR spectra extracted from the 9 × 13 × 11 DMI data in (C) normal-appearing occipital lobe (white square, dotted line) and (D) within the lesion (white square, solid line). Glc, Glx and Lac refer to the administered metabolic substrate, [6,60 −2H2]-glucose, and the primary metabolic products, [4–2H]-glutamate + glutamine and [3–2H]-lactate, respectively. Original data and extended experimental details can be found in De Feyter et al, Sci. Adv. 4, eaat7314 (2018).
Fig. 2.
Fig. 2.
Deuterium T1 and T2 relaxation time constants in brain in vivo and phantoms in vitro. (A) 2HT1 relaxation time constants measured for natural abundance water,[6,60 −2H2]-glucose and [4–2H]-glutamate + glutamine in human (4 T) or rat brain (11.7 T and 16.4 T) in vivo and [3–2H]-lactate on rat brain post mortem (11.7 T). The inversion-recovery-based T1 values determined at 4 T/11.7 T and 16.4 T were reported by De Feyter et al (5) and Lu et al (4), respectively. (B) 2HT2 relaxation time constants measured for natural abundance water, [6,60 −2H2]-glucose and [4–2H]-glutamate + glutamine in human (4 T) or rat brain (11.7 T) in vivo and [3–2H]-lactate on rat brain post mortem (11.7 T). All T2 values were based on Hahn spin-echo measurements. (C) 2HT1 and T2 relaxation time constants for natural abundance water in vitro. Measurements were performed on deionized water, deionized water mixed with 1.5% agar and deionized water mixed with 5 mM MnCl2. All bars represent mean ± SD.
Fig. 3.
Fig. 3.
Chemical shift and scalar coupling effects in deuterated compounds. (A) 1H NMR spectrum of glucose in aqueous buffer (pH 7.0) shows a complex splitting pattern for the signals between 3.6 and 4.0 ppm due to extensive homonuclear scalar coupling and the anomeric forms of glucose. (B) 1H NMR spectrum of the H4/H40 protons in glutamate display a similarly complex pattern due to strong homonuclear scalar coupling. (C, D) 2H NMR spectra of (C) [6,60 −2H2]-glucose and (D) [2,4,40 −2H3]-glutamate in aqueous buffer. The complex 1H NMR patterns have essentially collapsed to singlet resonances for [2–2H]-glutamate (not shown) and [4,40 −2H2]-glutamate and a four-peak spectrum for [6,60 −2H2]-glucose due to the anomeric forms and the different chemical shifts for the 2H6 and 2H60 positions. Note that all spectra in (A-D) are in units of hertz, allowing a direct comparison between the 1H and 2H line widths. (E) 1H NMR spectrum of rat brain extract obtained two hours following the intravenous infusion of [6,60 −2H2]-glucose. The lactate signals at circa 1.3 ppm are dominated by non-deuterated lactate with smaller contributions from single and double-deuterated forms. Without 2H decoupling (lower trace) the deuterated lactate signals are broad and difficult to quantify due line broadening as a result of 1H–2H scalar coupling (2J(1H–2H) ~ 1 Hz). 2H decoupling (upper trace) effectively removes the effects of 1H–2H scalar coupling, thus reducing the lactate multiplets to doublets. Lactate, [3–2H]-lactate and [3,30 −2H2]-lactate can be separately quantified due to the deuterium isotope shift of circa −17 ppb per attached deuteron. (F) 13C NMR spectrum with broadband 1H decoupling of a solution containing 100 mM [1,2–13C2]-acetate and 100 mM [2H3,2–13C]-acetate in aqueous buffer. The triple deuterated acetate signal is characterized by a large isotope shift of circa −235 ppb per deuteron and extensive 2H–13C scalar coupling (1J(2H–13C) ~ 20 Hz) that gives rise to a 1:3:6:7:6:3:1 septet multiplet. A small amount of double-deuterated acetate contamination can be observed as a 1:2:3:2:1 quintet signal (gray lines). All data was acquired at 11.7 T, providing Larmor frequencies of 500.1, 76.7 and 125.7 MHz for 1H, 2H and 13C, respectively.
Fig. 4.
Fig. 4.
Dynamic range difference between signals of interest (glutamate and lactate) and interfering signals (water and lipids) in 1H, 2H and 13C NMR spectra of the human head. All experimental signals are obtained with transmit-receive surface coils (circa 90 mm diameter) tuned to the Larmor frequency under investigation and acquired with a pulse-acquire method. The transmit power of the excitation pulse was adjusted to approximately match the detection volumes for 1H, 2H and 13C NMR. Experimental (A, B) 1H NMR spectrum (black line, TR = 3000 ms, 1 average), (C) 2H NMR spectrum (black line, TR = 333 ms, 180 averages) and (D) 13C NMR spectrum (black line, TR = 3000 ms, 128 averages) obtained from human head. The signals of interest (glutamate and lactate for 1H and 13C, and glutamate + glutamine (Glx) and lactate for 2H) are indicated by light gray lines as Gaussian lines with the amplitudes scaled to approximate natural abundance for 1H and a steady-state enrichment for 2H and 13C following the administration of [6,60 −2H2]-glucose or [1–13C]-glucose, respectively. Note that experimental and simulated spectra have the same vertical scale, except in (B) where the experimental and simulated 1H spectra are scaled by 50 and 500, respectively, as compared to (A).
Fig. 5.
Fig. 5.
Deuterium label flow through glycolysis and the TCA cycle. Using [6,60 −2H2]-glucose as metabolic substrate results in 2H label transfer, via the glycolytic pathway, to the methyl groups of pyruvate, lactate and acetyl-CoA. Several glycolytic conversion and exchange reactions (see text for details) lead to loss of 2H label to the large, non-specific water pool, resulting in a non-stoichiometric relation between 2H-labeled substrate and product (i.e., 0 < x < 2). Following entry into the TCA cycle additional 2H label loss occurs after which the 2H label ends up in the H4/40 position of glutamate and glutamine and the H2/H20 position of GABA (0 < y < x). Continuing down the TCA cycle will lead to complete 2H label loss (see also Fig. 6). The substrate [2H3]-acetate enters the metabolic pathways at the level of acetyl-CoA, thus bypassing glycolysis and the associated 2H label losses. Note that the amount of 2H label, y, in downstream products is generally not the same when using [6,60 −2H2]-glucose or [2H3]-acetate as substrate.
Fig. 6.
Fig. 6.
Deuterium label loss in 2H isotope labeling studies. (A) 2H label loss due to enol-keto tautomerism of pyruvate. (B, C) 2H label distribution in lactate of different organisms when using (B) [6,60 −2H2]-glucose or (C) [U-2H7]-glucose as metabolic substrate. * The 2H label distribution in yeast reflects that in the methyl group of ethanol, the product of anaerobic glycolysis during fermentation. See text for details and references. (D, E) Global 2H MR spectra (TR 333 ms, 180 averages, 11.7 T) of rat brain in vivo 90 min following the intravenous infusion of (D) [6,60 −2H2]-glucose or (E) [2H3]-acetate (Ace). 2H label accumulates primarily in the H4/H40 position of glutamate and glutamine with a clear absence of labeling in the glutamate + glutamine H3/H30 (at ~ 2.1 ppm) and H2 (at ~ 3.7 ppm) positions (red arrows). Note that the water signal is substantially higher in (E) since a typical [2H3]-acetate infusion delivers circa three times more 2H label to the animal as compared to a [6,60 −2H2]-glucose study. (For interpretation of the references to colour in this figure legend, the reader is referred to the web version of this article.)

References

    1. Maudsley AA, Andronesi OC, Barker PB, Bizzi A, Bogner W, Henning A, Nelson SJ, Posse S, Shungu DC, Soher BJ. Advanced magnetic resonance spectroscopic neuroimaging: Experts’ consensus recommendations. NMR Biomed 2020:e4309. - PMC - PubMed
    1. Rothman DL, de Graaf RA, Hyder F, Mason GF, Behar KL, De Feyter HM. In vivo 13C and 1H-[13C] MRS studies of neuroenergetics and neurotransmitter cycling, applications to neurological and psychiatric disease and brain cancer. NMR Biomed 2019;32(10):e4172. - PubMed
    1. Nelson SJ, Kurhanewicz J, Vigneron DB, Larson PE, Harzstark AL, Ferrone M, van Criekinge M, Chang JW, Bok R, Park I, Reed G, Carvajal L, Small EJ, Munster P, Weinberg VK, Ardenkjaer-Larsen JH, Chen AP, Hurd RE, Odegardstuen LI, Robb FJ, Tropp J, Murray JA. Metabolic imaging of patients with prostate cancer using hyperpolarized [1-13C]pyruvate. Science translational medicine 2013;5:198ra108. - PMC - PubMed
    1. Lu M, Zhu XH, Zhang Y, Mateescu G, Chen W. Quantitative assessment of brain glucose metabolic rates using in vivo deuterium magnetic resonance spectroscopy. J Cereb Blood Flow Metab 2017;37:3518–3530. - PMC - PubMed
    1. De Feyter HM, Behar KL, Corbin ZA, Fulbright RK, Brown PB, McIntyre S, Nixon TW, Rothman DL, de Graaf RA. Deuterium metabolic imaging (DMI) for MRI-based 3D mapping of metabolism in vivo. Sci Adv 2018;4(8):eaat7314. - PMC - PubMed

Publication types

LinkOut - more resources