. 2021 Aug;80(8):1070-1074.
doi: 10.1136/annrheumdis-2020-219760. Epub 2021 Apr 26.

Linking chondrocyte and synovial transcriptional profile to clinical phenotype in osteoarthritis

Affiliations

Linking chondrocyte and synovial transcriptional profile to clinical phenotype in osteoarthritis

Julia Steinberg et al. Ann Rheum Dis. 2021 Aug.

Abstract

Objectives: To determine how gene expression profiles in osteoarthritis joint tissues relate to patient phenotypes and whether molecular subtypes can be reproducibly captured by a molecular classification algorithm.

Methods: We analysed RNA sequencing data from cartilage and synovium in 113 osteoarthritis patients, applying unsupervised clustering and Multi-Omics Factor Analysis to characterise transcriptional profiles. We tested the association of the molecularly defined patient subgroups with clinical characteristics from electronic health records.

Results: We detected two patient subgroups in low-grade cartilage (showing no/minimal degeneration, cartilage normal/softening only), with differences associated with inflammation, extracellular matrix-related and cell adhesion pathways. The high-inflammation subgroup was associated with female sex (OR 4.12, p=0.0024) and prescription of proton pump inhibitors (OR 4.21, p=0.0040). We identified two independent patient subgroupings in osteoarthritis synovium: one related to inflammation and the other to extracellular matrix and cell adhesion processes. A seven-gene classifier including MMP13, APOD, MMP2, MMP1, CYTL1, IL6 and C15orf48 recapitulated the main axis of molecular heterogeneity in low-grade knee osteoarthritis cartilage (correlation ρ=-0.88, p<10-10) and was reproducible in an independent patient cohort (ρ=-0.85, p<10-10).

Conclusions: These data support the reproducible stratification of osteoarthritis patients by molecular subtype and the exploration of new avenues for tailored treatments.

Keywords: chondrocytes; inflammation; osteoarthritis.


Conflict of interest statement

Competing interests: None declared.

Figures
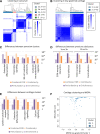
Figure 1
Figure 1
Distinct molecularly defined patient clusters identified in low-grade OA cartilage and synovium tissue. (A) Two clusters of patients based on consensus clustering of synovium RNA data. Each cluster formed two subclusters, with one outlier sample. (B) Two clusters of patients based on consensus clustering of low-grade OA cartilage RNA data. (C) Gene expression differences between synovium clusters show several significant (false discovery rate <5%) associations related to inflammation and osteoclast differentiation using Signalling Pathway Impact Analysis (SPIA). Here and below, P: p values based on enrichment of genes; perturbation of the pathway based on gene log-fold differences; or combining enrichment and perturbation. The associations shown are robust across several gene-level differential expression cut-offs (online supplemental table 1). (D) Gene expression differences between the synovium subclusters within each cluster show similar pathway associations, including to ECM–receptor interaction and focal adhesion pathways. (E) Gene expression differences between low-grade OA cartilage clusters show significant associations with inflammation and osteoclast differentiation pathways. (F) An analysis of low-grade OA cartilage samples using MOFA identifies a continuous spectrum of variation between samples, which corresponds to the identified clusters. Samples with intermediate MOFA factor 1 scores have lower Silhouette scores, showing more uncertainty in cluster assignment. For synovium, see online supplemental figure 3. ECM, extracellular matrix; FDR, false discovery rate; MOFA, Multi-Omics Factor Analysis; OA, osteoarthritis.
Figure 2
Figure 2
Clustering and main axis of variation within knee low-grade OA cartilage can be recapitulated using a seven-gene classifier. (A) PAMR scores for each gene in the seven-gene knee OA classifier (the difference between the standardised centroids of the two clusters) and the differential expression of the genes between the two low-grade OA cartilage clusters. See online supplemental figure 5 for classifier performance. (B) The PAMR posterior probabilities for cluster assignment are highly correlated with MOFA factor 1 scores for knee low-grade OA cartilage samples, capturing the main continuous spectrum of variation between samples. Inset: Spearman correlation, p<10−10. (C) In an independent set of 60 low-grade OA cartilage samples from 60 knee OA patients, the posterior probabilities for cluster assignment from the seven-gene classifier are well correlated with the continuous spectrum of variation in these samples, as quantified by the first MOFA factor in an ab initio analysis. Inset: Spearman’s correlation, p<10−10. IL, interleukin; MOFA, Multi-Omics Factor Analysis; OA, osteoarthritis.

References

    1. Fernández-Tajes J, Soto-Hermida A, Vázquez-Mosquera ME, et al. . Genome-Wide DNA methylation analysis of articular chondrocytes reveals a cluster of osteoarthritic patients. Ann Rheum Dis 2014;73:668–77. 10.1136/annrheumdis-2012-202783 - DOI - PubMed
    1. Soul J, Dunn SL, Anand S, et al. . Stratification of knee osteoarthritis: two major patient subgroups identified by genome-wide expression analysis of articular cartilage. Ann Rheum Dis 2018;77:423. 10.1136/annrheumdis-2017-212603 - DOI - PMC - PubMed
    1. Patro R, Duggal G, Love MI, et al. . Salmon provides fast and bias-aware quantification of transcript expression. Nat Methods 2017;14:417–9. 10.1038/nmeth.4197 - DOI - PMC - PubMed
    1. Soneson C, Love MI, Robinson MD. Differential analyses for RNA-Seq: transcript-level estimates improve gene-level inferences. F1000Res 2015;4:1521. 10.12688/f1000research.7563.1 - DOI - PMC - PubMed
    1. Law CW, Chen Y, Shi W, et al. . voom: precision weights unlock linear model analysis tools for RNA-seq read counts. Genome Biol 2014;15:R29. 10.1186/gb-2014-15-2-r29 - DOI - PMC - PubMed

Publication types