Review
. 2021 Oct 1;13(10):a040386.
doi: 10.1101/cshperspect.a040386.

The Stochastic Genome and Its Role in Gene Expression

Affiliations
Review

The Stochastic Genome and Its Role in Gene Expression

Christopher H Bohrer et al. Cold Spring Harb Perspect Biol. .

Abstract

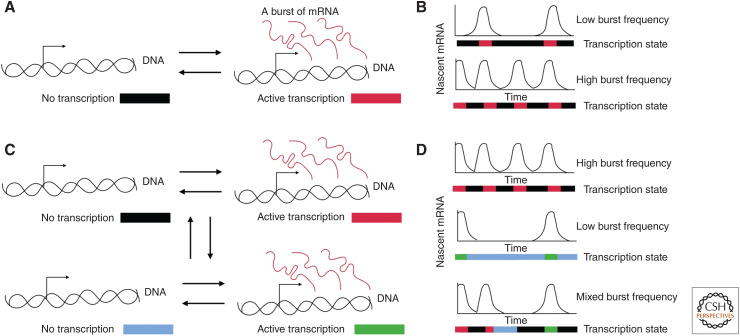
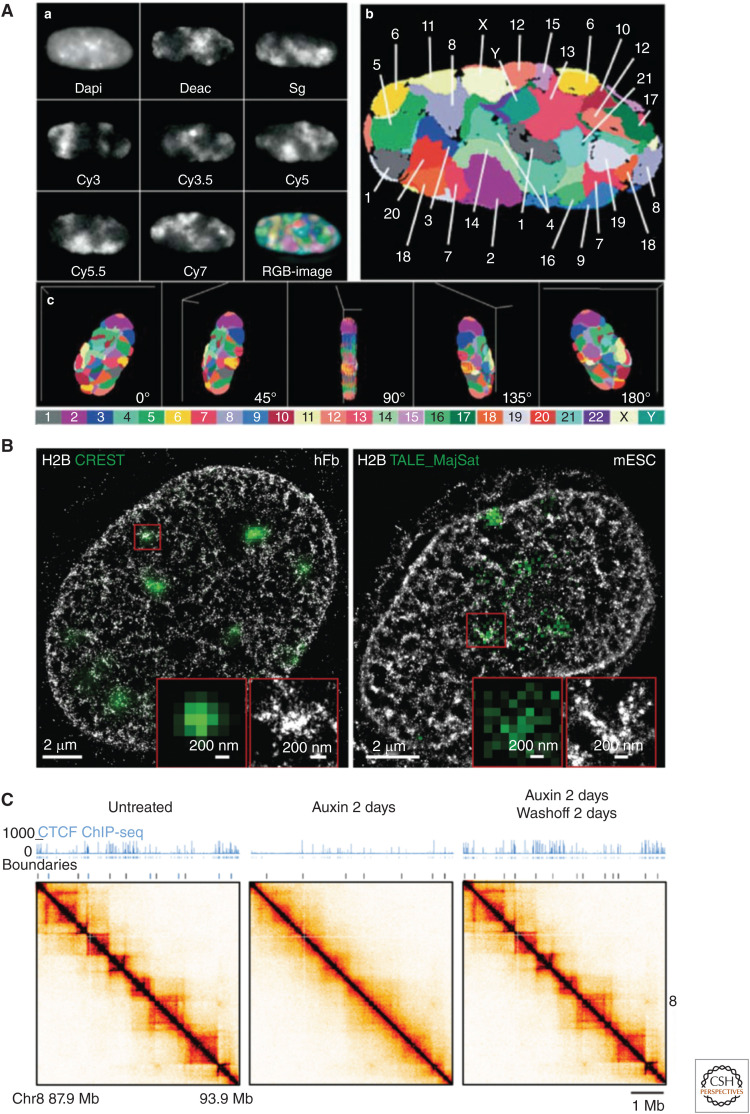
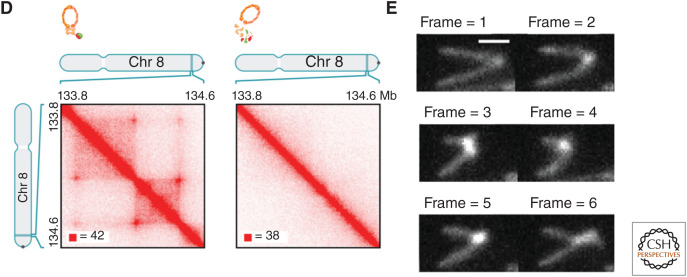
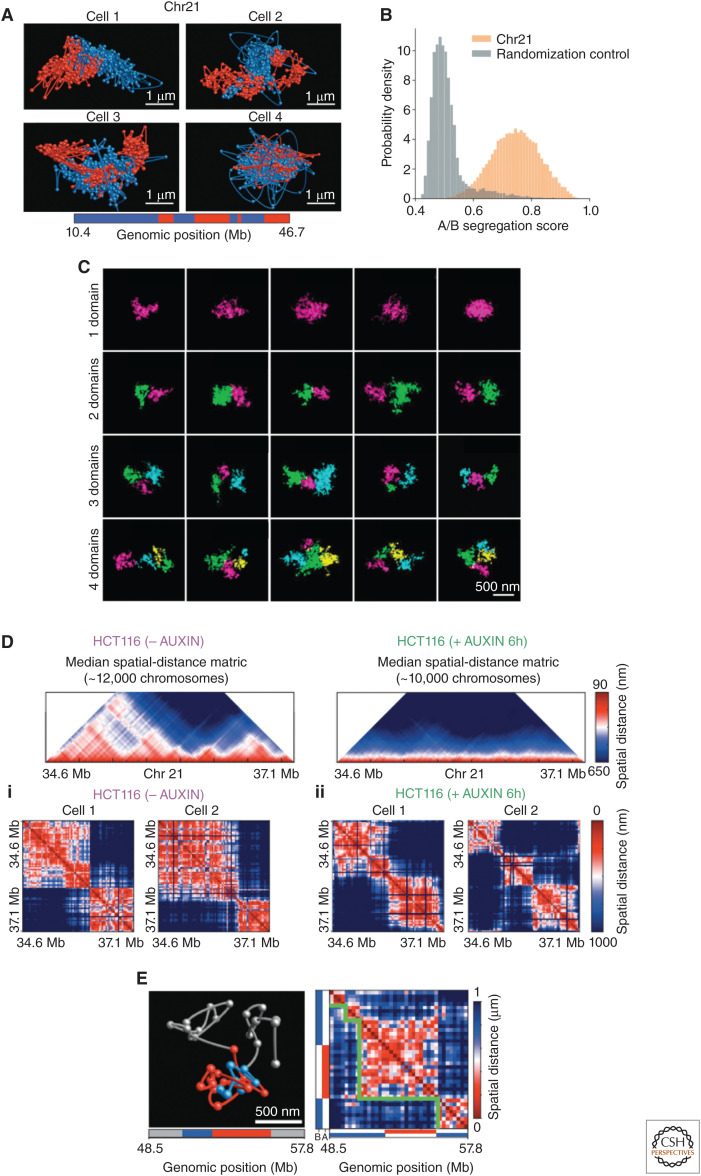
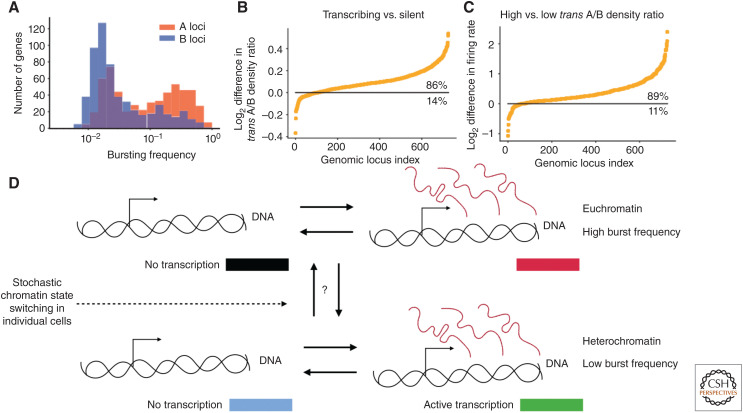
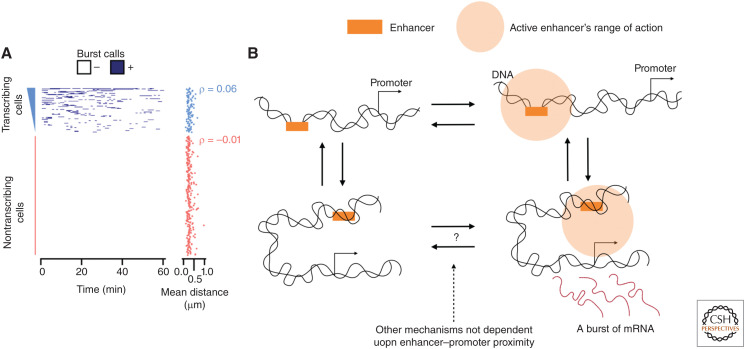
Mammalian genomes have distinct levels of spatial organization and structure that have been hypothesized to play important roles in transcription regulation. Although much has been learned about these architectural features with ensemble techniques, single-cell studies are showing a new universal trend: Genomes are stochastic and dynamic at every level of organization. Stochastic gene expression, on the other hand, has been studied for years. In this review, we probe whether there is a causative link between the two phenomena. We specifically discuss the functionality of chromatin state, topologically associating domains (TADs), and enhancer biology in light of their stochastic nature and their specific roles in stochastic gene expression. We highlight persistent fundamental questions in this area of research.


Figures

Figure 1.
Figure 1.
Transcription varies in time. (A) The two-state model for transcription in which a gene can switch between an inactive state and active state leading to bursts of RNA. (B) Illustration of a gene with a low burst frequency and a high burst frequency. The colors underneath each time trace indicate the underlying state of the gene through time. (C) A multistate model of transcription in which a gene can switch between states with different burst frequencies. The gene can occupy one of four different states illustrated with the different colors. (D) The diverse time traces produced by a multistate model of transcription dynamics. The colors underneath the time traces show the actual state of the gene.
Figure 2.
Figure 2.
Hierarchical nuclear organization. (A) Individual chromosomes occupy distinct territories. (Panel A reprinted from Bolzer et al. 2005 under the terms of a Creative Commons Attribution License.) (B) Superresolution imaging of chromatin (labeled H2B) showing a wide distribution of densities, with Crest and TALE_ MajSat (heterochromatin markers), showing that dense clusters of chromatin correspond to heterochromatin. (Panel B from Ricci et al. 2015; reprinted, with permission, from Elsevier © 2015.) (C) CTCF is needed for ensemble topologically associated domain (eTAD) formation in ensemble Hi-C maps. Here, CTCF is degraded in the presence of auxin illustrated with the ChIP-seq data. (Panel C from Nora et al. 2017; reprinted, with permission, from Elsevier © 2017.) (D) Cohesin is needed for eTAD formation in ensemble Hi-C maps. Here, auxin eliminates functional cohesion. (Panel D from Rao et al. 2017; reprinted, with permission, from Elsevier © 2017.) (E) Direct visualization of loop extrusion with cohesion. (Panel E from Davidson et al. 2019; reprinted, with permission, from the American Association for the Advancement of Science © 2019.)
Figure 2.
Figure 2.
Hierarchical nuclear organization. (A) Individual chromosomes occupy distinct territories. (Panel A reprinted from Bolzer et al. 2005 under the terms of a Creative Commons Attribution License.) (B) Superresolution imaging of chromatin (labeled H2B) showing a wide distribution of densities, with Crest and TALE_ MajSat (heterochromatin markers), showing that dense clusters of chromatin correspond to heterochromatin. (Panel B from Ricci et al. 2015; reprinted, with permission, from Elsevier © 2015.) (C) CTCF is needed for ensemble topologically associated domain (eTAD) formation in ensemble Hi-C maps. Here, CTCF is degraded in the presence of auxin illustrated with the ChIP-seq data. (Panel C from Nora et al. 2017; reprinted, with permission, from Elsevier © 2017.) (D) Cohesin is needed for eTAD formation in ensemble Hi-C maps. Here, auxin eliminates functional cohesion. (Panel D from Rao et al. 2017; reprinted, with permission, from Elsevier © 2017.) (E) Direct visualization of loop extrusion with cohesion. (Panel E from Davidson et al. 2019; reprinted, with permission, from the American Association for the Advancement of Science © 2019.)
Figure 3.
Figure 3.
Chromosome organization varies in single cells. (A) Diverse structures of whole individual chromosomes with the loci that occupy the ensemble-A and -B compartments shown in red and blue. (Panel A from Su et al. 2020; reprinted, with permission, from Elsevier © 2020.) (B) The degree of separation of chromatin for individual chromosomes in the two ensemble-A and -B states compared with a random control. (Panel B from Su et al. 2020; reprinted, with permission, from Elsevier © 2020.) (C) Direct visualization of chromatin with electron microscopy showing the large amount of stochasticity of individual topologically associating domains (TADs)—each assigned domain is color-coded. (Panel C is reprinted from Trzaskoma et al. 2020 under a Creative Commons Attribution 4.0 International License.) (D) Individual TADs still form in the absence of cohesin. The first row shows the ensemble median distances with (no auxin) and without cohesin (auxin). (Panel D from Bintu et al. 2018; reprinted, with permission, from the American Association for the Advancement of Science © 2018.) (i) TADs in individual cells with cohesion, and (ii) without cohesin. (E) TADs in individual cells can contain loci assigned to the ensemble-A and -B compartments. (Panel E from Su et al. 2020; reprinted, with permission, from Elsevier © 2020.)
Figure 4.
Figure 4.
Relationship between transcriptional bursting and compartmentalization. (A) The bimodal bursting frequency distribution of genes naturally found in the ensemble-A and -B chromatin states. (B) The difference in the trans A/B ratio (the local density of trans-ensemble-A loci to trans-ensemble-B loci in individual cells around each gene) when a gene was transcribing versus when it was not, showing there is a strong correlation between chromatin state and transcription state in individual cells. (C) Similar to B but with the difference in bursting rate on the y-axis between high and low trans A/B density, showing a strong correlation of chromatin state in individual cells and burst frequency. (Figures and data in AC from Su et al. 2020; reprinted, with permission, from Elsevier © 2020.) (D) Hypothetical model of transcription for a gene with two different burst frequencies owing to variations in chromatin state within individual cells (the same as Fig. 1A).
Figure 5.
Figure 5.
Enhancer-driven transcription. (A) The transcription state over time for individual cells and the distance between the enhancer and promoter to the right showing little correlation with transcription. (Panel A reprinted from Alexander et al. 2019 under the terms of a Creative Commons Attribution License.) (B) Model of transcription with the range of action of the enhancer taken into consideration, showing that if enhancer–promoter proximity is within the range of action of the enhancer, other mechanisms must be responsible for the stochastic nature of transcription.

References

    1. Abramo K, Valton AL, Venev SV, Ozadam H, Fox AN, Dekker J. 2019. A chromosome folding intermediate at the condensin-to-cohesin transition during telophase. Nat Cell Biol 21: 1393–1402. 10.1038/s41556-019-0406-2 - DOI - PMC - PubMed
    1. Alexander JM, Guan J, Li B, Maliskova L, Song M, Shen Y, Huang B, Lomvardas S, Weiner OD. 2019. Live-cell imaging reveals enhancer-dependent Sox2 transcription in the absence of enhancer proximity. eLife 8: e41769. 10.7554/eLife.41769 - DOI - PMC - PubMed
    1. Aranda S, Mas G, Di Croce L. 2015. Regulation of gene transcription by Polycomb proteins. Sci Adv 1: e1500737. 10.1126/sciadv.1500737 - DOI - PMC - PubMed
    1. Banerji J, Rusconi S, Schaffner W. 1981. Expression of a β-globin gene is enhanced by remote SV40 DNA sequences. Cell 27: 299–308. 10.1016/0092-8674(81)90413-X - DOI - PubMed
    1. Banerji J, Olson L, Schaffner W. 1983. A lymphocyte-specific cellular enhancer is located downstream of the joining region in immunoglobulin heavy chain genes. Cell 33: 729–740. 10.1016/0092-8674(83)90015-6 - DOI - PubMed

LinkOut - more resources