. 2021 May 4;118(18):e2014472118.
doi: 10.1073/pnas.2014472118.

Multiscale photonic imaging of the native and implanted cochlea

Affiliations

Multiscale photonic imaging of the native and implanted cochlea

Daniel Keppeler et al. Proc Natl Acad Sci U S A. .

Abstract

The cochlea of our auditory system is an intricate structure deeply embedded in the temporal bone. Compared with other sensory organs such as the eye, the cochlea has remained poorly accessible for investigation, for example, by imaging. This limitation also concerns the further development of technology for restoring hearing in the case of cochlear dysfunction, which requires quantitative information on spatial dimensions and the sensorineural status of the cochlea. Here, we employed X-ray phase-contrast tomography and light-sheet fluorescence microscopy and their combination for multiscale and multimodal imaging of cochlear morphology in species that serve as established animal models for auditory research. We provide a systematic reference for morphological parameters relevant for cochlear implant development for rodent and nonhuman primate models. We simulate the spread of light from the emitters of the optical implants within the reconstructed nonhuman primate cochlea, which indicates a spatially narrow optogenetic excitation of spiral ganglion neurons.

Keywords: X-ray phase-contrast tomography; cochlear implant; hearing restoration; light-sheet fluorescence microscopy; optogenetics.


Conflict of interest statement

Competing interest statement: T.M. and D.K. are co-founders of OptoGenTech company.

Figures
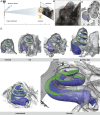
Fig. 1.
Fig. 1.
X-ray tomography-based 3D models of rodent and primate cochleae. (A) In-house experimental setup. X-rays are generated by a liquid-metal jet microfocus tube. Based on optimized geometric parameters and detection by high-resolution scintillator-based charge-coupled device (CCD) camera, phase and absorption contrast can be exploited for image formation. (B) Raw two-dimensional projection showing edge enhancement indicative of phase-sensitive image formation by propagation. The projections are then fed into the phase retrieval algorithm, followed by tomographic reconstruction. (C) Volume rendering of reconstructed image stack. Scala tympani (blue), scala vestibuli and media (green, combined as Reissners' membrane could not be reliably detected), Rosenthal’s canal (purple), osseous spiral lamina (orange), basilar membrane (black line), and modiolar axis (dashed line). (D) Segmented cochleae visualized with bone (gray), basilar membrane (green), scala tympani (blue), round window (dashed line), oval window (dotted line), and apex (arrowhead). Datasets are available under ref. . (Scale bar, 1 mm.)
Fig. 2.
Fig. 2.
Molecular imaging of the cleared mouse and marmoset cochlea by light-sheet fluorescence microscopy. (A) Light-sheet fluorescence microscope (UltraMicroscope II, LaVision Biotech) with a schematic representation of its sample chamber. The laser beam is formed into a light sheet by two cylindrical lenses and illuminates the whole sample in one level. The 2× objective is protected against the clearing medium by a dipping cap. The sample is moved through the light sheet, and a scientific Complementary metal-oxide-semiconductor (sCMOS) detector is detecting every illuminated level. (B) Cochlea clearing using the modified iDisco+ protocol (39). To enable the light sheet to penetrate the whole sample, the cochlea has to be cleared. The upper image shows a native mouse cochlea in phosphate-buffered saline (PBS) (one square = 1 mm), the lower image shows the same mouse cochlea cleared in dibenzyl ether (DBE), an organic compound with a refractive index of 1.562. (C) Schematic representation of LSFM imaging. Side view, top view, and high-angle view. (D) LSFM image of a mouse cochlea (Left) and a marmoset cochlea (Right); the bone was cropped manually for better illustration, immunostaining with anti-parvalbumin (magenta) to stain the SGNs and anti-myosin 6 (cyan) to stain IHCs and outer hair cells (OHCs), the yellow square shows a zoom (282 µm × 374 µm) in the medial turn region. (Scale bar, 300 μm.) (E) The tonotopic axis along the IHC row is shown as color-coded spline in the mouse cochlea. The frequency (in kHz) was calculated with the Greenwood function. Immunostaining with anti-parvalbumin (gray). (Scale bar, 300 μm.) (F) The tonotopic axis along the IHC row shown as color-coded spline in the marmoset cochlea. The frequency (in kHz) was calculated with the Greenwood function. Immunostaining with anti-parvalbumin (gray). (Scale bar, 300 μm.) (G) Uncropped LSFM image of a left-ear mouse cochlea (Left) and automatically segmented SGNs (cyan, Right). Immunostaining with anti-parvalbumin (magenta) with a count of 9,402 cells (see also SI Appendix, Fig. S3) and an F1 score of 97% for the detection error estimation (details in SI Appendix, Fig. S4). Datasets are available under ref. . (Scale bar, 300 μm.)
Fig. 3.
Fig. 3.
Sequential imaging of the marmoset cochlea by LSFM and X-ray tomography. (A and B) Experimental setup for multiscale phase-contrast tomography of Göttingen instrument for nano-imaging with X-rays (GINIX) endstation (P10/PETRAIII) at Deutsches Elektronen Synchrotron (DESY), combining (A) overview scans of the entire cochlea in a widened beam (KB: Kirkpatrick–Baez focusing) with field of view (FOV) of 8 × 7 mm at a voxel size of 3.05 μm, and (B) parallel beam tomography with FOV of 1.6 × 1.4 mm at a voxel size of 650 nm. (CF) Pictograms indicate coarse orientation of orthogonal slices. (C) Virtual slice through the reconstruction volume of the whole cochlea (cleared) with KB setup. (Scale bar, 250 μm.) (D) LSFM reconstruction of the same section as in C obtained by manual image registration. The cleared cochlea was stained with anti–Tubulin-β 3 (TUBB3) antibody. (Scale bar, 250 μm.) (E) Region-of-interest volume scan with parallel beam setup resolves individual SGNs. Region of interest is indicated by a blue rectangle in C. (Scale bar, 100 μm.) (F) Same region of interest as in E with segmented SGNs indicated as circles and colored by volume. (Scale bar, 100 μm.) (G) Further zoom into E demonstrating image quality of the parallel beam (PB) setup. Zoom area is indicated with a blue rectangle in E. (Scale bar, 25 μm.) (H) Volume rendering of the region-of-interest scan with segmented SGNs color coded by individual volume. Datasets are available under ref. .
Fig. 4.
Fig. 4.
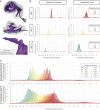
Measurements of the scala tympani relevant for cochlear implantation. (A) Example for a segmented scala tympani (here: guinea pig) with smoothed centerline beginning at the round window (gray dot) derived from X-ray tomography datasets. Centerline was used as trajectory for virtual cross-sections (exemplary cross-sections depicted in gray, every 50th sampling point in blue). Segmented models were derived from X-ray tomography datasets. For further analysis, reference SI Appendix, Fig. S6. (B) Smallest radius of scala tympani from base to apex. Data were scaled along the distance dimension to fit the mean length of scala tympani. Shaded regions indicate mean ± SD, animal count (n) as in C. (C) Measurements of parameters relevant for CI design considerations. The diameter was derived from the centerline calculation; height and width were determined in virtual sections; curvature represents the radius from the modiolar axis to the centerline of scala tympani. Please note that different species are plotted in different scales.
Fig. 5.
Fig. 5.
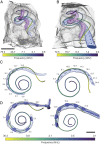
Cochlear implantation studies in rodent and marmoset cochleae. (A) Mouse cochlea with an oCI comprising 93 μLEDs covering a frequency range from 72.2 to 2.5 kHz. Implantation was performed in fresh, explanted mouse cochleae that were chemically fixed thereafter. Insertion depth: 4.6 mm. Basilar membrane is color coded for corresponding frequency, Rosenthal’s canal (purple), LED (blue), silicone (light blue), and bone (gray). View from lateral. (Scale bar, 1 mm.) (B) Rat cochlea with an oCI comprising 13 μLEDs covering a frequency range from 49.4 to 6.7 kHz. Implantation was performed in a fresh, explanted rat cochleae and chemically fixed subsequently. Insertion depth: 3.6 mm. View from lateral. Scale as in A. (C) oCI in marmoset scala tympani. Implantation was performed in fresh, postmortem marmoset skulls and chemically fixed subsequently. LED bond pads (blue), spacing between LEDs 300 μm, silicone (bright blue), and basilar membrane (color coded for corresponding frequency). View from cochlear base to apex. (Left) Best example, insertion depth: 7.6 mm. (Right) Insertion depth: 6.4 mm. Scale as in D. (D) Electrical CI in marmoset scala tympani. Implantation was performed in fresh marmoset skulls and chemically fixed subsequently. (Left) Best example, insertion depth: 8.9 mm; spacing: 1.5 mm. (Right) Insertion depth: 6 mm; spacing: 1 mm. (Scale bar, 1 mm.)
Fig. 6.
Fig. 6.
Modeling optical stimulation in the marmoset cochlea. (A) Upper and middle panel show different views of reconstructed volumes from X-ray tomography (Fig. 5C) used in the simulations, depicting a marmoset cochlea with an inserted oCI. (Scale bar, 500 μm.) Lower close-up displaying the localization of query points in the apical turn. Purple: Rosenthal’s canal and peripheral processes; light gray: scalae tympani, vestibuli, and media; blue: μLEDs of oCI, numbered 1 to 10 from apex; dark gray: flexible substrate of oCI. The centerline of Rosenthal’s canal was used for query-point placement of the spiral ganglion. (Scale bar, 100 μm.) (B) Light irradiance profiles obtained from μLED 1, 5, and 10 at query points placed in Rosenthal’s canal and the outermost edge of the peripheral processes. Orange line displays irradiance threshold values (1.81 mW/mm2 for peripheral processes; 0.87 mW/mm2 for Rosenthal’s canal). (C) Light irradiance profiles from all light sources interrogated at a radiant flux of 10 mW indicate a spread of excitation of 0.91 to 1.19 octaves at Rosenthal’s canal and 0.29 to 0.53 at peripheral processes for maximal stimulation amenable for these emitters. Dashed lines display irradiance threshold values (SI Appendix, Tables S2 and S3).

References

    1. Kral A., Hartmann R., Mortazavi D., Klinke R., Spatial resolution of cochlear implants: The electrical field and excitation of auditory afferents. Hear. Res. 121, 11–28 (1998). - PubMed
    1. Kang R., et al. ., Development and validation of the university of Washington clinical assessment of music perception test. Ear Hear. 30, 411–418 (2009). - PMC - PubMed
    1. Hernandez V. H., et al. ., Optogenetic stimulation of the auditory pathway. J. Clin. Invest. 124, 1114–1129 (2014). - PMC - PubMed
    1. Mager T., et al. ., High frequency neural spiking and auditory signaling by ultrafast red-shifted optogenetics. Nat. Commun. 9, 1750 (2018). - PMC - PubMed
    1. Wrobel C., et al. ., Optogenetic stimulation of cochlear neurons activates the auditory pathway and restores auditory-driven behavior in deaf adult gerbils. Sci. Transl. Med. 10, eaao0540 (2018). - PubMed

Publication types

MeSH terms

LinkOut - more resources