. 2021 Apr 26;12(1):2443.
doi: 10.1038/s41467-021-22573-7.

Higher gametocyte production and mosquito infectivity in chronic compared to incident Plasmodium falciparum infections

Affiliations

Higher gametocyte production and mosquito infectivity in chronic compared to incident Plasmodium falciparum infections

Aissata Barry et al. Nat Commun. .

Abstract

Plasmodium falciparum gametocyte kinetics and infectivity may differ between chronic and incident infections. In the current study, we assess parasite kinetics and infectivity to mosquitoes among children (aged 5-10 years) from Burkina Faso with (a) incident infections following parasite clearance (n = 48) and (b) chronic asymptomatic infections (n = 60). In the incident infection cohort, 92% (44/48) of children develop symptoms within 35 days, compared to 23% (14/60) in the chronic cohort. All individuals with chronic infection carried gametocytes or developed them during follow-up, whereas only 35% (17/48) in the incident cohort produce gametocytes before becoming symptomatic and receiving treatment. Parasite multiplication rate (PMR) and the relative abundance of ap2-g and gexp-5 transcripts are positively associated with gametocyte production. Antibody responses are higher and PMR lower in chronic infections. The presence of symptoms and sexual stage immune responses are associated with reductions in gametocyte infectivity to mosquitoes. We observe that most incident infections require treatment before the density of mature gametocytes is sufficient to infect mosquitoes. In contrast, chronic, asymptomatic infections represent a significant source of mosquito infections. Our observations support the notion that malaria transmission reduction may be expedited by enhanced case management, involving both symptom-screening and infection detection.


Conflict of interest statement

The authors declare no competing interests.

Figures

Fig. 1
Fig. 1. Illustrative sampling schemes for individuals in the incident and chronic cohorts.
Tick marks represent days and weeks, and sampling/screening time points are shown as circles. Positive (+) and negative (–) symbols inside circles indicate parasite status, as determined by the indicated assays. A In the incident infection cohort individuals were screened to confirm parasite negativity by microscopy, presumptively treated for sub-patent infection (light pink circle), and screened 3 weeks later with qualitative nested polymerase chain reaction-based on detection of Plasmodium specific 18s ribosomal DNA (nPCR) (black circle) to confirm the absence of sub-patent infection. They were then screened weekly with nPCR (white circles) until the onset of an infection. Intensive follow-up (grey circles) proceeded every day for 1 week, and weekly until day 35 after parasite detection. Study participants were closely monitored for the development of malaria symptoms. Participants were treated with artemether-lumefantrine upon the detection of symptoms or 35 days after initial detection of infection: whichever came first. B Individuals in the chronic infection cohort were screened monthly with nPCR to confirm chronic infection (blue circles), defined as two sequential visits with confirmed parasitaemia without any symptoms of malaria disease. Intensive follow-up proceeding from confirmation of chronic infection (grey circles) was as for incident infections. Participants were treated with artemether-lumefantrine upon the detection of symptoms or at day 35 of follow-up: whichever came first. Mosquito feeding (indicated with mosquito symbols) was conducted in both cohorts at the onset of intensive sampling (day 0) and at day 14 and 35 in the absence of symptoms. Mosquito feeding assays were additionally conducted on the day of symptom detection.
Fig. 2
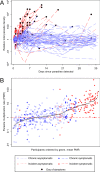
Fig. 2. Infection trajectory and total parasite multiplication rate.
A Total parasite densities are presented as values relative to the time point of their first detection. Light blue lines = chronic asymptomatic infection, dark blue lines = chronic symptomatic infection, light red lines = incident asymptomatic infection, dark red lines = incident symptomatic infection, black markers = time of symptom onset. Three individuals became symptomatic at time points without concurrent parasite density measures. For these individuals, no black marker was drawn for ‘Day of symptoms’. Full details of individual parasite and symptom trajectories are in Supplementary Figs. 1 and 2. B Total parasite multiplication rates (PMR) were calculated as the change in density between observations over 48-h intervals in the first 7 days of intensive follow-up. Marker colours are as for the lines in (A), with hollow circles for asymptomatic infection, solid circles for symptomatic infection, and grey crosses indicating the median PMR for each individual. The red dashed line at PMR = 1 indicates PMR equality between measures; values above show PMR values which increased over time, values below the PMR values which decreased over time. Participants are ordered by the geometric mean of their PMR observations. 431 measurements of PMR from 92 participants were available (median per person = 6 [IQR 3,6]). Incident asymptomatic: 13 observations (3 individuals), median observations = 6, IQR (1,6); Incident symptomatic: 98 observations (31 individuals), median observations = 3, IQR (2,4); Chronic asymptomatic: 247 observations (44 individuals), median observations = 6, IQR (6,6); chronic symptomatic: 73 observations (14 individuals), median observations = 6, IQR (5,6). Geom. mean = geometric mean.
Fig. 3
Fig. 3. Gametocytes and gametocytogenesis.
A Gametocyte density measures from all gametocyte positive individuals (positive at any time point during follow-up). Light blue hollow markers = chronic asymptomatic infection, dark blue solid markers = chronic symptomatic infection, light red hollow markers = incident asymptomatic infection, dark red solid markers = incident symptomatic infection, grey crosses indicate the median gametocyte density for each individual. There were 928 measurements of gametocyte density; the median number of observations per person was 10 (IQR 5–12). For incident infections the median was 5 observations per person (IQR 3–8.5); for chronic infections the median was 12 (IQR 11–12). Individuals are ranked by median gametocyte density. B The association of gametocyte density at day 14 and total parasite density at enrolment (day 0). Time points are given as the number of days after enrolment into the incident or chronic infection cohorts. Line colours are as for the markers in (A), with black markers showing the onset of symptoms. Three individuals became symptomatic at time points without concurrent parasite density measures. For these individuals, no black marker was drawn for ‘Day of symptoms’. Full details of individual parasite and symptom trajectories are in Supplementary Figs. 1 and 2. C Total parasite density at enrolment (d0) was positively associated with gametocyte densities at day 14 (Spearman rho 0.48, p = 0.0001). Colours are as in (A).
Fig. 4
Fig. 4. Mosquito infectivity and gametocyte density.
A Total gametocyte density in the different cohort participants in relation to the percentage of mosquitoes that became infected. Light blue hollow markers = chronic asymptomatic infection, dark blue solid markers = chronic symptomatic infection, light red hollow markers = incident asymptomatic infection, dark red solid markers = incident symptomatic infection. The black line indicates the shape of the model for the association of gametocyte density and percentage of mosquitoes infected in mosquito feeding assays for individuals with chronic infections. This model is described in detail elsewhere. Grey shading represents the 95% confidence interval for the model. This figure is based on 134 observations from chronic asymptomatic infections, 26 observations from chronic symptomatic infections, 3 observations from incident asymptomatic infections, and 49 observations from incident symptomatic infections. B The percentage of mosquitoes infected over time, shown as days since the start of intensive follow-up. Colours (markers and lines) are as in (A). The size of the data points is proportional to the log gametocyte density in blood samples taken concurrent with the mosquito feeding assay. Connecting lines indicate observations from the same cohort participant.
Fig. 5
Fig. 5. Sexual commitment and gametocyte production.
A Gametocyte production (y-axis) is given as the ratio of gametocytes/µL on day 14 to ring-stage parasites/µL (from sbp1 qRT-PCR) on day 0. Sexual commitment (x-axis) was measured as the ratio of ap2-g mRNA copies to the density of ring-stage parasites/µL at day 0. Light blue hollow markers = chronic asymptomatic infection, dark blue solid markers = chronic symptomatic infection, light red hollow markers = incident asymptomatic infection, dark red solid markers = incident symptomatic infection. B Gametocyte production and relative abundance of gexp-5 transcripts (ratio of gexp-5 copy number to the density of ring-stage parasites/µL at day 0). Colours are as in (A). C Relative ap2-g abundance for the different cohorts; observations from incident symptomatic and incident asymptomatic infections were combined. This figure is thus based on 34 observations from combined incident infections, 41 observations from chronic asymptomatic infections, and 10 observations from chronic symptomatic infections. Box plot boxes span the median, 25th and 75th percentiles; box plot whiskers span the adjacent values with outliers shown as dots. D Relative gexp-5 abundance and cohort; observations incident symptomatic and incident asymptomatic infections were combined. This figure is thus based on 22 observations from combined incident infections, 41 observations from chronic asymptomatic infections, and 10 observations from chronic symptomatic infections. Box plot boxes span the median, 25th and 75th percentiles; box plot whiskers span the adjacent values with outliers shown as dots.
Fig. 6
Fig. 6. Magnitude of asexual and sexual stage antibody response and parasite multiplication rate.
Magnitude of antibody response to specific P. falciparum antigens is given as the background-adjusted median fluorescence intensity (MFI). Parasite multiplication rate (PMR) is presented as the geometric mean of each individuals PMR observations, with a dashed line at PMR = 1 (no change in parasite density over 48 h intervals). Plasma samples were taken from the start of intensive follow-up for both cohorts (incident n = 48, chronic n = 51). Light blue hollow markers = chronic asymptomatic infection, dark blue solid markers = chronic symptomatic infection, light red hollow markers = incident asymptomatic infection, dark red solid markers = incident symptomatic infection. Full details of all antigens are in Supplementary Table 1.

Similar articles

Cited by

References

    1. Okell LC, Ghani AC, Lyons E, Drakeley CJ. Submicroscopic infection in Plasmodium falciparum-endemic populations: a systematic review and meta-analysis. J. Infect. Dis. 2009;200:1509–1517. doi: 10.1086/644781. - DOI - PubMed
    1. Ouédraogo AL, et al. Substantial contribution of submicroscopical Plasmodium falciparum gametocyte carriage to the infectious reservoir in an area of seasonal transmission. PLoS ONE. 2009;4:e8410. doi: 10.1371/journal.pone.0008410. - DOI - PMC - PubMed
    1. Muirhead-Thomson RC. Factors determining the true reservoir of infection of Plasmodium falciparum and Wuchereria bacnrofti in a West African village. Trans. Roy. Soc. Trop. Med. Hyg. 1954;48:208–225. doi: 10.1016/0035-9203(54)90067-X. - DOI - PubMed
    1. Stone W, Goncalves BP, Bousema T, Drakeley C. Assessing the infectious reservoir of falciparum malaria: past and future. Trends Parasitol. 2015;31:287–296. doi: 10.1016/j.pt.2015.04.004. - DOI - PubMed
    1. World Health Organisation. Measures of Efficacy of Anti-malaria Interventions Against Malaria Transmission (WHO, Geneva, 2010).

Publication types

MeSH terms