. 2021 Apr 26;11(1):8922.
doi: 10.1038/s41598-021-88536-6.

SARS-CoV-2 does not have a strong effect on the nasopharyngeal microbial composition

Affiliations

SARS-CoV-2 does not have a strong effect on the nasopharyngeal microbial composition

Tzipi Braun et al. Sci Rep. .

Abstract

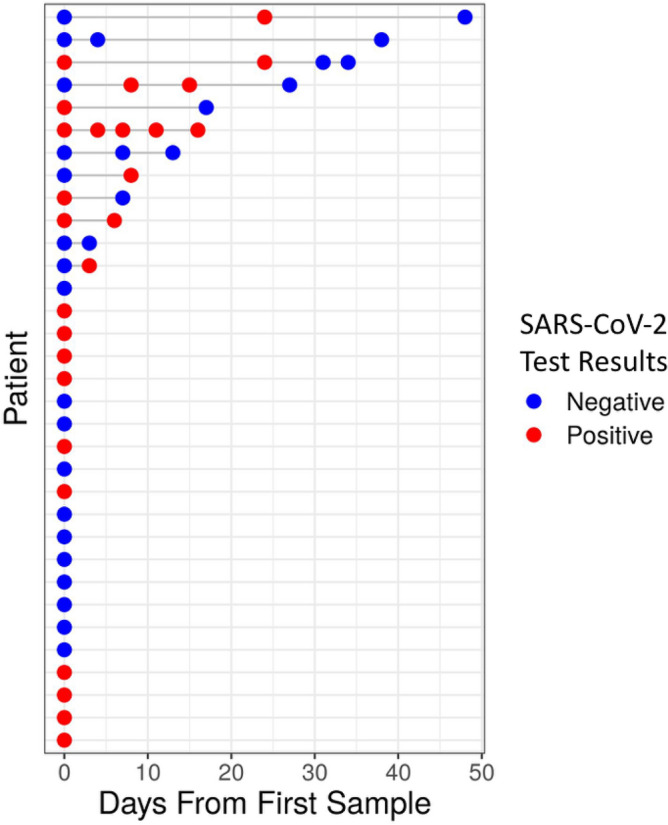
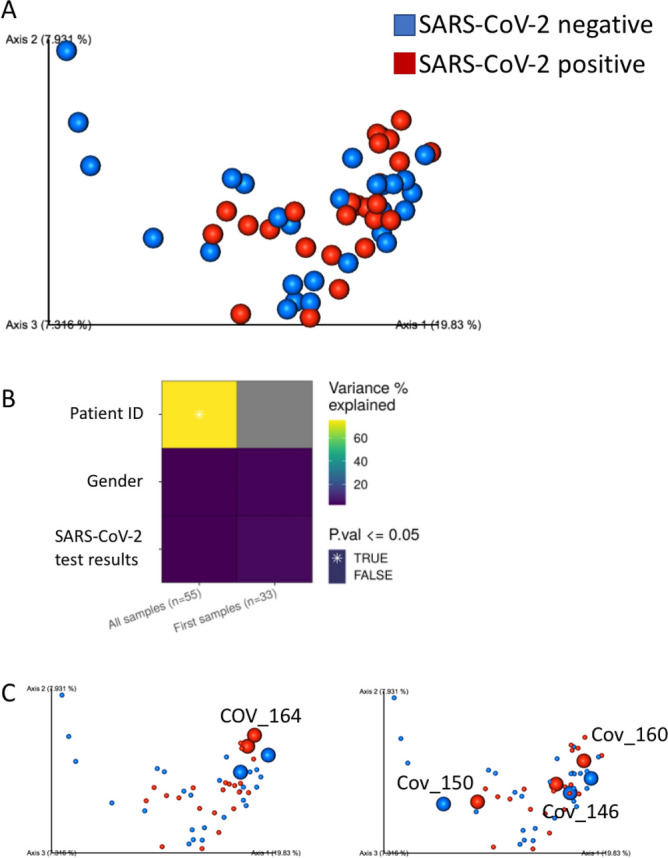
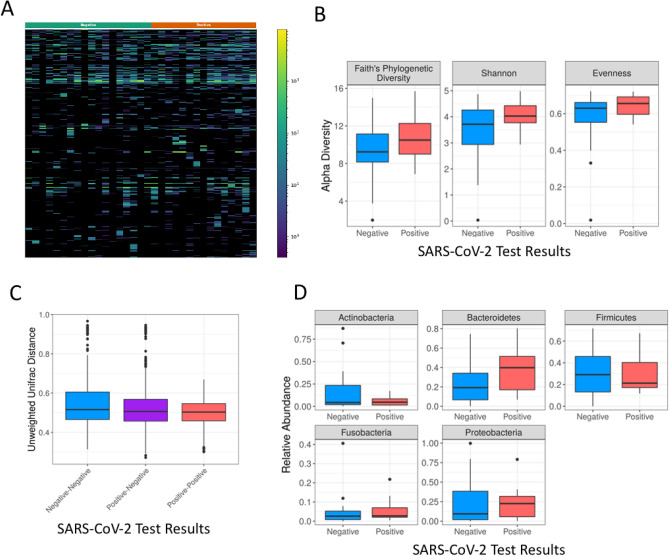
The coronavirus disease 2019 (COVID-19) has rapidly spread around the world, impacting the lives of many individuals. Growing evidence suggests that the nasopharyngeal and respiratory tract microbiome are influenced by various health and disease conditions, including the presence and the severity of different viral disease. To evaluate the potential interactions between Severe Acute Respiratory Syndrome Corona 2 (SARS-CoV-2) and the nasopharyngeal microbiome. Microbial composition of nasopharyngeal swab samples submitted to the clinical microbiology lab for suspected SARS-CoV-2 infections was assessed using 16S amplicon sequencing. The study included a total of 55 nasopharyngeal samples from 33 subjects, with longitudinal sampling available for 12 out of the 33 subjects. 21 of the 33 subjects had at least one positive COVID-19 PCR results as determined by the clinical microbiology lab. Inter-personal variation was the strongest factor explaining > 75% of the microbial variation, irrespective of the SARS-CoV-2 status. No significant effect of SARS-CoV-2 on the nasopharyngeal microbial community was observed using multiple analysis methods. These results indicate that unlike some other viruses, for which an effect on the microbial composition was noted, SARS-CoV-2 does not have a strong effect on the nasopharynx microbial habitants.


Conflict of interest statement

The authors declare no competing interests.

Figures

Figure 1
Figure 1
Longitudinal cohort of 55 samples from 33 subjects confirmed or suspected as being SARS-CoV-2 positive. Each row corresponds to an enrolled subject, over the number of days since first sample included in this study. Colors represent SARS-CoV-2 test results for a specific sample, with red and blue indicating SARS-Cov-2 positive and negative samples respectively.
Figure 2
Figure 2
Personal variation has the strongest effect on nasopharyngeal microbial composition. (A) Unweighted UniFrac PCoA plot of all samples, colored by SARS-CoV-2 test results. (B) PERMANOVA analysis of microbial variance explained by subject (patient ID), gender and SARS-CoV-2 test result, using all longitudinal samples, as well as the first samples from each subject. * indicates statistical significance with p ≤ 0.05., and n is shown in brackets. (C) Unweighted UniFrac PCoA plot of all samples, colored by SARS-CoV-2 test results. SARS-CoV-2 positive and negative samples from specific subjects with longitude sampling are marked with increased size and labeled with the subject ID, showing clustering is driven by subject ID rather than SARS-CoV-2 test results.
Figure 3
Figure 3
SARS-CoV-2 test result does not seem to have a strong effect on the nasopharyngeal microbial composition. (A) Heatmap showing all observed ASVs using the first sample from each subject. Each row represents a different ASV and each column a different sample. SARS-CoV-2 test results are noted in the color bar above (green for negative and orange for positive). (B) Boxplots of alpha diversity values, using the first sample from each subject, by SARS-CoV-2 test result. Three different alpha diversity measures were used—Faith’s phylogenetic diversity, Shannon, and evenness, as indicated. There were no significant differences in any of the measures tested (p value > 0.1). (C) Boxplot of unweighted unifrac distances between positive-positive, negative-negative and positive–negative sample pairs, using only the first sample per subject. No significant difference was detected, (PERMANOVA p value of 0.21). (D) Boxplots of the relative abundance of the five most abundant phyla by SARS-CoV-2 test result, using only the first sample per subject (Wilcoxon rank sum test p value > 0.05).

References

    1. Wiersinga WJ, Rhodes A, Cheng AC, Peacock SJ, Prescott HC. Pathophysiology, transmission, diagnosis, and treatment of coronavirus disease 2019 (COVID-19): a review. JAMA. 2020;324(8):782–793. doi: 10.1001/jama.2020.12839. - DOI - PubMed
    1. Wang J, Du G. COVID-19 may transmit through aerosol. Irish J. Med. Sci. 2020;189:1143–1144. doi: 10.1007/s11845-020-02218-2. - DOI - PMC - PubMed
    1. Karia R, Gupta I, Khandait H, Yadav A, Yadav A. COVID-19 and its modes of transmission. SN Compr. Clin. Med. 2020 doi: 10.1007/s42399-020-00498-4. - DOI - PMC - PubMed
    1. De Maio, F., Posteraro, B., Ponziani, F. R., Cattani, P., Gasbarrini, A. & Sanguinetti, M. Nasopharyngeal microbiota profiling of SARS-CoV-2 infected patients (2020). - PMC - PubMed
    1. Fan J, Li X, Gao Y, et al. The lung tissue microbiota features of 20 deceased patients with COVID-19. J. Infect. 2020;81(3):e64–e67. doi: 10.1016/j.jinf.2020.06.047. - DOI - PMC - PubMed

Publication types

Substances