. 2021 May;3(5):636-650.
doi: 10.1038/s42255-021-00385-9. Epub 2021 Apr 26.

Cellular pyrimidine imbalance triggers mitochondrial DNA-dependent innate immunity

Affiliations

Cellular pyrimidine imbalance triggers mitochondrial DNA-dependent innate immunity

Hans-Georg Sprenger et al. Nat Metab. 2021 May.

Abstract

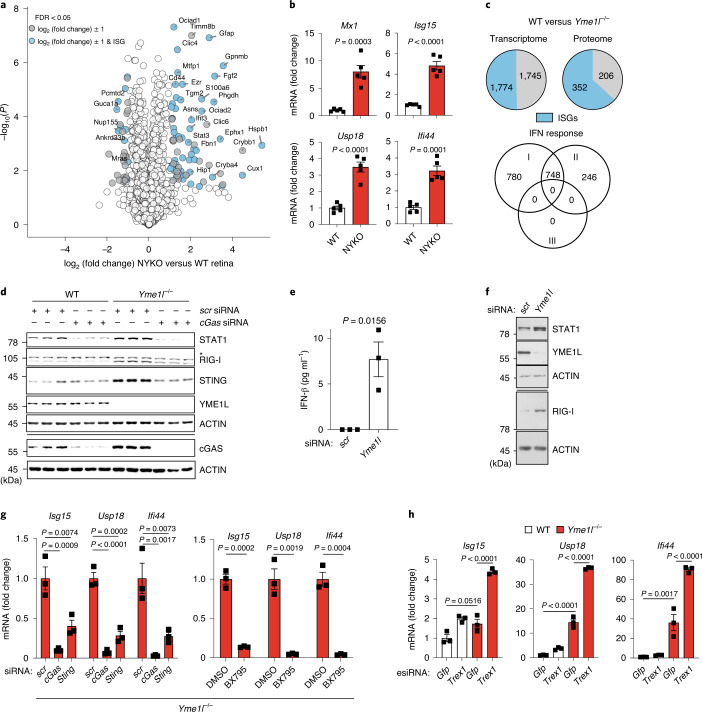
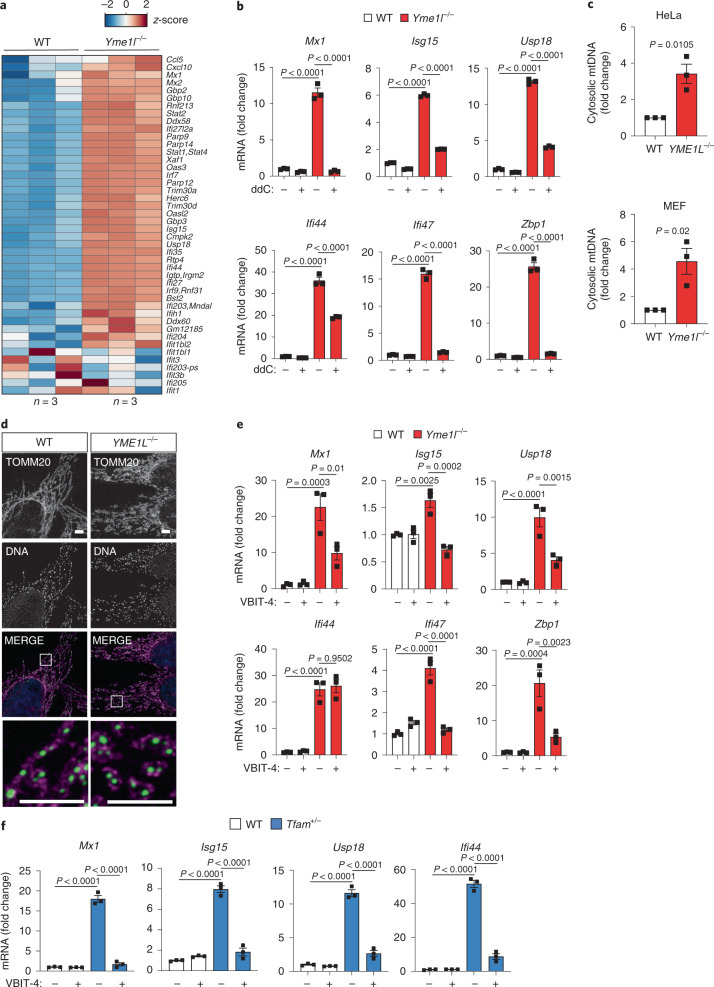
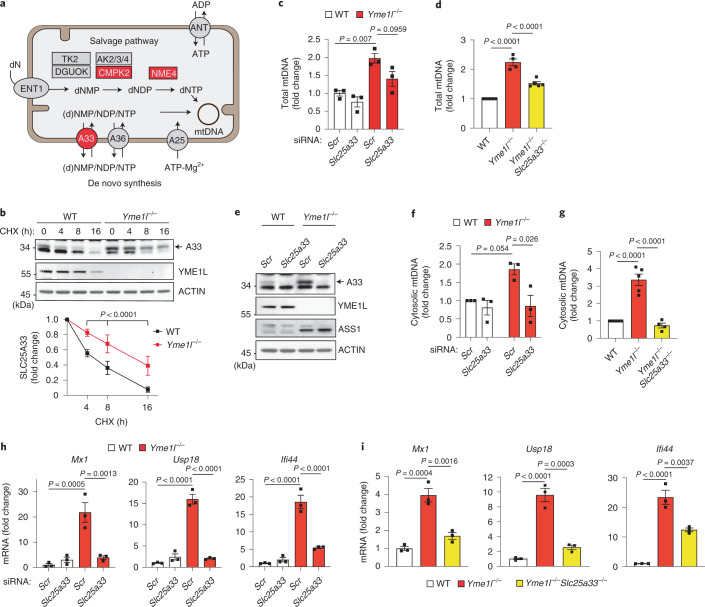
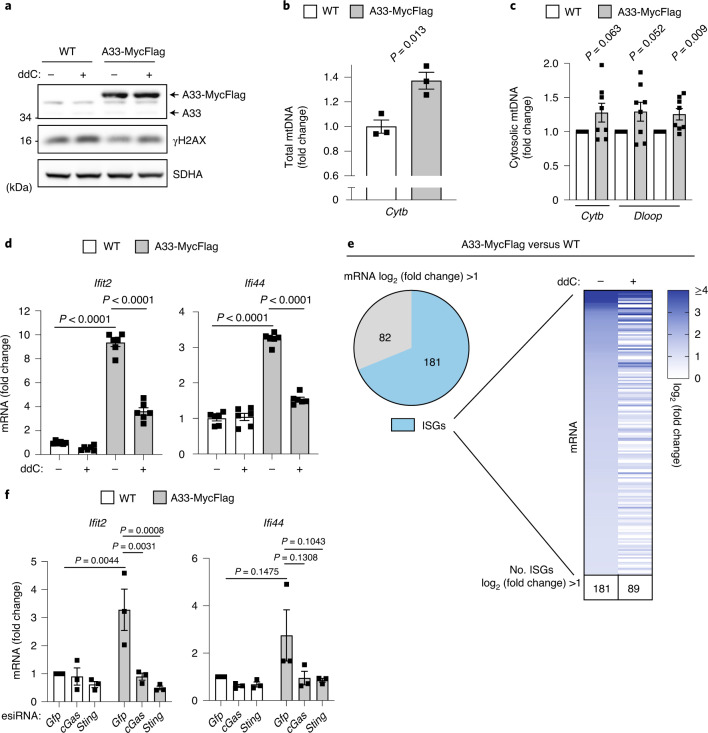
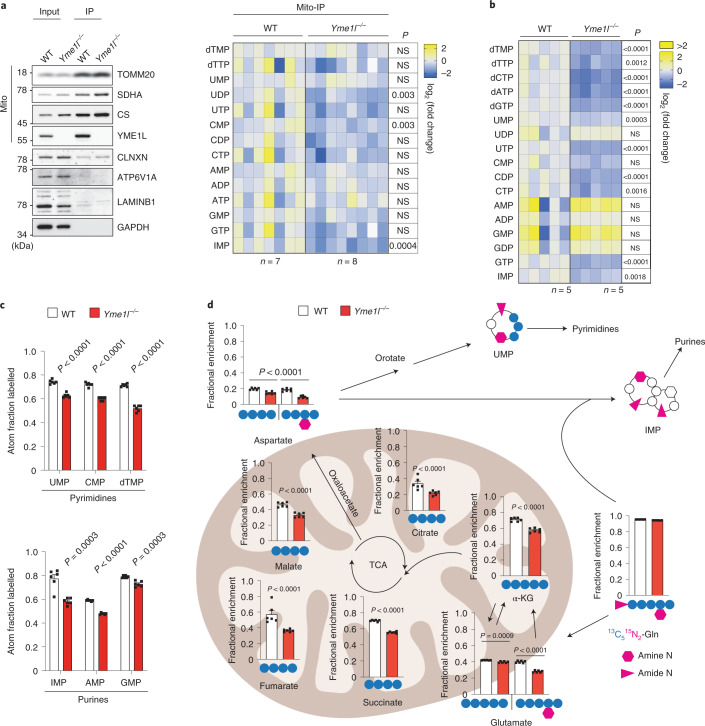
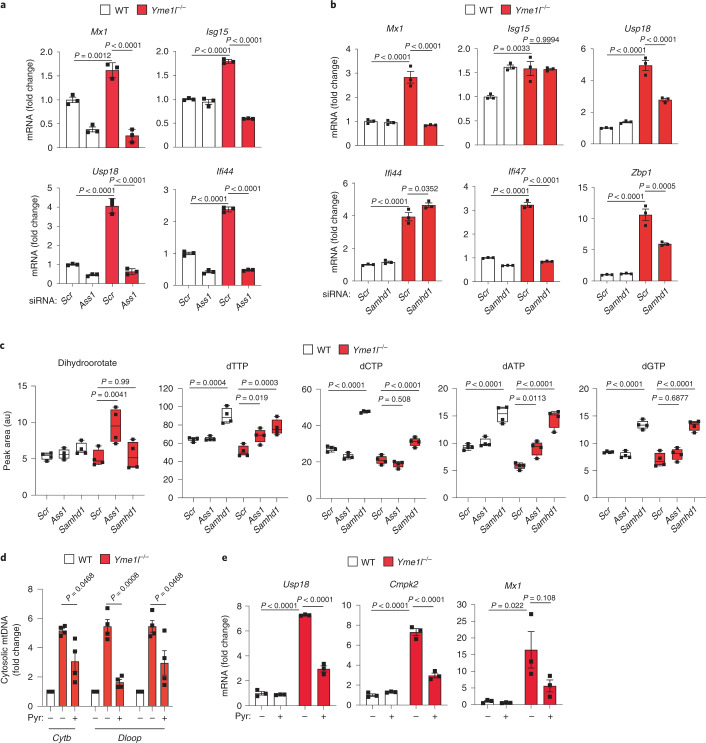
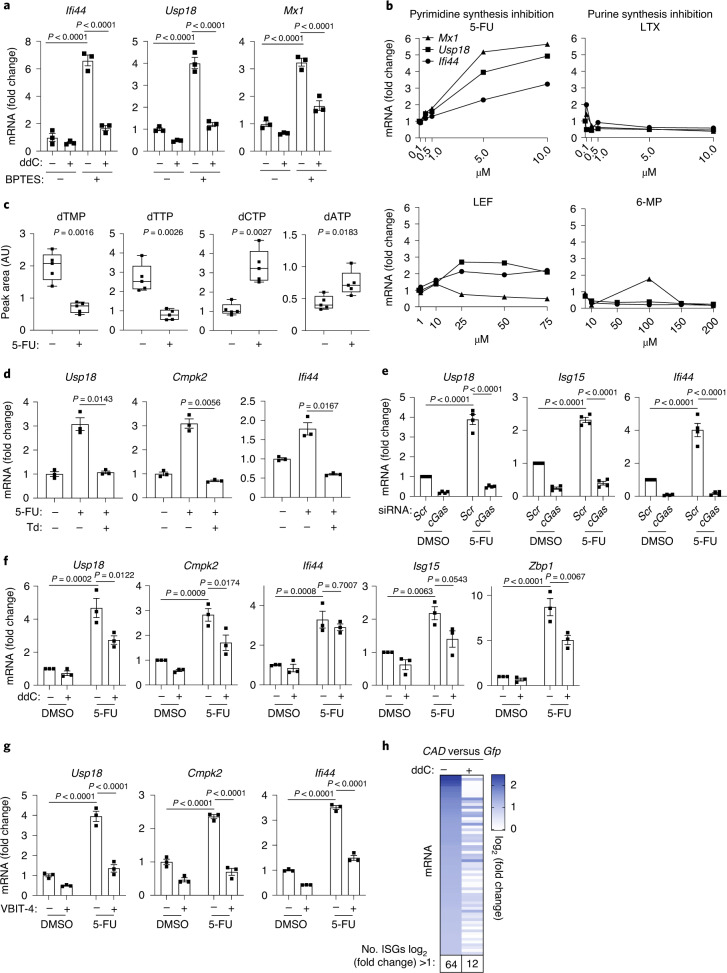
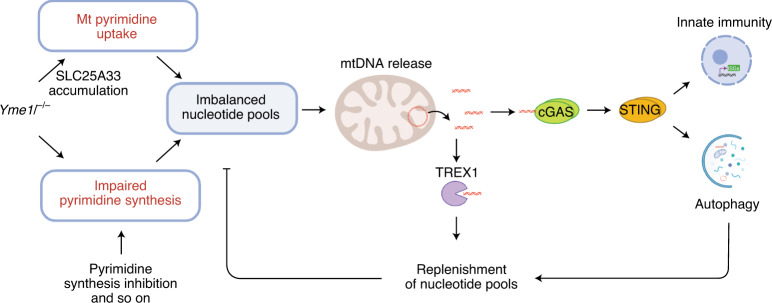
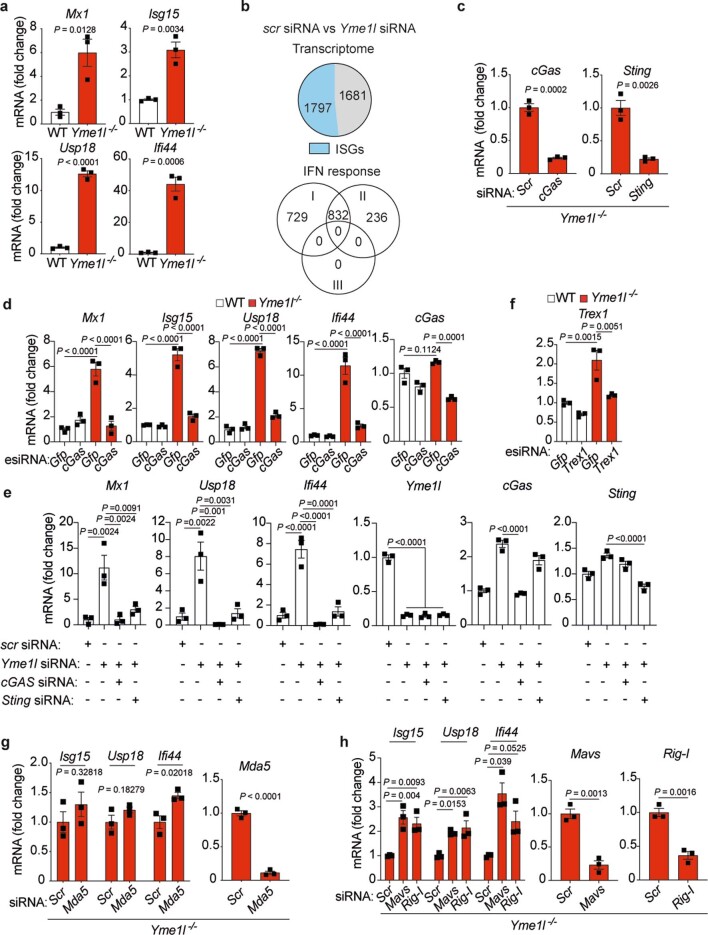
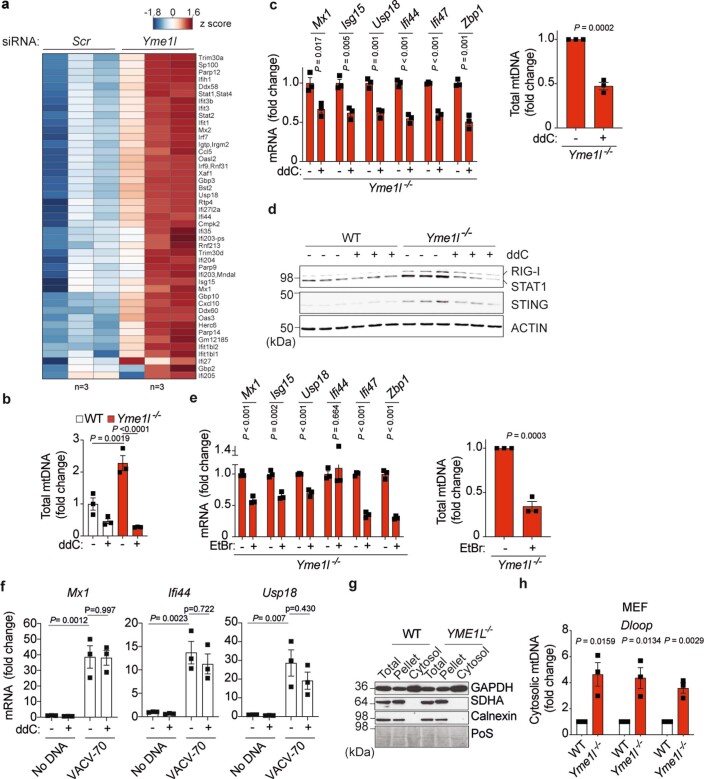
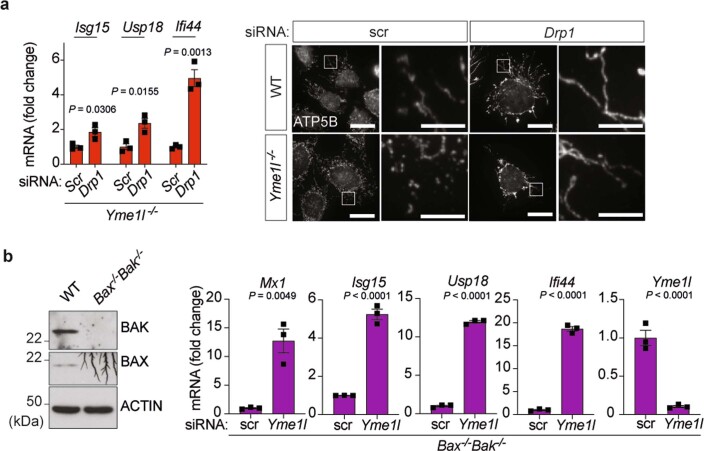
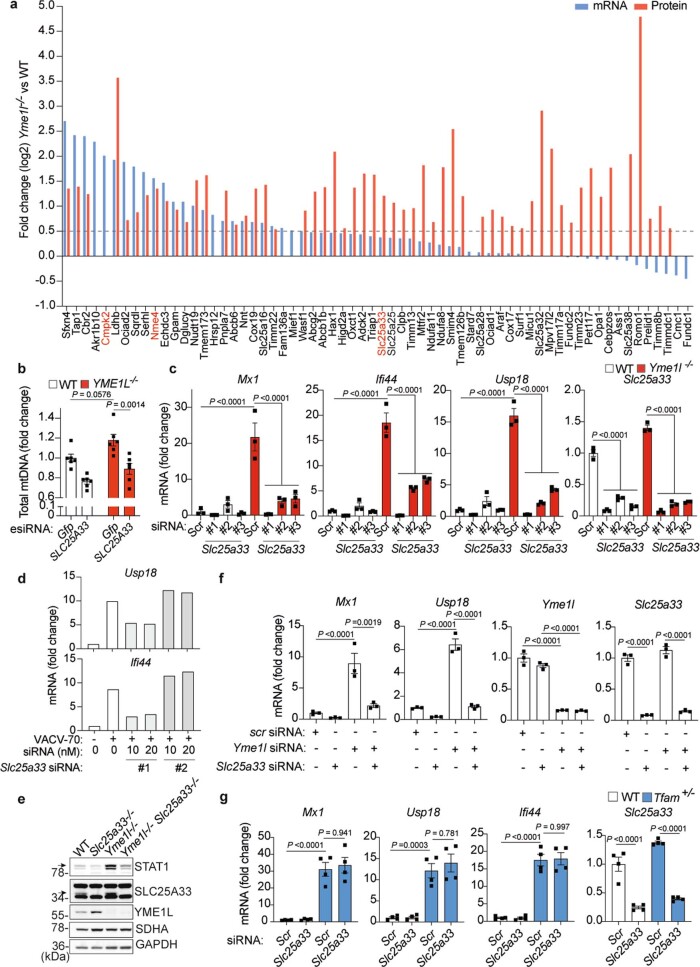
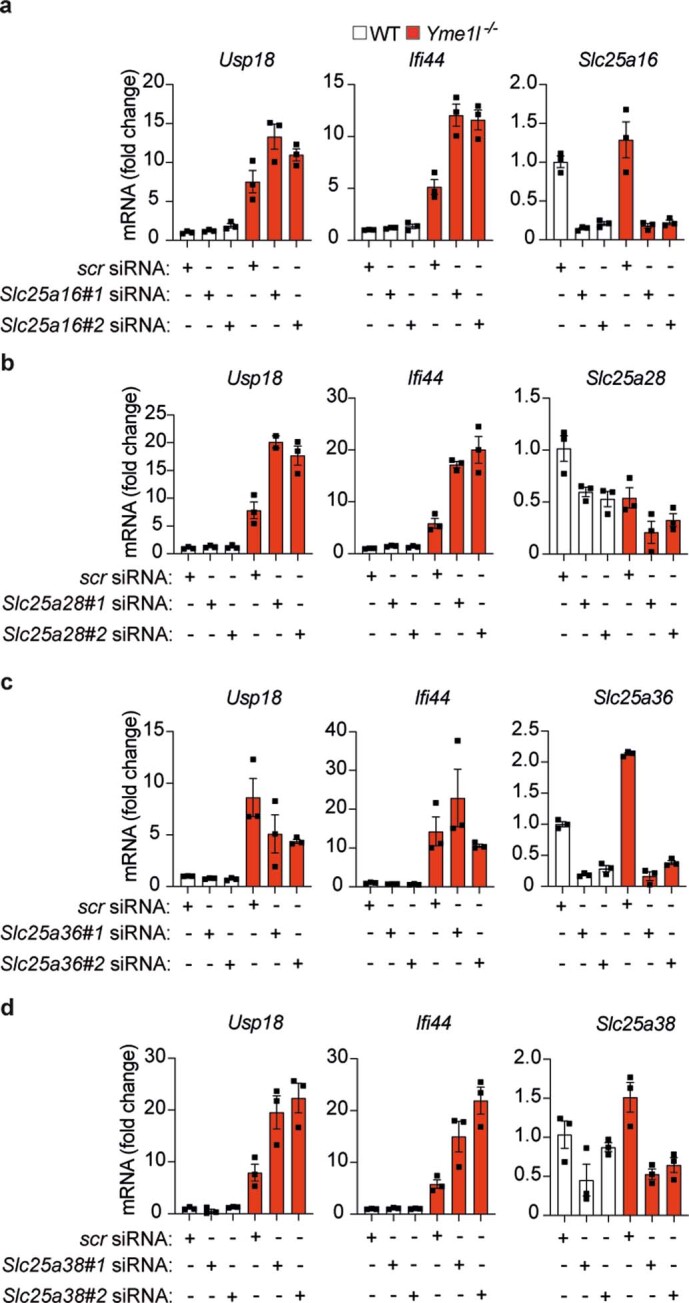
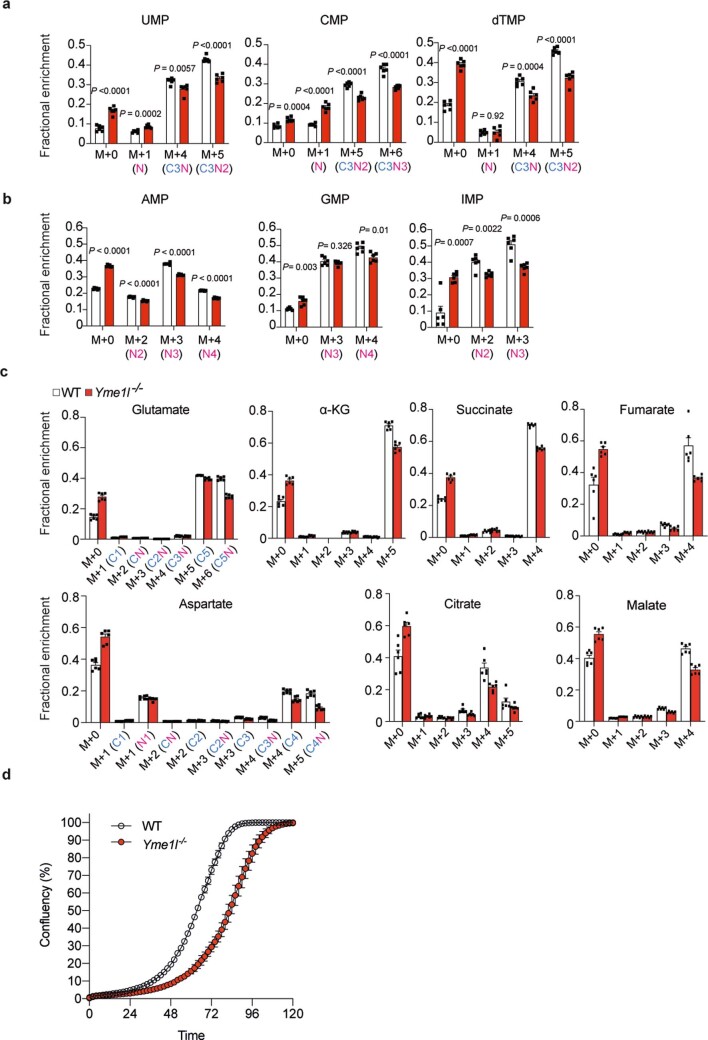
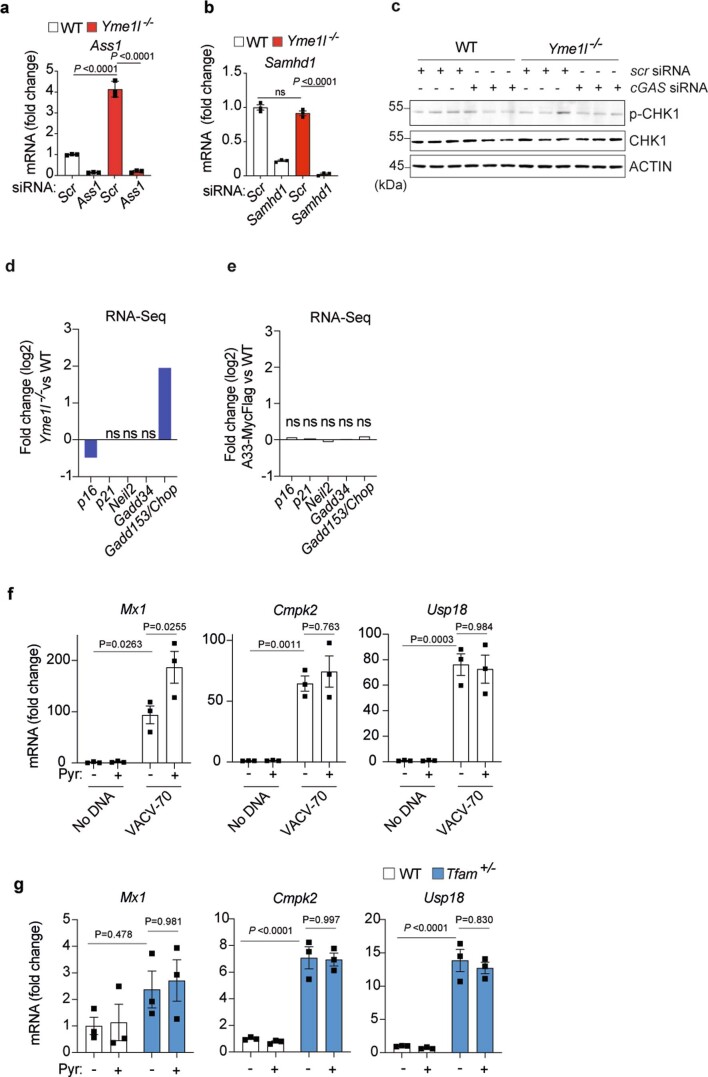
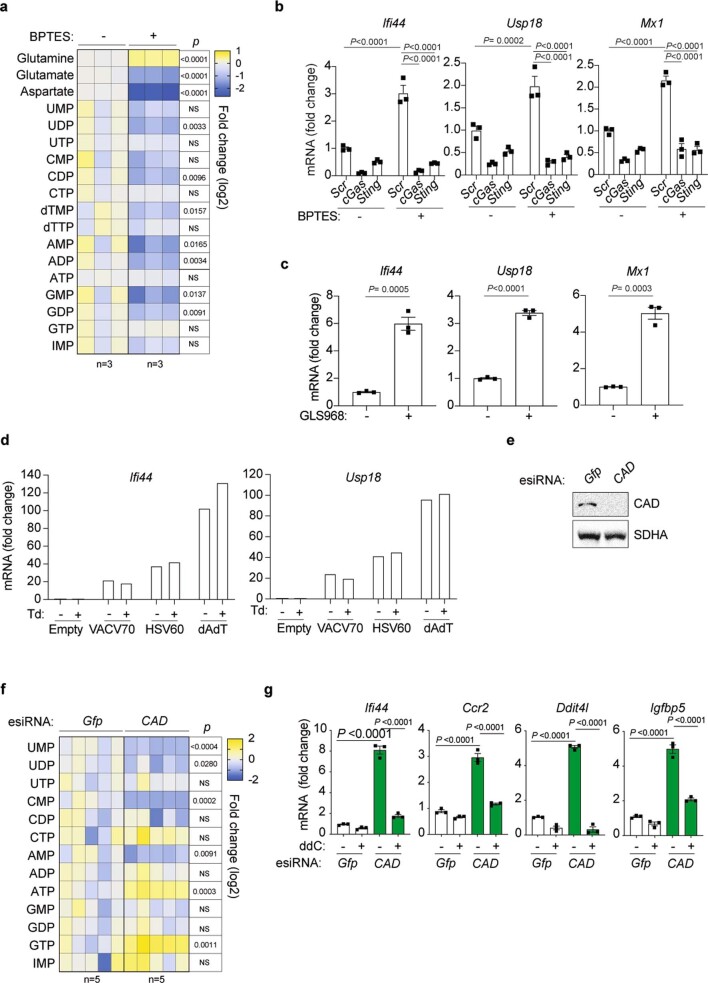
Cytosolic mitochondrial DNA (mtDNA) elicits a type I interferon response, but signals triggering the release of mtDNA from mitochondria remain enigmatic. Here, we show that mtDNA-dependent immune signalling via the cyclic GMP-AMP synthase‒stimulator of interferon genes‒TANK-binding kinase 1 (cGAS-STING-TBK1) pathway is under metabolic control and is induced by cellular pyrimidine deficiency. The mitochondrial protease YME1L preserves pyrimidine pools by supporting de novo nucleotide synthesis and by proteolysis of the pyrimidine nucleotide carrier SLC25A33. Deficiency of YME1L causes inflammation in mouse retinas and in cultured cells. It drives the release of mtDNA and a cGAS-STING-TBK1-dependent inflammatory response, which requires SLC25A33 and is suppressed upon replenishment of cellular pyrimidine pools. Overexpression of SLC25A33 is sufficient to induce immune signalling by mtDNA. Similarly, depletion of cytosolic nucleotides upon inhibition of de novo pyrimidine synthesis triggers mtDNA-dependent immune responses in wild-type cells. Our results thus identify mtDNA release and innate immune signalling as a metabolic response to cellular pyrimidine deficiencies.


Conflict of interest statement

The authors declare no competing interests.

Figures

Fig. 1
Fig. 1. Loss of YME1L elicits an innate immune response along the cGAS–STING–TBK1 pathway.
a, Quantitative proteomics of retinas from 31–32-week-old WT and NYKO mice (n = 5). ISGs with a NYKO versus WT log2 (fold change) of at least ±1 are shown in blue. Other proteins with a log2 ratio of at least ±1 are shown in grey. b, ISG expression in 6–7-week-old WT and NYKO retinas monitored by RT–qPCR (n = 5). c, Pie charts show ISGs (blue) (1774 in RNA-Seq; 352 in proteomics) among all significantly upregulated transcripts (3519) and proteins (558) in Yme1l−/− versus WT MEFs (n = 3 independent cultures). Classification of the ISG transcripts into type I, II or III IFN responses according to the Interferome database. d, Immunoblot of MEFs treated with indicated siRNAs (n = 3 independent cultures). e, IFN-β enzyme-linked immunosorbent assay of cell culture supernatants from MEFs treated with the indicated siRNA (n = 3 independent cultures). f, Immunoblot of MEFs treated with the indicated siRNA (n = 3 independent cultures). g, ISG expression in MEFs treated with the indicated siRNAs or 0.1 µM of the TBK1 inhibitor BX795 for 72 h (n = 3 independent cultures). h, ISG expression in MEFs treated with the indicated esiRNAs for 72 h (n = 3 independent cultures). Knockdown controls are shown in Extended Data Fig. 1c,f. P values calculated using two-tailed unpaired t-test (b,e, right panel in g), one-way analysis of variance (ANOVA) with Dunnett’s multiple comparison test (left-hand panel in g) or two-way ANOVA with Tukey’s multiple comparison test (h). FDR, false discovery rate. Data are means ± s.e.m. Source data
Fig. 2
Fig. 2. mtDNA is released into the cytosol in YME1L-deficient cells.
a, Expression of ISGs, which were previously described as being induced by mtDNA stress upon depletion of TFAM (including in addition Mx1),, in WT versus Yme1l−/− MEFs (RNA-Seq; z-score normalized log2(FPKM) values, n = 3 independent cultures). b, ISG expression in MEFs treated with water or ddC (20 µM) for 9 days (n = 3 independent cultures). c, mtDNA levels in cytosolic fractions from HeLa cells and MEFs assessed by qPCR amplification of mitochondrial CYTB (n = 3 independent cultures). d, Immunocytochemistry of HeLa cells using antibodies against TOMM20 (mitochondria) and DNA, scale bar, 5 µm (n = 3 independent cultures). e, ISG expression in WT and Yme1l−/− MEFs treated with 10 µM of the VDAC1 oligomerization inhibitor VBIT-4 for 48 h (n = 3 independent cultures). f, ISG expression in WT and Tfam−/− MEFs treated with 10 µM VBIT-4 for 48 h (n = 3 independent cultures). P values calculated using two-way ANOVA with Tukey’s multiple comparison test (b,e,f) or two-tailed unpaired t-test (c). Data are means ± s.e.m.
Fig. 3
Fig. 3. Proteolysis of SLC25A33 by YME1L controls mtDNA-dependent innate immunity.
a, Nucleotide synthesis via mitochondrial salvage or cytosolic de novo pathway. Components that affect the metabolism of mtDNA and that accumulate in Yme1l/ cells are highlighted in red. b, Cycloheximide (CHX) treatment of MEFs for the indicated time. Quantification of SLC25A33 levels is shown in the lower panel (mean ± SD; n = 7 independent cultures). c,d, Total mtDNA level monitored by qPCR (Cytb) in WT and Yme1l/ MEFs treated with the indicated siRNAs (Slc25a33 no. 1) (n = 3 independent cultures) (c) or in WT, Yme1l−/− and Yme1l−/−Slc25a33−/− MEFs (n = 5 independent cultures for WT and Yme1l−/−Slc25a33−/−; n = 4 independent cultures for Yme1l−/− (d). e, Immunoblot analysis of WT and Yme1l−/− MEFs treated with the indicated siRNAs (Slc25a33 no. 1) (representative blot from n = 3 independent cultures). f,g, mtDNA levels in cytosolic fractions monitored by qPCR (Cytb) in WT and Yme1l/ MEFs treated with the indicated siRNAs (Slc25a33 no. 1) (n = 3 independent cultures) (f) or in WT, Yme1l−/− and Yme1l−/−Slc25a33−/− MEFs (n = 5 independent cultures for WT and Yme1l−/−; n = 4 independent cultures for Yme1l−/−Slc25a33−/−) (g). h,i, ISG expression in WT and Yme1l/ MEFs treated with the indicated siRNAs (Slc25a33 no. 2) (n = 3 independent cultures) (h) or in WT, Yme1l−/− and Yme1l−/−Slc25a33−/− MEFs (n = 3 independent cultures) (i). P values calculated using two-tailed multiple t-test with Holm–Sidak method to correct for multiple comparisons (b), two-way ANOVA with Tukey’s multiple comparison test (c,f,h) or one-way ANOVA with Tukey’s multiple comparison test (d,g,i). Data (except b) are means ± s.e.m. Source data
Fig. 4
Fig. 4. SLC25A33 overexpression is sufficient to induce mtDNA-dependent innate immunity.
a, Immunoblot of WT and SLC25A33-Myc-Flag (A33-MycFlag) expressing HeLa cells treated with 40 µM ddC for 72 h (n = 1). b,c, Total and cytosolic mtDNA level in WT and SLC25A33–MycFlag (A33-MycFlag) expressing HeLa cells (n = 3 independent cultures (b) and n = 8 independent cultures (c)). d,e, ISG expression in WT and A33-MycFlag expressing HeLa cells treated with 40 µM ddC for 72 h analysed by RT–qPCR (d, n = 6 independent cultures) and RNA-Seq (e, n = 3 independent cultures). One hundred and eighty-one ISGs of 263 genes are upregulated (log2(fold change) ≥1) in A33-MycFlag versus WT cells in the absence of ddC. The heatmap depicts the relative expression of 181 ISGs in ddC-treated A33-MycFlag versus ddC-treated WT cells. f, ISG expression in WT and A33-MycFlag expressing HeLa cells treated with indicated esiRNAs (n = 3 independent cultures). P values calculated using two-tailed unpaired t-test (b,c) or two-way ANOVA with Tukey’s multiple comparison test (d,f). Data are means ± s.e.m. Source data
Fig. 5
Fig. 5. YME1L supports de novo nucleotide synthesis and maintains cellular nucleotide balance.
a, Immunoblot analysis of isolated mitochondria using HA-MITO-expressing MEFs (left) and a heatmap showing log2(fold change) in the indicated nucleotide levels in Yme1l−/− MEFs (n = 8 independent cultures) compared with WT (n = 7 independent cultures). Each square represents an individual replicate. b, Heatmap of log2(fold change) in the indicated nucleotide levels in Yme1l−/− compared with WT. Each square represents an individual replicate (n = 5 independent cultures). c, The atom fraction enrichment of glutamine-derived 13C and/or 15N in nucleotides after treatment of WT and Yme1l/ MEFs with 2 mM 13C515N2-glutamine for 6 h (n = 6 independent cultures). Mass isotopologue distribution within each nucleotide species are shown in Extended Data Fig. 6a,b and Supplementary Table 1. d, Graphical representation of 13C515N2-glutamine flux in and out of the TCA cycle via glutaminolysis in WT and Yme1l−/− MEFs cultured for 30 min in medium containing 2 mM 13C515N2-glutamine (n = 6 independent cultures). The main isotopologue(s) of each metabolite are indicated below each chart and plotted as the fraction of the sum of all isotopologues. All enriched isotopologues are shown in Extended Data Fig. 6c and Supplementary Table 1. P values calculated using two-tailed multiple t-test with Holm–Sidak method to correct for multiple comparisons (a,b,c) or two-tailed unpaired t-test (d). NS, not significant; TCA, tricarboxylic acid cycle. Data are means ± s.e.m. Source data
Fig. 6
Fig. 6. Rebalancing pyrimidine metabolism in YME1L-deficient cells protects against mtDNA release and inflammation.
a, ISG expression determined by RT–qPCR in WT and Yme1l−/− MEFs treated with the indicated siRNAs (n = 3 independent cultures). b, ISG expression determined by RT–qPCR in WT and Yme1l−/− MEFs treated with the indicated siRNAs (n = 3 independent cultures). c, Dihydroorotate and nucleotide levels determined by mass spectrometry (c) in WT and Yme1l/ MEFs treated with the indicated siRNAs. Centre lines denote medians; box limits denote 25th and 75th percentiles; whiskers denote maxima and minima (n = 4 independent cultures). d,e, mtDNA levels in cytosolic fractions monitored by qPCR (n = 4 independent cultures) (d) and ISG expression by RT–qPCR (n = 3 independent cultures) (e) in WT and Yme1l/ MEFs cultured in the presence or absence of pyrimidine nucleosides (Pyr; 100 µM cytidine, thymidine and uridine). P values calculated using two-way ANOVA with Tukey’s multiple comparison test (ac,e) or two-tailed unpaired t-test (d). Data are means ± s.e.m.
Fig. 7
Fig. 7. Inhibition of cytosolic pyrimidine metabolism induces mtDNA-dependent innate immunity.
a, ISG expression in WT MEFs treated with water or 20 µM ddC for 9 days followed by 30 µM BPTES for 24 h (n = 3 independent cultures). b, ISG expression in WT MEFs treated with pyrimidine or purine synthesis inhibitors for 16 h (n = 1). LTX, lometrexol hydrate; LEF, leflunomide; 6-MP, 6-mercaptopurine. c, Nucleotide level in WT MEFs treated with 5 µM 5-FU for 16 h. Centre lines denote medians; box limits denote 25th and 75th percentiles; whiskers denote maxima and minima (n = 5 independent cultures). d, ISG expression in WT MEFs treated with a combination of 5 µM 5-FU and 200 µM thymidine (Td) for 16 h (n = 3 independent cultures). e,f, ISG expression in WT MEFs treated with indicated siRNAs (n = 4 independent cultures) (e) or 40 µM ddC for 9 days followed by 5 µM 5-FU for 16 h (n = 3 independent cultures) (f). g, ISG expression in WT MEFs treated with 10 µM of the VDAC1 oligomerization inhibitor VBIT-4 for 48 h followed by 5 µM 5-FU for 16 h (n = 3 independent cultures). h, RNA-Seq analysis of HeLa cells treated with Gfp or CAD esiRNA in the absence of ddC identified 64 ISGs upregulated upon CAD depletion (log2(fold change) ≥1). The heatmap depicts the relative expression of 64 ISGs in CAD-depleted cells that were treated or not treated with ddC (n = 3 independent cultures). P values calculated using two-way ANOVA with Tukey’s multiple comparison test (a,eg) or two-tailed unpaired t-test (c,d). AU, arbitrary units. Data are means ± s.e.m.
Fig. 8
Fig. 8. mtDNA-dependent innate immunity is coupled to cellular nucleotide metabolism.
The i-AAA protease YME1L is required for efficient de novo pyrimidine synthesis and limits accumulation of the mitochondrial pyrimidine transporter SLC25A33. Loss of YME1L or cytosolic pyrimidine synthesis inhibition leads to an imbalance in cellular nucleotide pools. Deregulated mitochondrial nucleotide uptake and mtDNA replication may trigger the release of mtDNA into the cytosol. Cytosolic mtDNA is either degraded by the exonuclease TREX1 to replenish cytosolic nucleotide pools or binds to cGAS, which induces a STING-dependent innate immune response and autophagy.
Extended Data Fig. 1
Extended Data Fig. 1. Innate immune signaling in Yme1l-/- MEFs.
a, ISG expression analyzed by qRT-PCR in wildtype (WT) and Yme1l-/- MEFs (n=3 independent cultures). b, ISGs (blue, 1797) are highlighted among all significantly upregulated transcripts (3478) from RNA-Seq experiments in MEFs treated with scrambled (Scr) or siRNA against Yme1l (n=3 independent cultures). Venn diagram shows classification of all ISG transcripts into type I, II or III interferon responses (IFN) according to the Interferome database. c-g, qRT-PCR analysis to monitor ISG expression or knockdown efficiencies in MEFs treated with indicated siRNAs or esiRNAs. Immortalized MEFs were used in c,d,f,g,h (n=3 independent cultures). Primary MEFs were used in e (n=3 independent cultures). P values calculated using two-tailed unpaired t-test (a,c,g, right panels in h); two-way ANOVA with Tukey`s multiple comparison test (d and f); one-way ANOVA with Tukey`s multiple comparison test (e) Dunnett`s multiple comparison test (left panel in h). Data are means ± SEM.
Extended Data Fig. 2
Extended Data Fig. 2. MtDNA release into the cytosol in YME1L-deficient cells.
a, Heatmap of expression (RNA-Seq; z-score normalized log2 FPKM values) of ISGs, which were previously described to be induced by mtDNA stress upon depletion of TFAM (including in addition Mx1), in MEFs treated with scrambled (scr) or Yme1l siRNA (n=3 independent cultures). b, Total mtDNA levels analyzed by q-PCR amplification of Cytb in wildtype (WT) and Yme1l-/- MEFs treated with 20 µM ddC for 9 days (n=3 independent cultures). c, ISG expression and total mtDNA levels monitored by q-PCR amplification of Cytb in Yme1l-/- MEFs treated with 20 µM ddC for 72 h (n=3 independent cultures). d, Immunoblot analysis of cells treated as in (c) using antibodies directed against RIG-I, STAT1, STING, and, as loading control, β-ACTIN (n=3 independent cultures). e, ISG expression and total mtDNA (Cytb) in Yme1l-/- MEFs treated with 300 ng/µl ethidium bromide (EtBr) for 72 h (n=3 independent cultures). f, ISG expression in WT MEFs transfected with 70bp oligonucleotides containing viral DNA motifs (VACV-70) after treatment with 40 µM ddC for 9 days (n=3 independent cultures). g, SDS-PAGE and immunoblot analysis of cytosolic fractions using antibodies directed against GAPDH (cytosol), SDHA (mitochondria) and calnexin (ER). Ponceau S (PoS) was used as a loading control (n=1). h, Expression levels of the Dloop region as a marker for mtDNA in cytosolic fractions from MEFs. Three different regions within the Dloop were amplified (n=3 independent cultures). P values calculated using two-way ANOVA with Tukey`s multiple comparison test (b and f); two-tailed unpaired t-test (c,e,h). Data are means ± SEM. Source data
Extended Data Fig. 3
Extended Data Fig. 3. Innate immunity in YME1L-deficient cells is independent of mitochondrial fragmentation and BAX/BAK pores.
a, ISG expression analyzed by qRT-PCR in Yme1l-/- MEFs treated with the indicated siRNAs (left panel) (n=3 independent cultures). Analysis of MEFs by immunocytochemistry using antibodies directed against ATP5B (mitochondria) is shown in the right panel. Scale bar =20 µm; Scale bar in zoom images = 5 µm. (n=1) (b) Immunoblot analysis of WT and Bax-/-Bak-/- MEFs (left panel) (n=1). qRT-PCR analysis to monitor ISG expression or knockdown efficiencies in Bax-/-Bak-/- MEFs treated with indicated siRNAs (right) (n=3 independent cultures). P values calculated using two-tailed unpaired t-test. Data are means ± SEM. Source data
Extended Data Fig. 4
Extended Data Fig. 4. Gene expression analysis and SLC25A33-dependent ISG expression in YME1L-deficient cells.
a, RNA-Seq analysis of proteins accumulating in Yme1l-/- MEFs (n=3 independent cultures) identified by quantitative mitochondrial proteomics (14). Log2 transformed fold changes of mRNA and protein levels are shown. Cmpk2, Nme4 and Slc25a33 are highlighted in red and illustrated in Fig. 3a. The fold change of some proteins (for example Cmpk2 and Ass1) was not determined since they were detected exclusively in Yme1l-/- mitochondria (14). b, Total mtDNA levels (CYTB) monitored by q-PCR in wildtype (WT) and YME1L-/- HeLa treated with indicated esiRNAs (n=6 independent cultures). c, ISG and Slc25a33 expression in WT and Yme1l-/- MEFs treated with the indicated siRNAs (Data for Scr and Slc25a33#2 siRNAs are the same as shown in Fig. 3h) (n=3 independent cultures). d, ISG expression in cells treated with 2µg of VACV-70 viral DNA motif for 4 h after 72 h incubation with the indicated siRNAs (n=1). e, Immunoblot analysis of WT, Slc25a33-/-, Yme1l-/- and Yme1l-/-Slc25a33-/-MEFs (n=1). Arrows indicate STAT1 and SLC25A33 protein level, respectively. f, ISG expression monitored by qRT-PCR in primary WT MEFs treated with indicated siRNAs (Slc25a33 #2) (n=3 independent cultures). g, ISG expression in WT and Tfam+/- MEFs treated with indicated siRNAs (Slc25a33 #2) (n=4 independent cultures). P values calculated using two-way ANOVA with Tukey`s multiple comparison test (b, c and g) and one-way ANOVA with Tukey`s multiple comparison test (f). Data are means ± SEM. Source data
Extended Data Fig. 5
Extended Data Fig. 5. ISG expression in WT and YME1L-deficient MEFs treated with siRNAs against different SLC25 carrier proteins.
a-d, ISG expression monitored by qRT-PCR in WT and Yme1l-/- MEFs treated with indicted siRNAs (n=3 independent cultures). Data are means ± SEM.
Extended Data Fig. 6
Extended Data Fig. 6. Cell growth and mass isotopologue anaylsis in WT and Yme1l-/- cells.
a,b, Mass isotopologue distribution in pyrimidines (a) and purines (b) from WT and Yme1l-/- MEFs cultured for 6 h in medium containing 2 mM 13C5,15N2 glutamine (n=6 independent cultures). Each isotopologue is shown as a fraction of the sum of all possible isotopologues. c, Mass isotopologue distribution in the indicated metabolites after 30 min labelling with 13C5, 15N2-Glutamine in WT and Yme1l-/- MEFs. For glutamate and aspartate, the presence and number of assimilated 13C and/or 15N in each metabolite isotopologue fraction is shown. For the other metabolites, isotopologue masses (M) are determined by the number of assimilated 13C. Selected isotopologues of each metabolite with statistical analysis are shown in Fig. 5d (n=6 independent cultures) and all metabolite isotopolgues are presented in Supplementary Table 1. d, Cell growth of WT and Yme1l-/- MEFs monitored in IncuCyte S3 live-cell analysis system (n=3 independent cultures). P values calculated using two-tailed multiple t-test with Holm-Sidak method to correct for multiple comparisons (a,b). Data are means ± SEM.
Extended Data Fig. 7
Extended Data Fig. 7. No evidence of DNA damage in YME1L-deficient cells.
a-b, Expression levels of Ass1 and Samhd1 monitored by qRT-PCR in WT and Yme1l-/- MEFs treated with the indicated siRNAs (n=3 independent cultures). c, Immunoblot analysis of WT and Yme1l-/- MEFs treated with indicated siRNAs (n=3 independent cultures). d-e, Log2 transformed fold changes of mRNA (RNA-Seq) of previously published DNA damage response (DDR) associated genes in Yme1l-/- compared to WT MEFs (n=3 independent cultures) (d) and in HeLa cells expressing SLC25A33-MycFlag compared to WT (n=3 independent cultures) (e). f, ISG expression in WT MEFs cultured in the presence or absence of pyrimidine nucleosides (Pyr) and transfected with 2 µg of VACV-70 for 4 h (n=3 independent cultures). g, ISG expression in WT and Tfam+/- MEFs cultured in the presence or absence of pyrimidine nucleosides (n=3 independent cultures). P values calculated using two-way ANOVA with Tukey`s multiple comparison test (a,b,f,g). d-e, Statistical significance was determined using Benjamini–Hochberg method. p-values p<0.05 were considered to be significant. ns= not significant. Data are means ± SEM. Source data
Extended Data Fig. 8
Extended Data Fig. 8. Cellular nucleotide metabolism is linked to ISG expression.
a, Nucleotide level in WT MEFs treated with 30 µM BPTES for 4 h (n=3 independent cultures). b, ISG expression in WT MEFs treated with indicated siRNAs and 30 µM BPTES for 24 h (n=3 independent cultures). c, ISG expression in WT MEFs treated with 25 µM GLS968 for 24 h (n=3 independent cultures). d, ISG expression in WT MEFs treated with 200 µM thymidine (Td) for 48 h and transfected with 2 µg of the indicated dsDNA motifs for 4 h (n=1). e, Immunoblot analysis of HeLa cells treated with indicated esiRNAs (representative immunoblot from n=3 independent cultures. f, Nucleotide level in WT HeLa cells treated with indicated esiRNAs (n=5 independent cultures). g, ISG expression in HeLa cells treated with 40 µM ddC for 6 days and the indicated esiRNA (n=3 independent cultures). P values calculated using two-tailed unpaired t-test (a,c,f); two-way ANOVA with Tukey`s multiple comparison test (b and g). NS= not significant. Data are means ± SEM. Source data

References

    1. Weinberg SE, Sena LA, Chandel NS. Mitochondria in the regulation of innate and adaptive immunity. Immunity. 2015;42:406–417. - PMC - PubMed
    1. Riley JS, Tait SW. Mitochondrial DNA in inflammation and immunity. EMBO Rep. 2020;21:e49799. - PMC - PubMed
    1. Kim J, et al. VDAC oligomers form mitochondrial pores to release mtDNA fragments and promote lupus-like disease. Science. 2019;366:1531–1536. - PMC - PubMed
    1. West AP, et al. Mitochondrial DNA stress primes the antiviral innate immune response. Nature. 2015;520:553–557. - PMC - PubMed
    1. Wu Z, et al. Mitochondrial DNA stress signalling protects the nuclear genome. Nat. Metab. 2019;1:1209–1218. - PMC - PubMed

Publication types