. 2021 Jun 7;220(6):e202007030.
doi: 10.1083/jcb.202007030.

Tension promotes kinetochore-microtubule release by Aurora B kinase

Affiliations

Tension promotes kinetochore-microtubule release by Aurora B kinase

Geng-Yuan Chen et al. J Cell Biol. .

Abstract

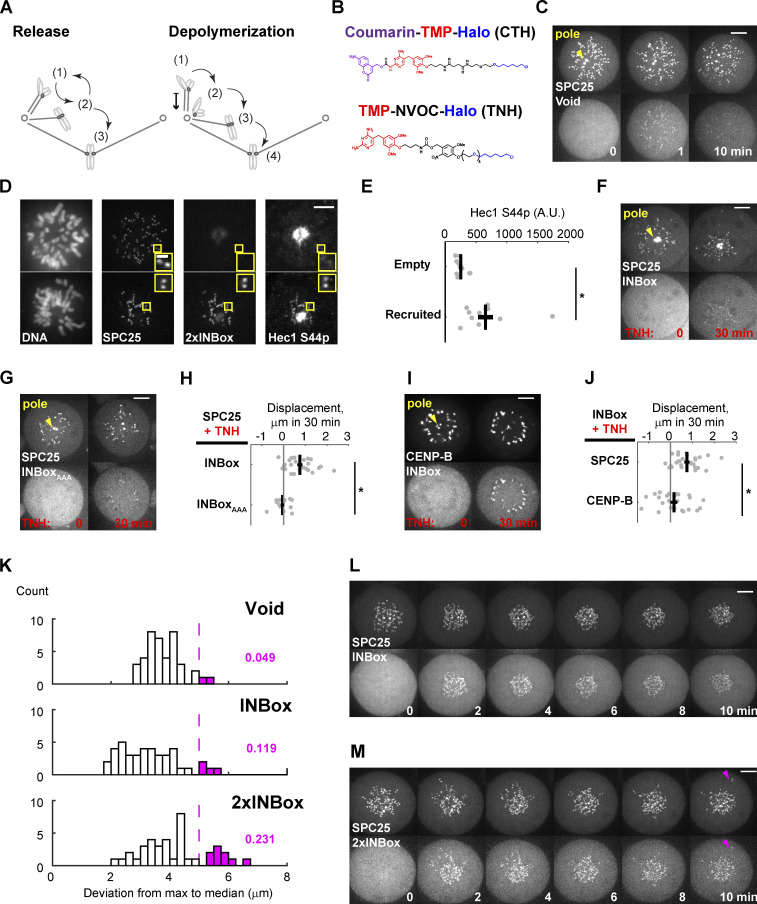
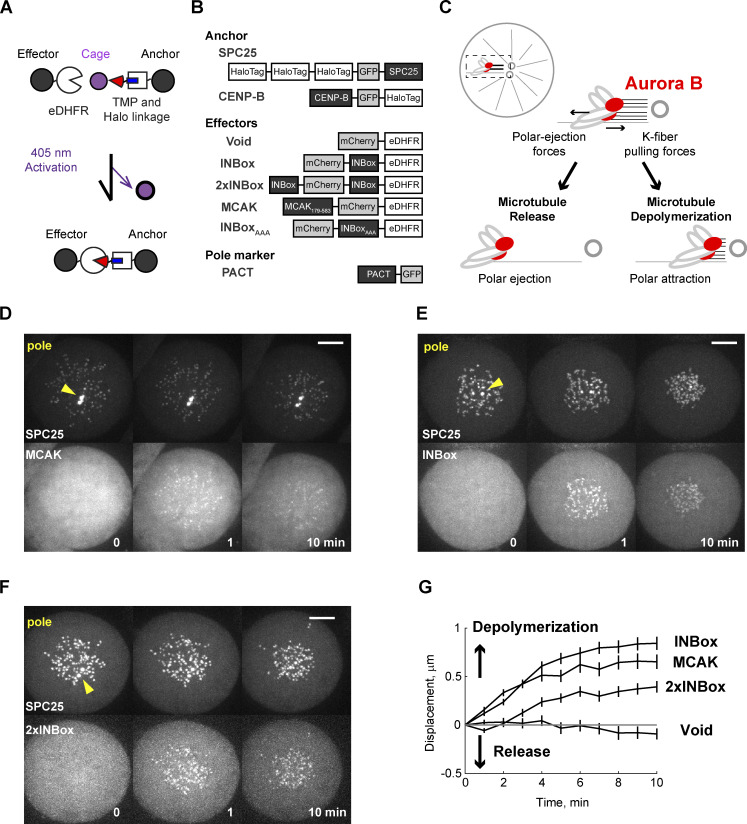
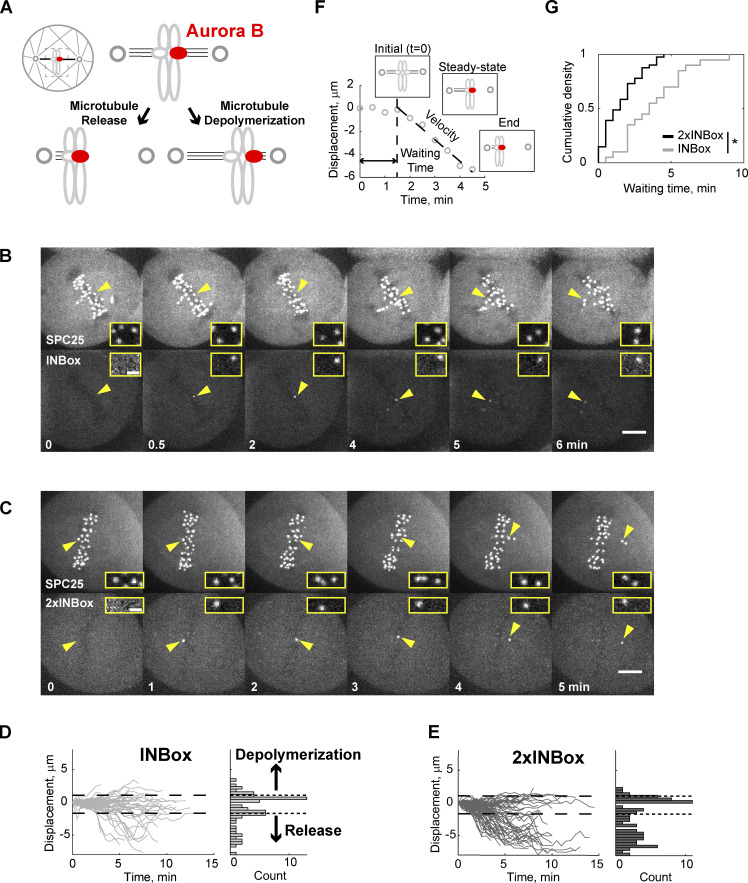
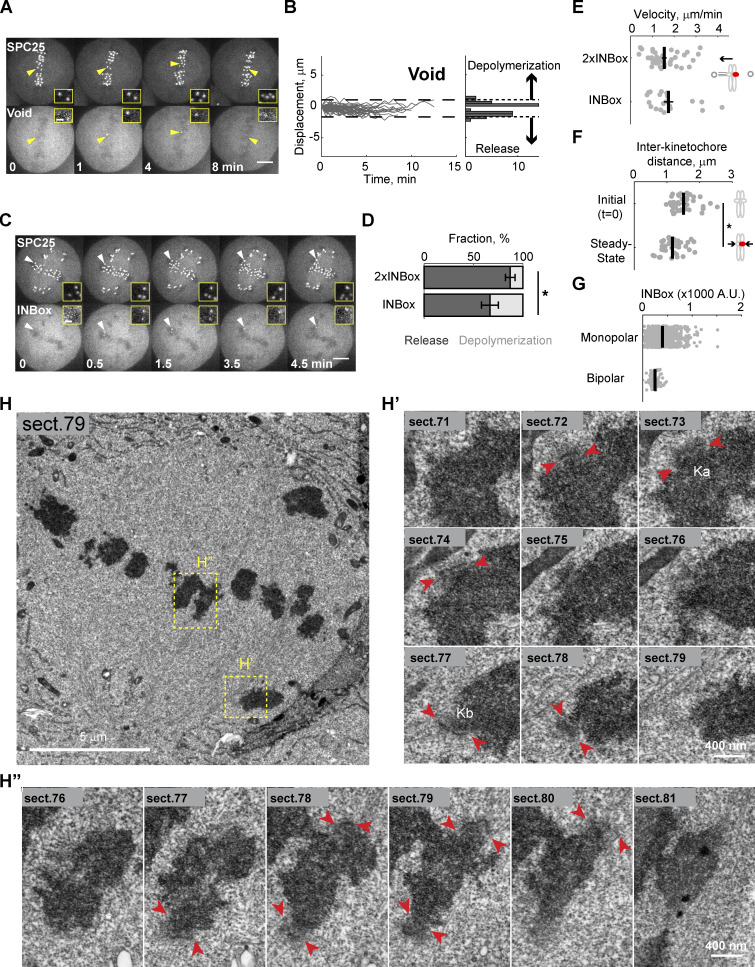
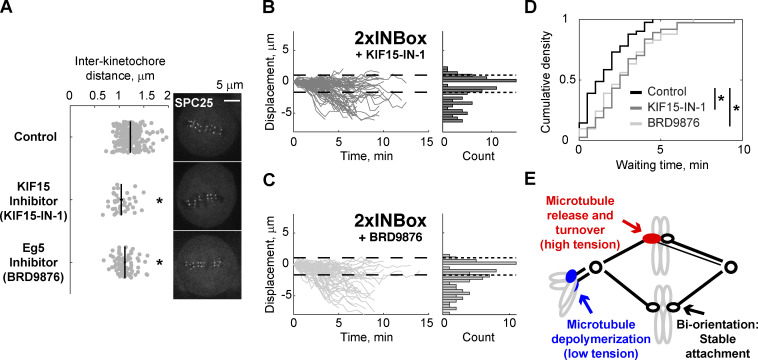
To ensure accurate chromosome segregation, interactions between kinetochores and microtubules are regulated by a combination of mechanics and biochemistry. Tension provides a signal to discriminate attachment errors from bi-oriented kinetochores with sisters correctly attached to opposite spindle poles. Biochemically, Aurora B kinase phosphorylates kinetochores to destabilize interactions with microtubules. To link mechanics and biochemistry, current models regard tension as an input signal to locally regulate Aurora B activity. Here, we show that the outcome of kinetochore phosphorylation depends on tension. Using optogenetics to manipulate Aurora B at individual kinetochores, we find that kinase activity promotes microtubule release when tension is high. Conversely, when tension is low, Aurora B activity promotes depolymerization of kinetochore-microtubules while maintaining attachment. Thus, phosphorylation converts a catch-bond, in which tension stabilizes attachments, to a slip-bond, which releases microtubules under tension. We propose that tension is a signal inducing distinct error-correction pathways, with release or depolymerization being advantageous for typical errors characterized by high or low tension, respectively.


Figures

Figure S1.
Figure S1.
Related to Fig. 1. (A) Two proposed models of error correction mediated by Aurora B kinase. State 1 is the initial incorrect state. In the release model, microtubules detach from kinetochores (state 2) to allow new attachments to form. The process is iterative until bi-oriented attachments (state 3) are stabilized. In the depolymerization model, microtubules depolymerize while maintaining kinetochore attachment, generating poleward chromosome movement. Microtubules detach near the pole (state 2), followed by translocation along another K-fiber to the spindle equator (state 3), and binding of a microtubule from the opposite pole to achieve bi-orientation (state 4). (B) The photocaged and uncaged chemical dimerizers used in this study. CTH consists of the following components: A coumarin photocage; trimethoprim (TMP), which binds eDHFR; and a Halo ligand, which binds covalently to the HaloTag protein. TNH, consisting of TMP linked to NVOC (6-nitroveratryl oxycarbonyl) and a Halo ligand, was used for dimerization without requiring uncaging. (C) Representative images of the negative control (Video 2; yellow triangles label spindle poles). (D and E) Hec1-Ser44 phosphorylation after 2×INBox recruitment with TNH. Images (D) show immunostaining with a phospho-specific antibody in the presence or absence of 2×INBox recruitment to kinetochores. Quantification of Hec1-S44p signals shows higher phosphorylation with 2×INBox recruitment (n = 10 and 11 cells for nonrecruited and recruited kinetochores, respectively). Black lines: Mean ± SEM. (F–J) Depolymerization depends on Aurora B kinase activity and the location of the recruitment site. Representative images show INBox (F; n = 27) or INBoxAAA (G; n = 15) recruitment to the outer kinetochore anchor SPC25, or INBox recruitment to the inner centromere anchor CENP-B (I; n = 24), using TNH. INBoxAAA denotes alanine substitutions at the INBox TSS motif to prevent kinase activation. Images are maximum-intensity projection across z-slices that cover spindle poles for analyses. Displacements (H and J) quantified as in Fig. 1 G. Black lines: Mean ± SEM. (K–M) Aurora B kinases recruitment to kinetochores on monopolar spindles, using CTH, partially triggers microtubule release (same data as Fig. 1, E and F, Fig. S1 C, and Videos 2, 3, and 4). (K) Radial distance from the outermost kinetochores to the population median in the 10-min time window (same dataset as Fig. 1 G). Most kinetochores move toward the pole after activation, but kinetochores that release microtubules should be pushed away from the pole, leading to a large deviation (M, magenta triangles). Magenta bars indicate two of 41 control (Void-recruited) cells (4.9%), with at least one kinetochore pushed away. Cells with INBox recruitment contain fewer such kinetochores (L; 11.9%) than with 2×INBox recruitment (M; 23.1%). *, P < 0.05. Scale bars: 5 µm or 1 µm in insets.
Figure 1.
Figure 1.
Recruitment of Aurora B to syntelic kinetochores triggers microtubule depolymerization. (A) Light-induced dimerization schematic. The dimerizer has a Halo ligand (blue) linked to the eDHFR ligand trimethoprim (TMP; red), which is protected by a photoactivatable cage (purple). The kinetochore protein SPC25 anchors HaloTag at the outer kinetochore, and effectors are fused to eDHFR. Effectors are recruited to kinetochores by uncaging the HaloTag-bound dimerizer with light. (B) Constructs for this study. Dimerizer uncaging recruits eDHFR-tagged effector proteins (or Void as a negative control). The PACT domain targets to centrosomes to label spindle poles (yellow triangles; Gillingham and Munro, 2000). (C) Schematic of monopolar spindle assay, with chromosomes under a tug of war between K-fiber depolymerization and polar ejection forces. Red circles indicate Aurora B–activated kinetochores. After full or partial release of kinetochore microtubules, polar ejection forces dominate and chromosomes move away from spindle poles. In contrast, depolymerization increases poleward forces. (D–F) Representative images before and after uncaging at t = 0 (Videos 1, 2, 3, and 4). (G) Kinetochore displacement over time. For each cell, kinetochore-pole distances are measured and averaged at every time point. Displacements are defined relative to t = 0, with poleward movement defined as the positive direction (Void: n = 41 cells; MCAK: n = 46; INBox: n = 42; 2×INBox: n = 39; mean ± SEM). Scale bars, 5 µm.
Figure 2.
Figure 2.
Recruitment of Aurora B to a single kinetochore of a bi-oriented pair triggers microtubule release. (A) Schematic of bipolar spindle assay. The bi-oriented sisters are under a tug of war between the two attached K-fibers. Microtubule release or depolymerization at the activated kinetochore (red circles) leads to movement in opposite directions. (B and C) Images from representative experiments showing INBox (B; Video 6) or 2×INBox (C; Video 8) recruitment after activation of a single kinetochore (yellow triangles) at t = 0. Insets show the targeted kinetochore pair at higher magnification. (D and E) Displacement of the activated kinetochore from the metaphase plate over time: Each trace represents a single kinetochore after INBox (D; n = 64) or 2×INBox (E; n = 79) recruitment, with the starting location defined as zero. Dashed lines show the range of chromosome dynamics covering 96% of control (Void recruited) kinetochores (Fig. S2, A and B; and Video 5). Histograms show maximal displacement for each trace. (F and G) Analyses of released kinetochores after INBox or 2×INBox recruitment. Example trace of 2×INBox recruitment (F) shows waiting time after activation, followed by movement at steady-state velocity (Fig. S2 E). (G) Waiting time distribution (2×INBox: median = 1.5 min, n = 41; INBox: median = 3.5 min, n = 20). *, P < 0.005. Scale bars, 5 µm or 1 µm in insets.
Figure S2.
Figure S2.
Related to Figs. 2 and 3. (A and B) Representative images (A) and displacements (B) for Void recruitment to a single kinetochore (yellow triangles) of a bi-oriented pair, as a negative control. Displacements, plotted as in Fig. 2, D and E, were used to define the range of naturally occurring chromosome oscillations (dashed lines cover 45 of 47 traces, 96%; Video 5). (C) Representative images showing kinetochore movement indicating microtubule depolymerization after recruiting INBox to a single kinetochore (white triangles; Video 7). (A and C) Inset: The targeted kinetochore pair at higher magnification. Scale bars in A and C: 5 µm or 1 µm in insets. (D) The fraction of release vs. depolymerization events from Fig. 2, D and E (2×INBox: 87 ± 5% mean ± SEM, n = 47; INBox: 67 ± 9% mean ± SEM, n = 30; *, P < 0.05, one tailed). (E and F) Steady-state velocities (E) and interkinetochore distances (F) for released kinetochores. Distances are plotted before activation and at steady-state after 2×INBox recruitment. Each data point represents a single kinetochore or pair of sisters. Black lines: Mean ± SEM (n = 41 for 2×INBox, n = 20 for INBox; *, P < 0.05). (G) INBox recruitment on monopolar and bipolar spindles, measured as mCherry intensity (mean ± SEM). (H) Higher magnification of the image shown in Fig. 3 B. Full series of sections through the centromeres of chromosomes within yellow boxes are shown in H′ and H′′. (H') The activated kinetochore Ka and and its non-activated sister kinetochore Kb. Microtubules have been released from Ka but are present at Kb. Arrowheads denote kinetochore plates. (H′′) Non-irradiated sister kinetochores of a properly aligned chromosome within the metaphase plate. Similar number of microtubules are attached to both kinetochores.
Figure 3.
Figure 3.
Activated kinetochores lack end-on microtubule attachments. (A) Live imaging showing 2×INBox recruitment and chromosome movement after activation of a single kinetochore (yellow triangles) at t = 0, as in Fig. 2 C. (B) The same cell was fixed at 3.5 min and examined by fluorescence and serial-section EM. Top: A single focal plane shows 2×INBox overlaying SPC25 at the activated kinetochore (white arrow) and chromosomes by fluorescence, and the corresponding section from the 3D EM dataset. Kinetochores of the activated chromosome pair (B’) and a nonactivated aligned chromosome (B′′) are shown at higher magnification below (blue: DNA; green: microtubules; magenta: kinetochores). Microtubules are bound to the leading kinetochore (Kb), but not the activated lagging kinetochore (Ka). Full EM series through these two kinetochores are shown in Fig. S2 H.
Figure S3.
Figure S3.
Related to Fig. 4. (A and B) Displacement of the activated kinetochore, plotted as in Fig. 2, D and E, with 20 µM proTAME to delay mitotic exit (2×INBox: n = 54; INBox: n = 56). (C and D) Waiting time of the released kinetochores after recruiting 2×INBox (control: median = 1.5 min, n = 41; proTAME: median = 1.5 min, n = 28) or INBox (control: median = 3.5 min, n = 20; proTAME: median = 3.0 min, n = 23). (E) The fraction of release vs. depolymerization events after recruiting 2×INBox or INBox. Differences in the presence or absence of proTAME (C–E) are not statistically significant (P > 0.05; mean ± SEM). (F and G) Interkinetochore distances at varying concentrations of rigor inhibitors for KIF15 (KIF15-IN-1: IC50 = 21 µM) or Eg5 (BRD9876: IC50 = 2 µM). Open triangles represent the concentrations used for 2×INBox recruitment assays in Fig. 4, B and C (KIF15-IN-1: 40 µM; KIF15-IN-1: 20 µM). (H) The fraction of release vs. depolymerization events from Fig. 4, B and C (control: 87 ± 5% mean ± SEM, n = 47; KIF15-IN-1: 84 ± 6% mean ± SEM, n = 44; BRD9876: 95 ± 3% mean ± SEM, n = 43).
Figure 4.
Figure 4.
Reducing interkinetochore tension slows release of kinetochore microtubules. (A) Representative images of cells treated with a KIF15 inhibitor (40 µM KIF15-IN-1), Eg5 inhibitor (20 µM BRD9876), or control (no inhibitor). In the plot, each data point represents a single kinetochore pair. Black lines: Mean ± SEM (n = 220 kinetochores for control; n = 40 for KIF15-IN-1; n = 81 for BRD9876; ∼8 pairs measured per cell). Entire titration curves are plotted in Fig. S3, F and G. (B and C) Displacement of the activated kinetochore after 2×INBox recruitment with KIF15 (B; n = 93) or Eg5 (C; n = 74) inhibition, plotted as in Fig. 2, D and E. (D) Waiting time distribution of the released kinetochores (control: median = 1.5 min, n = 41; KIF15-IN-1: median = 2.5 min, n = 37; BRD9876: median = 2.5 min, n = 41). (E) Model for distinct error-correction pathways at merotelic (red) and syntelic (blue) attachments in response to Aurora B activation. *, P < 0.05.

Similar articles

Cited by

References

    1. Akiyoshi, B., Sarangapani K.K., Powers A.F., Nelson C.R., Reichow S.L., Arellano-Santoyo H., Gonen T., Ranish J.A., Asbury C.L., and Biggins S.. 2010. Tension directly stabilizes reconstituted kinetochore-microtubule attachments. Nature. 468:576–579. 10.1038/nature09594 - DOI - PMC - PubMed
    1. Asai, Y., Fukuchi K., Tanno Y., Koitabashi-Kiyozuka S., Kiyozuka T., Noda Y., Matsumura R., Koizumi T., Watanabe A., Nagata K., et al. . 2019. Aurora B kinase activity is regulated by SET/TAF1 on Sgo2 at the inner centromere. J. Cell Biol. 218:3223–3236. 10.1083/jcb.201811060 - DOI - PMC - PubMed
    1. Bakhoum, S.F., Thompson S.L., Manning A.L., and Compton D.A.. 2009. Genome stability is ensured by temporal control of kinetochore-microtubule dynamics. Nat. Cell Biol. 11:27–35. 10.1038/ncb1809 - DOI - PMC - PubMed
    1. Ballister, E.R., Aonbangkhen C., Mayo A.M., Lampson M.A., and Chenoweth D.M.. 2014. Localized light-induced protein dimerization in living cells using a photocaged dimerizer. Nat. Commun. 5:5475. 10.1038/ncomms6475 - DOI - PMC - PubMed
    1. Banigan, E.J., Chiou K.K., Ballister E.R., Mayo A.M., Lampson M.A., and Liu A.J.. 2015. Minimal model for collective kinetochore-microtubule dynamics. Proc. Natl. Acad. Sci. USA. 112:12699–12704. 10.1073/pnas.1513512112 - DOI - PMC - PubMed

Publication types