. 2021 Jun;13(11):829-844.
doi: 10.2217/epi-2021-0078. Epub 2021 Apr 27.

Neonatal necrotizing enterocolitis-associated DNA methylation signatures in the colon are evident in stool samples of affected individuals

Affiliations

Neonatal necrotizing enterocolitis-associated DNA methylation signatures in the colon are evident in stool samples of affected individuals

Misty Good et al. Epigenomics. 2021 Jun.

Abstract

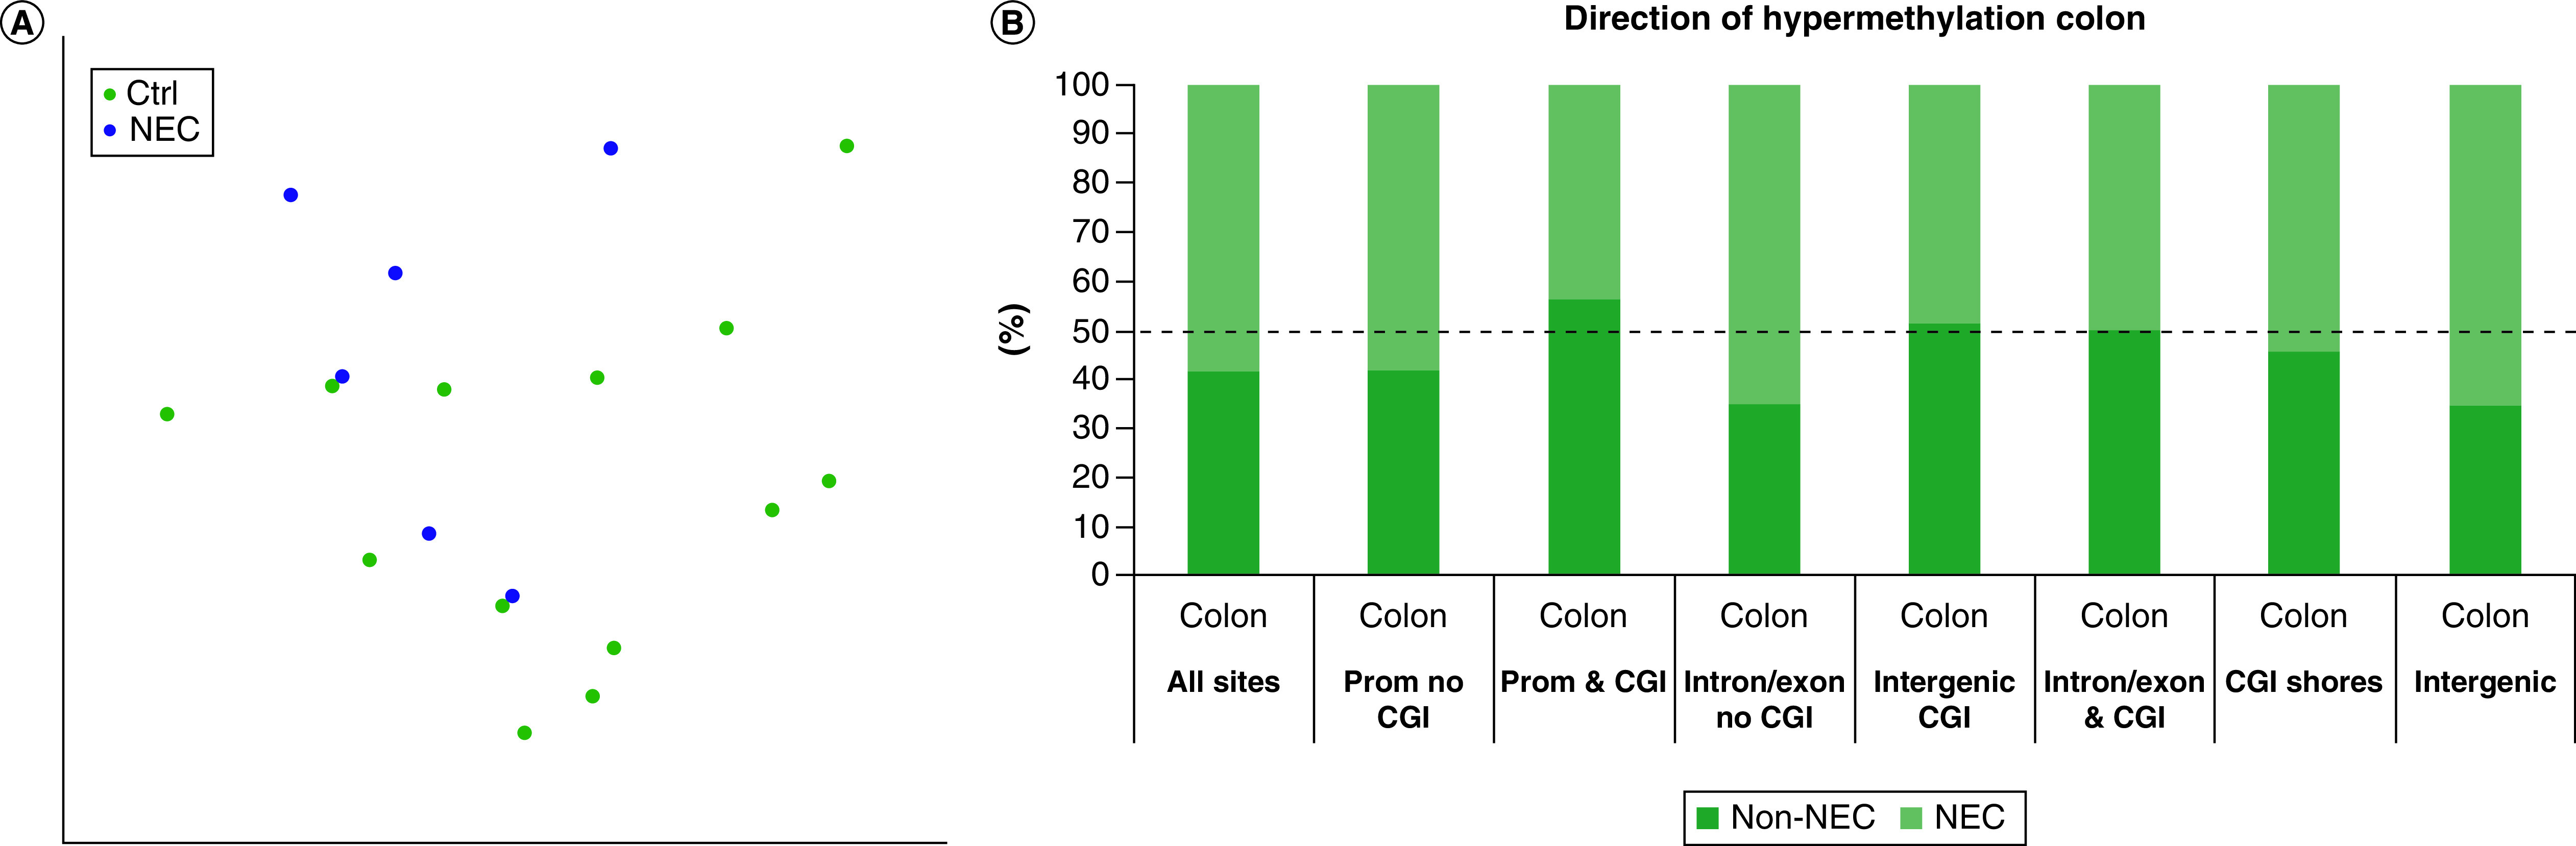
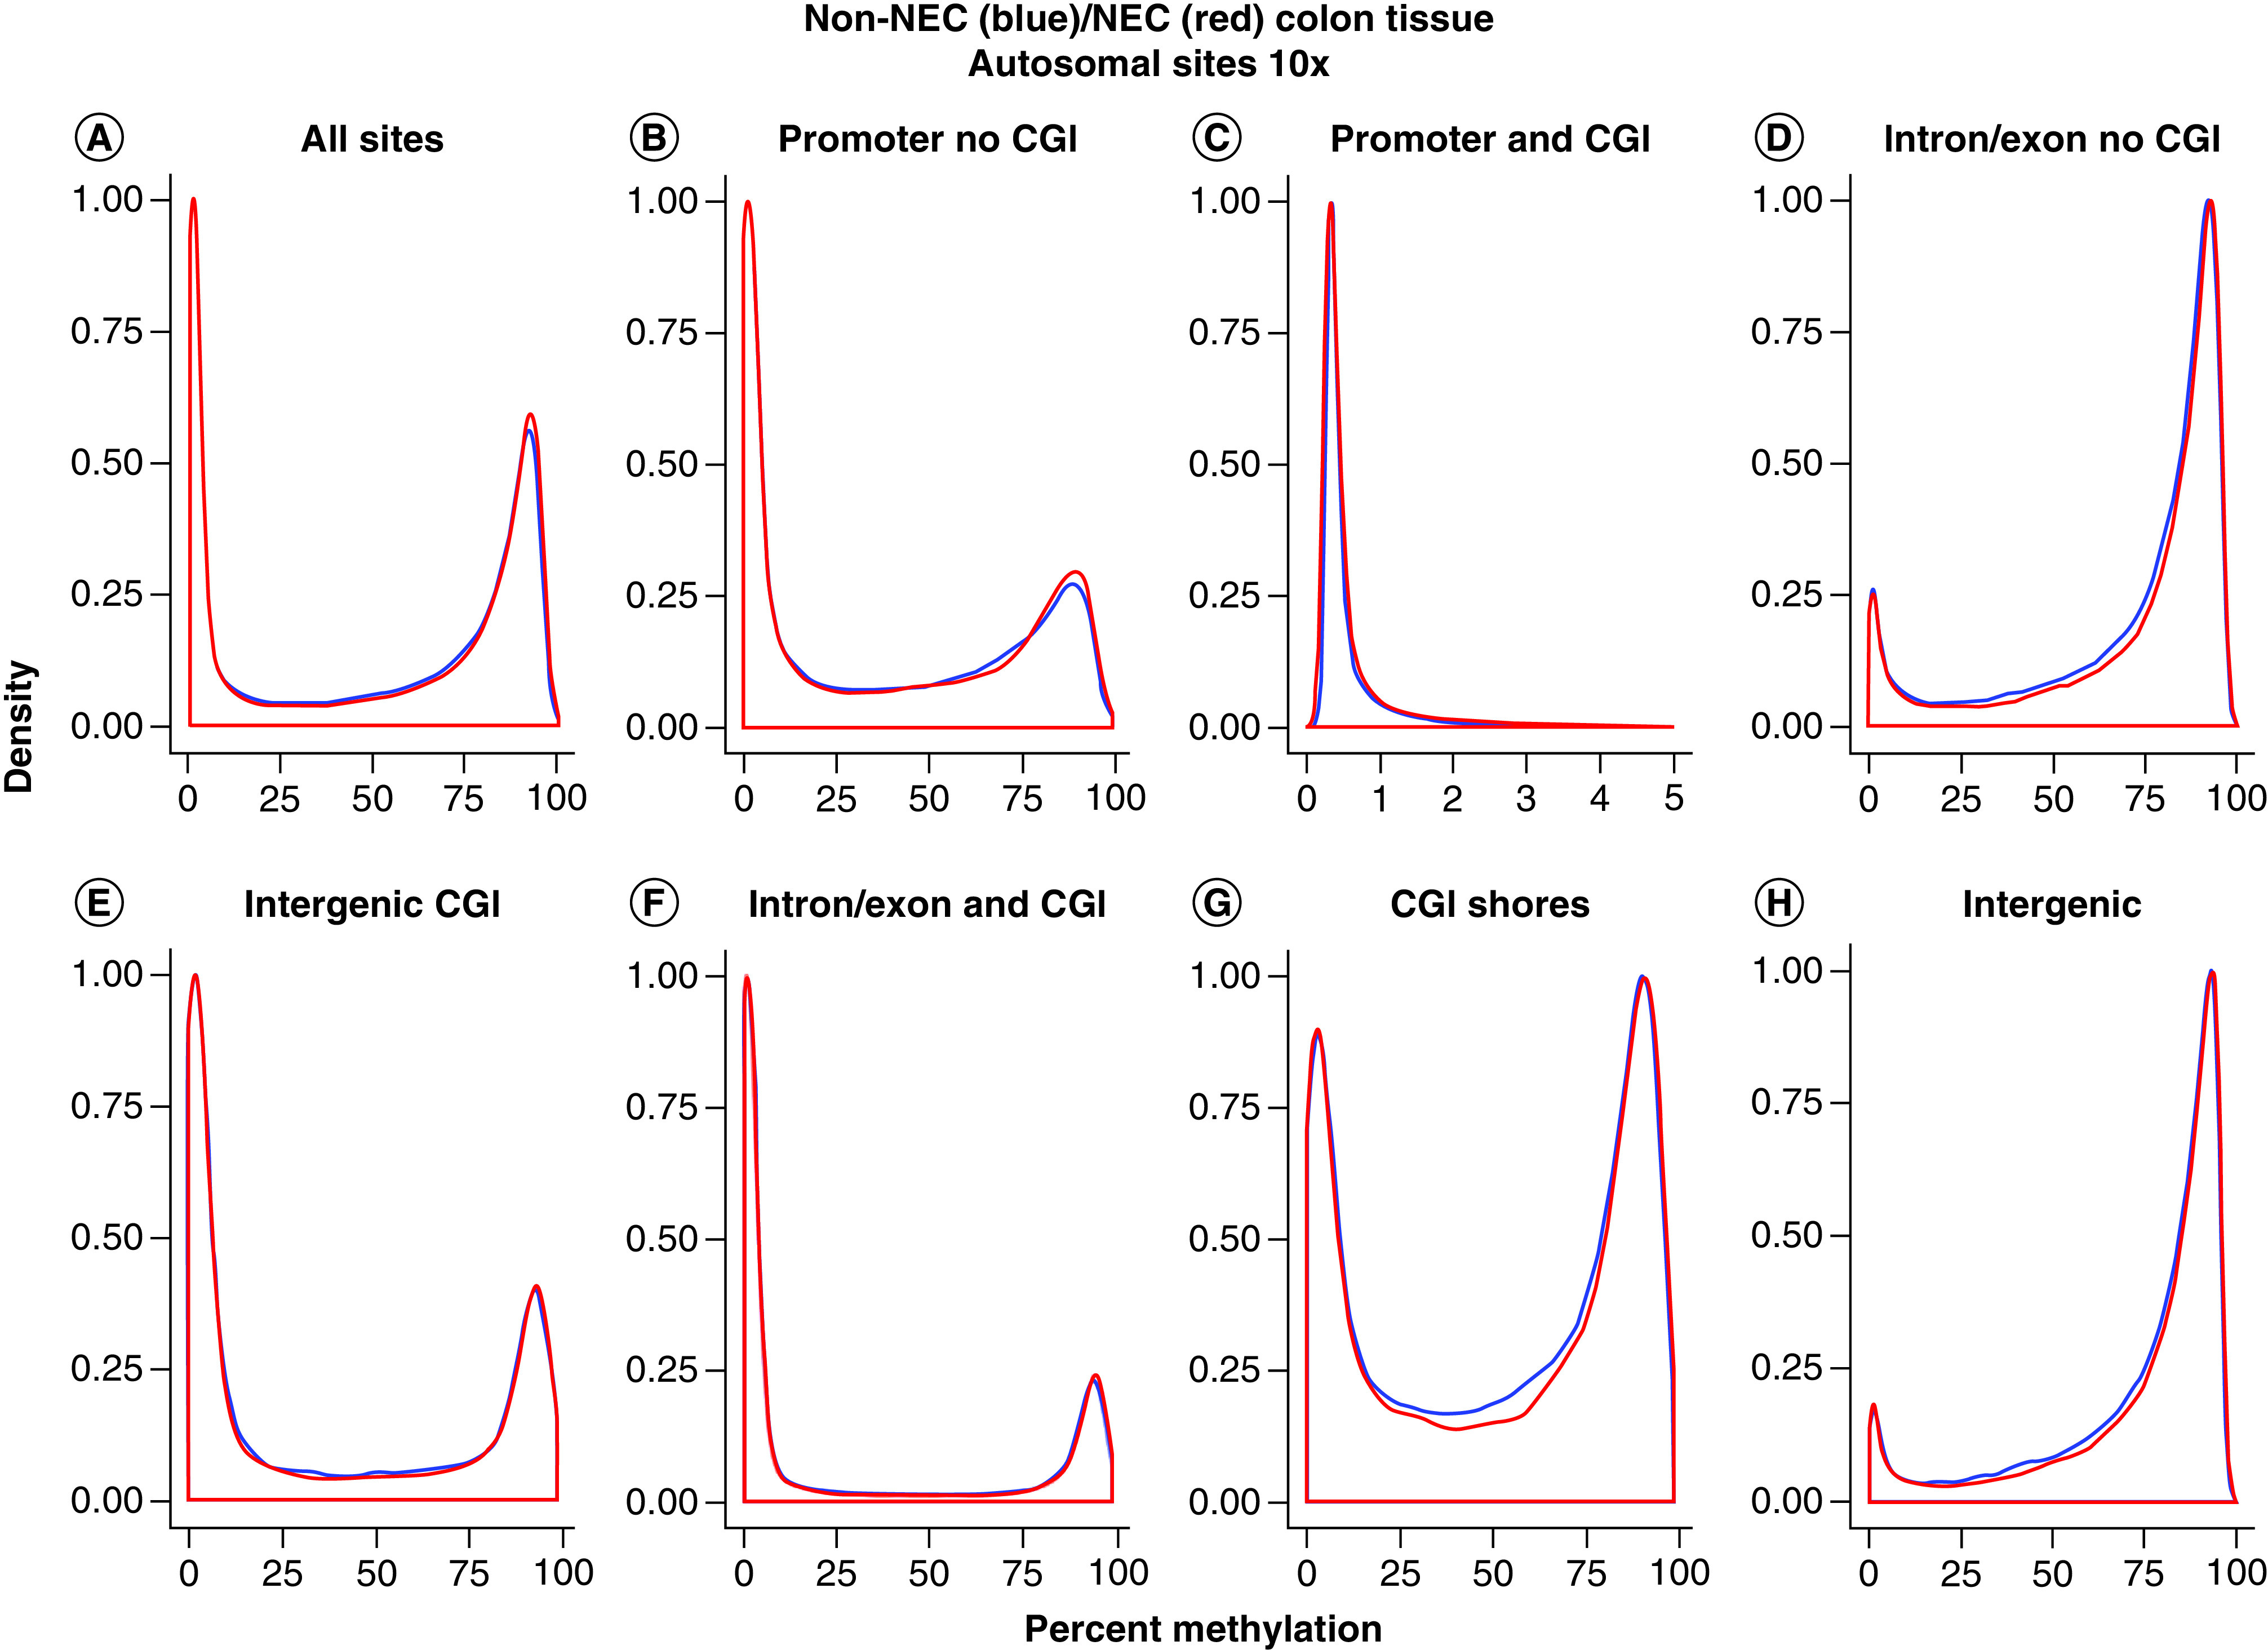
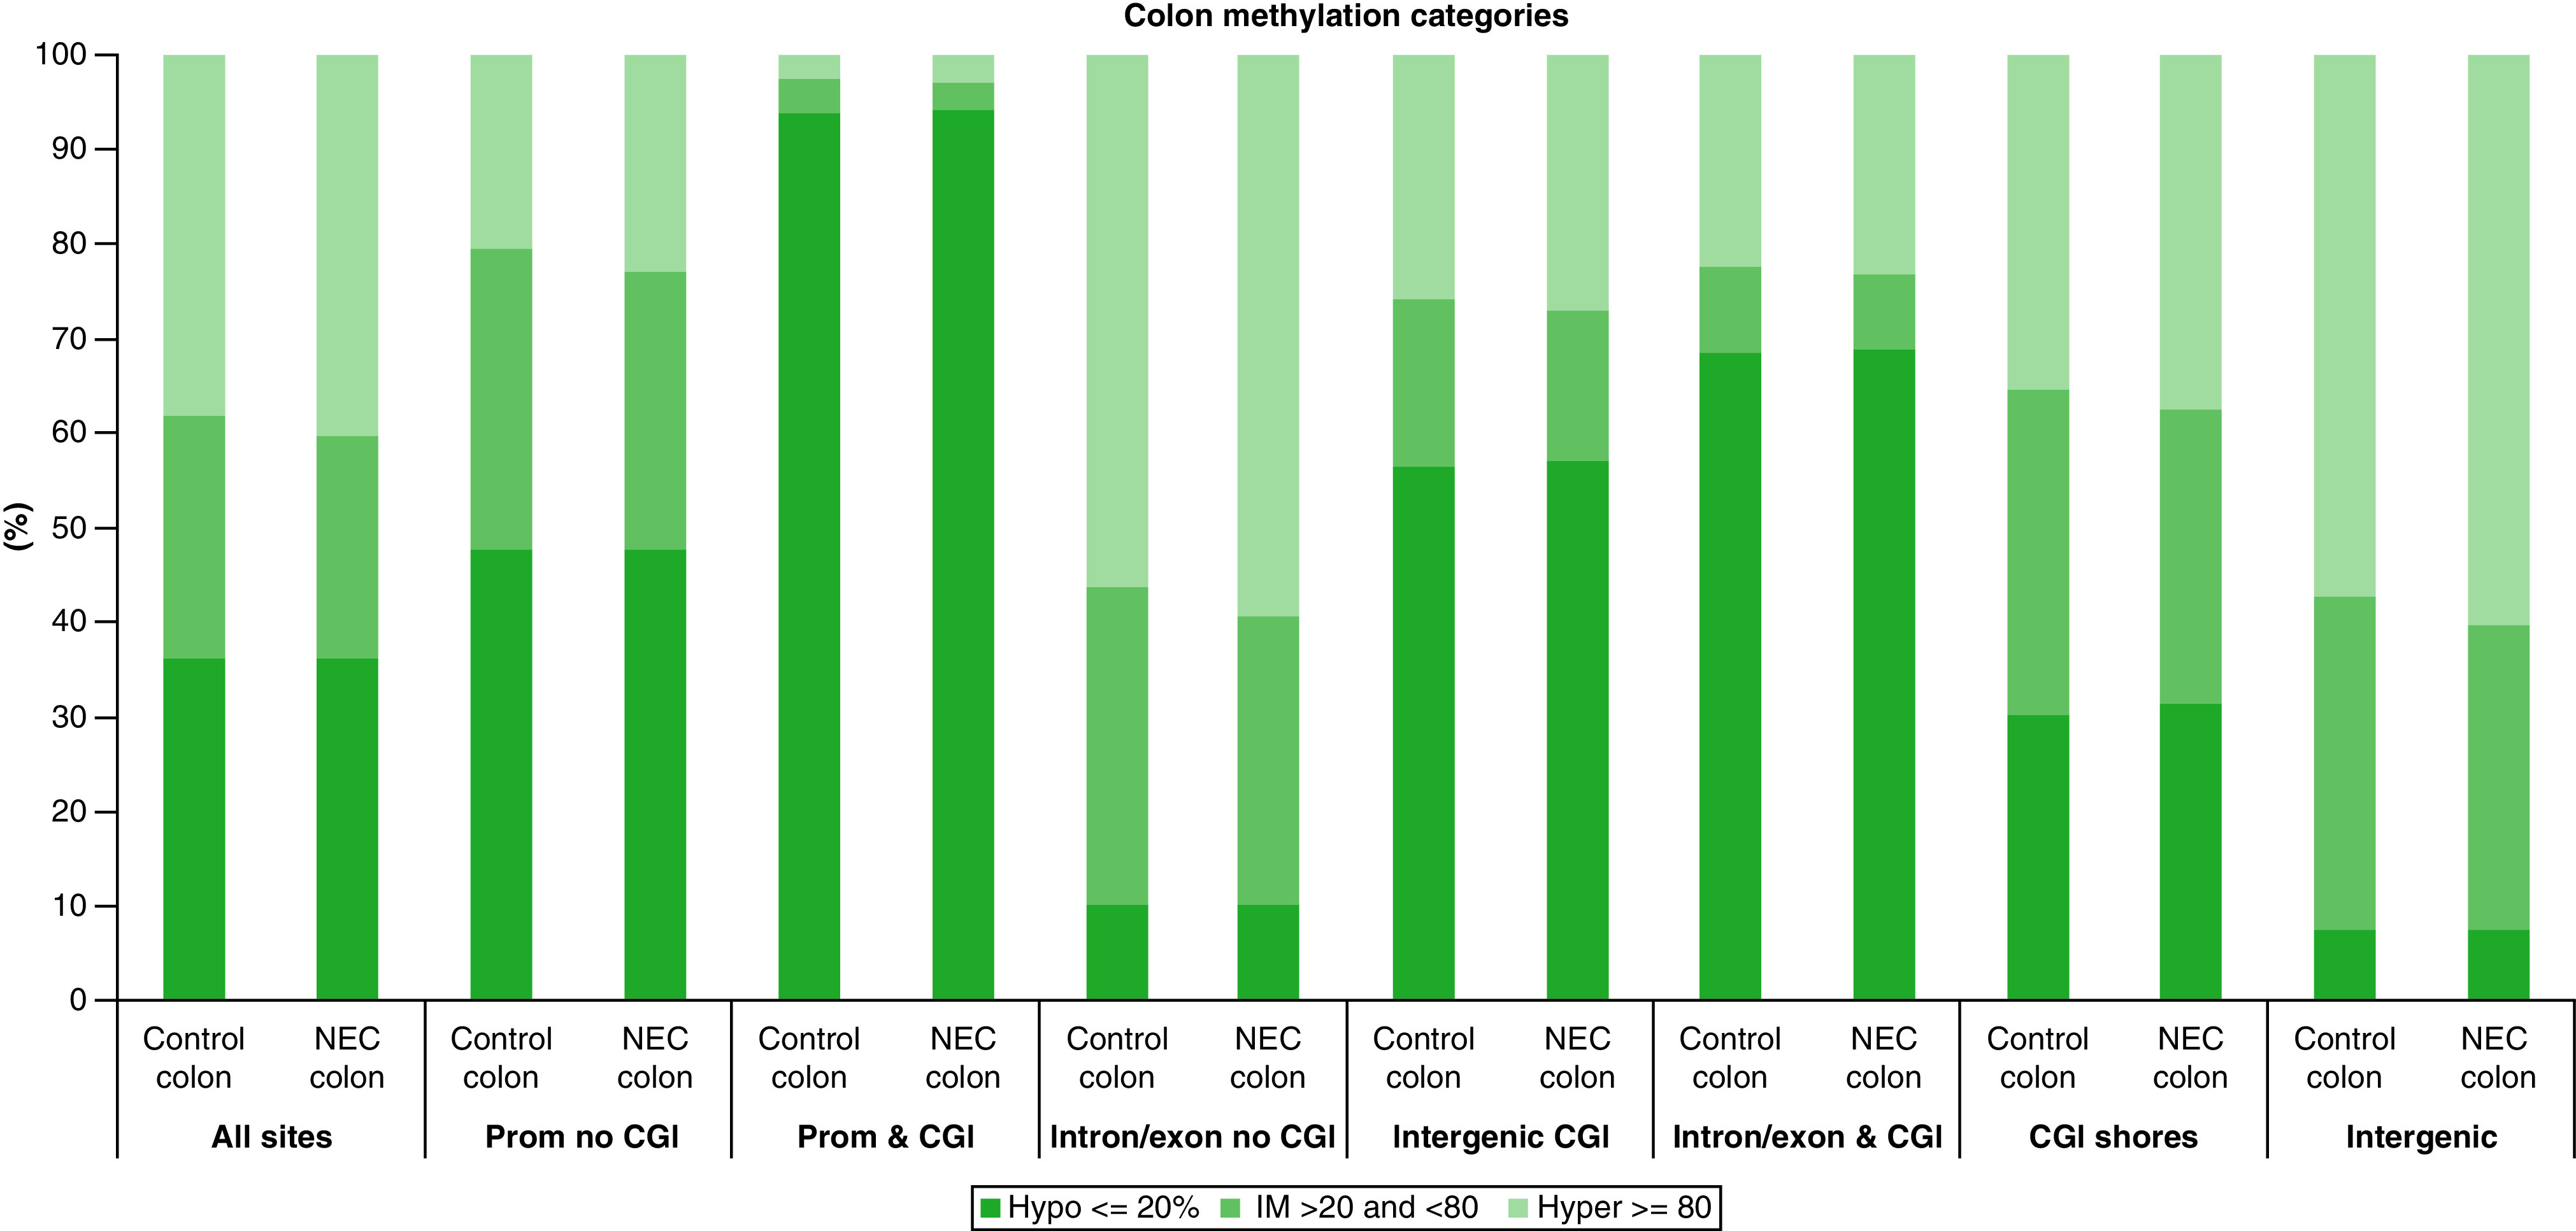
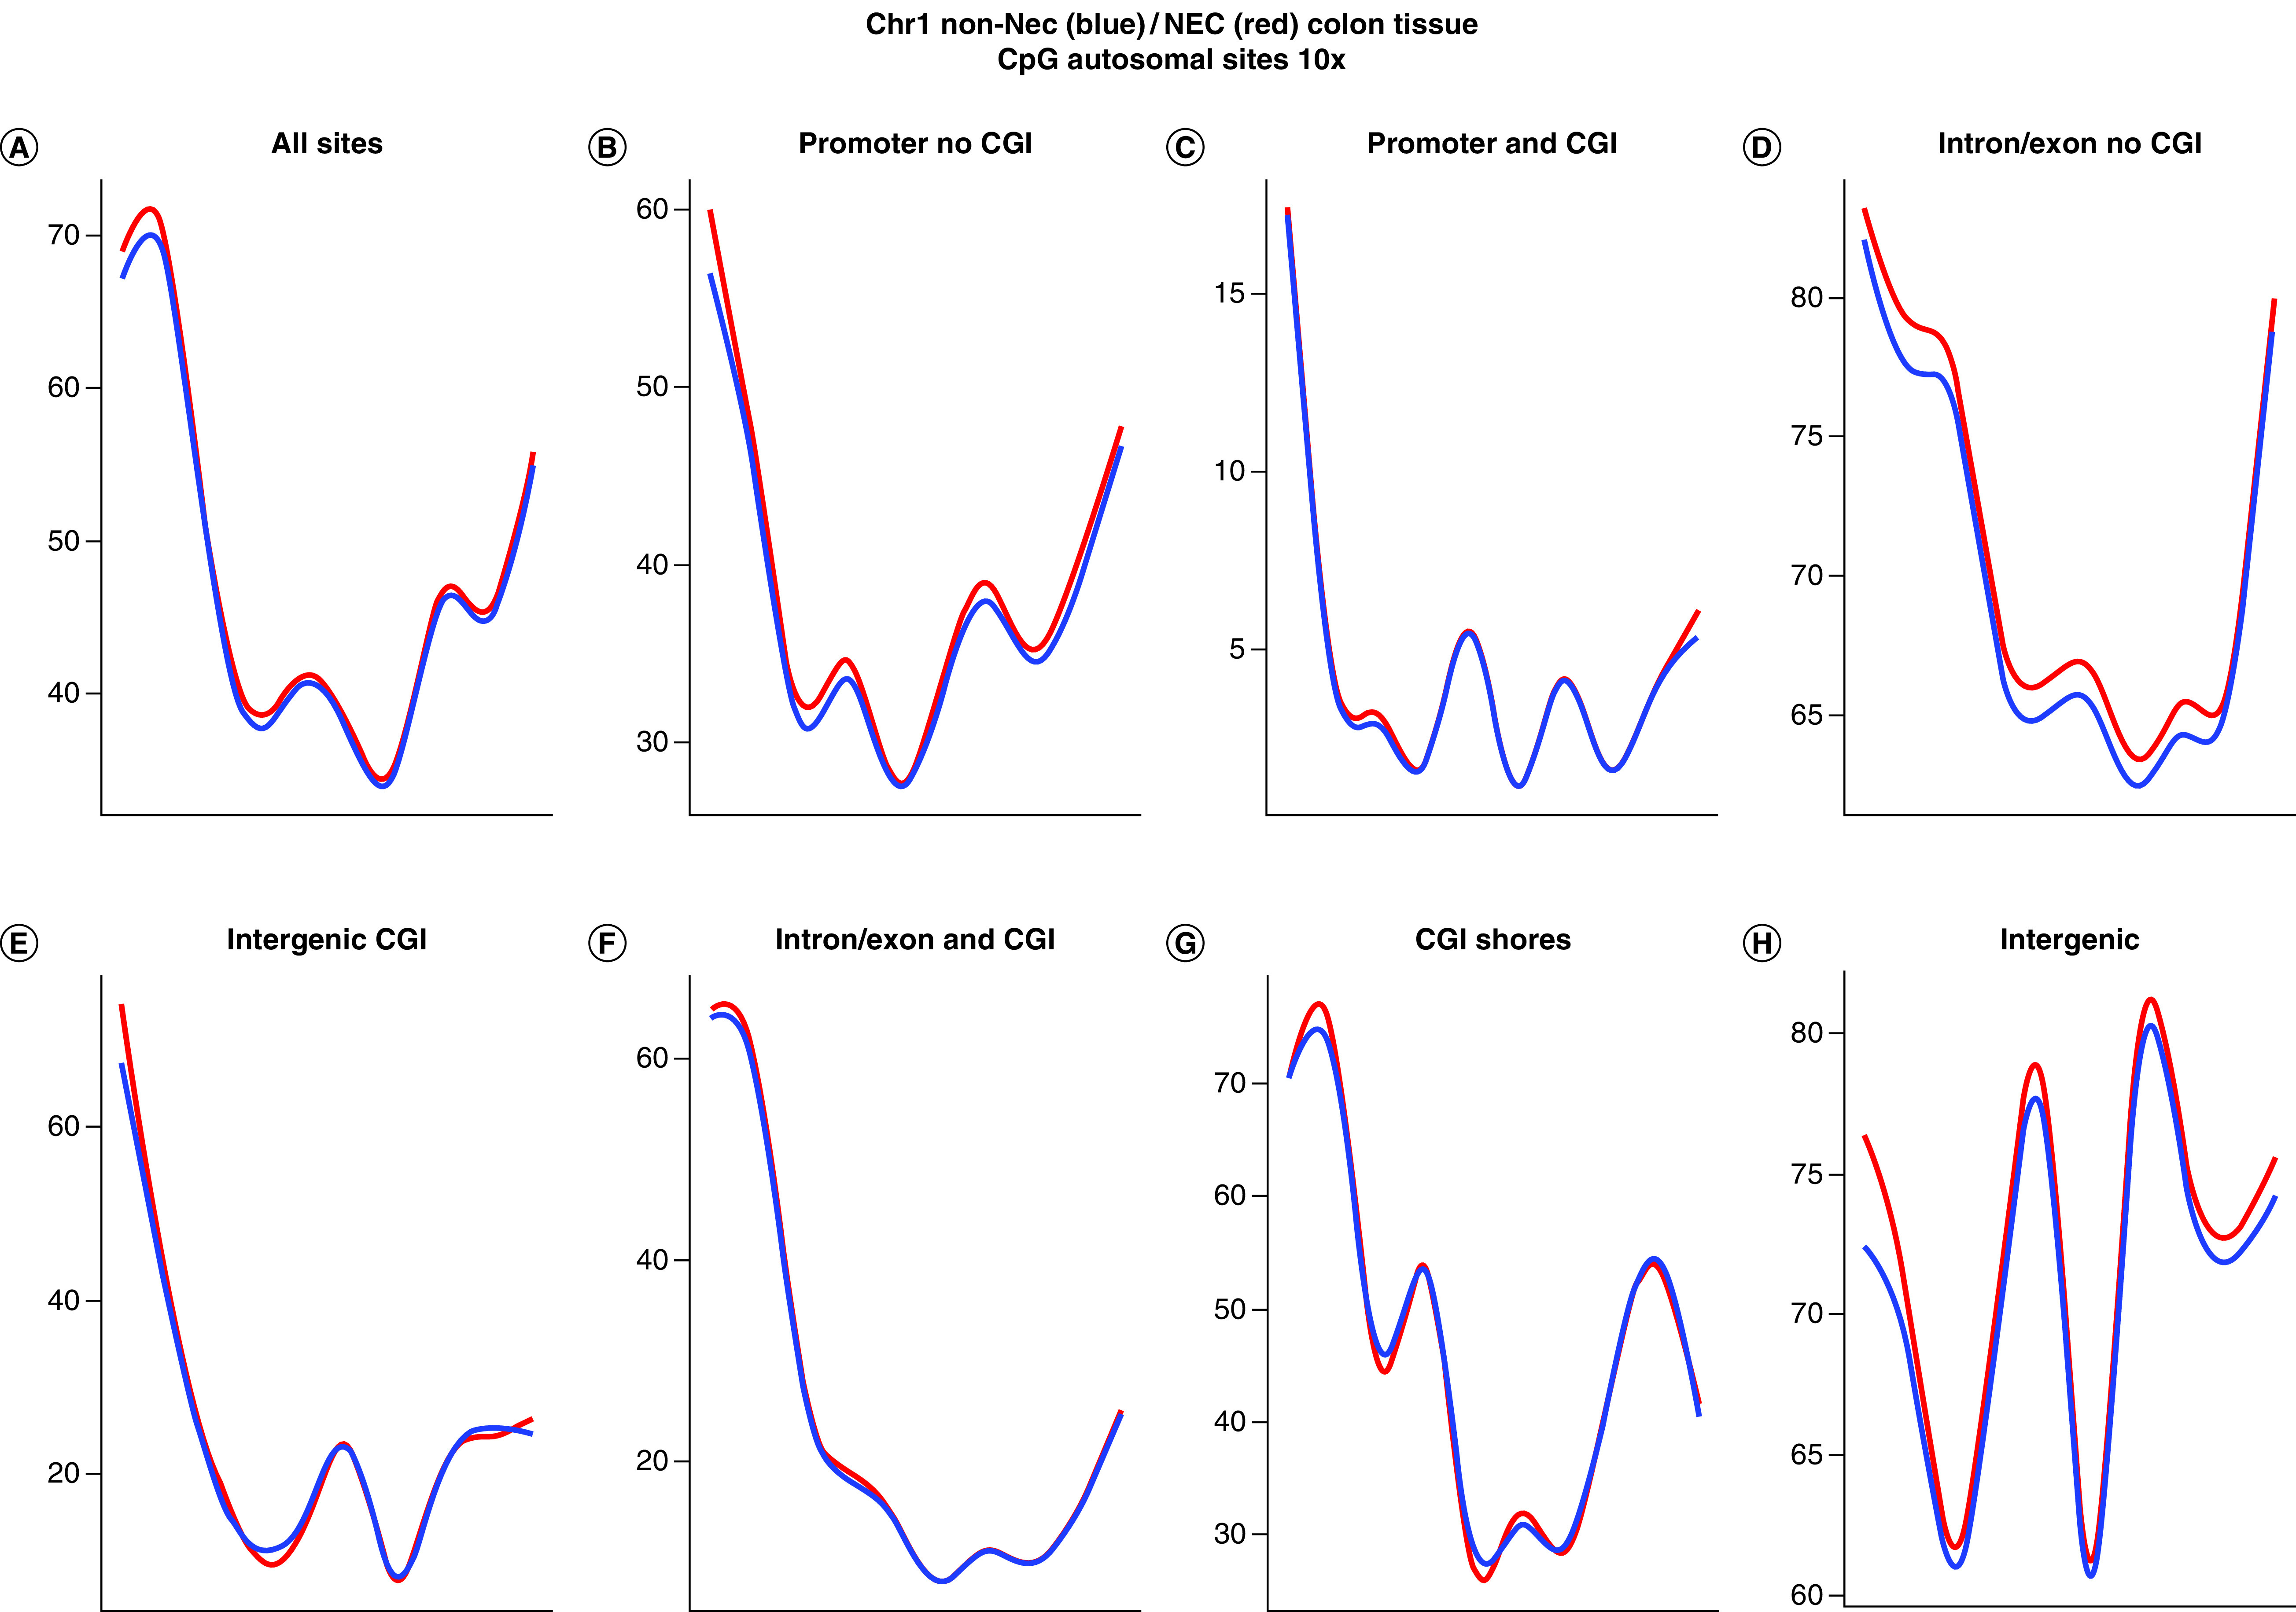
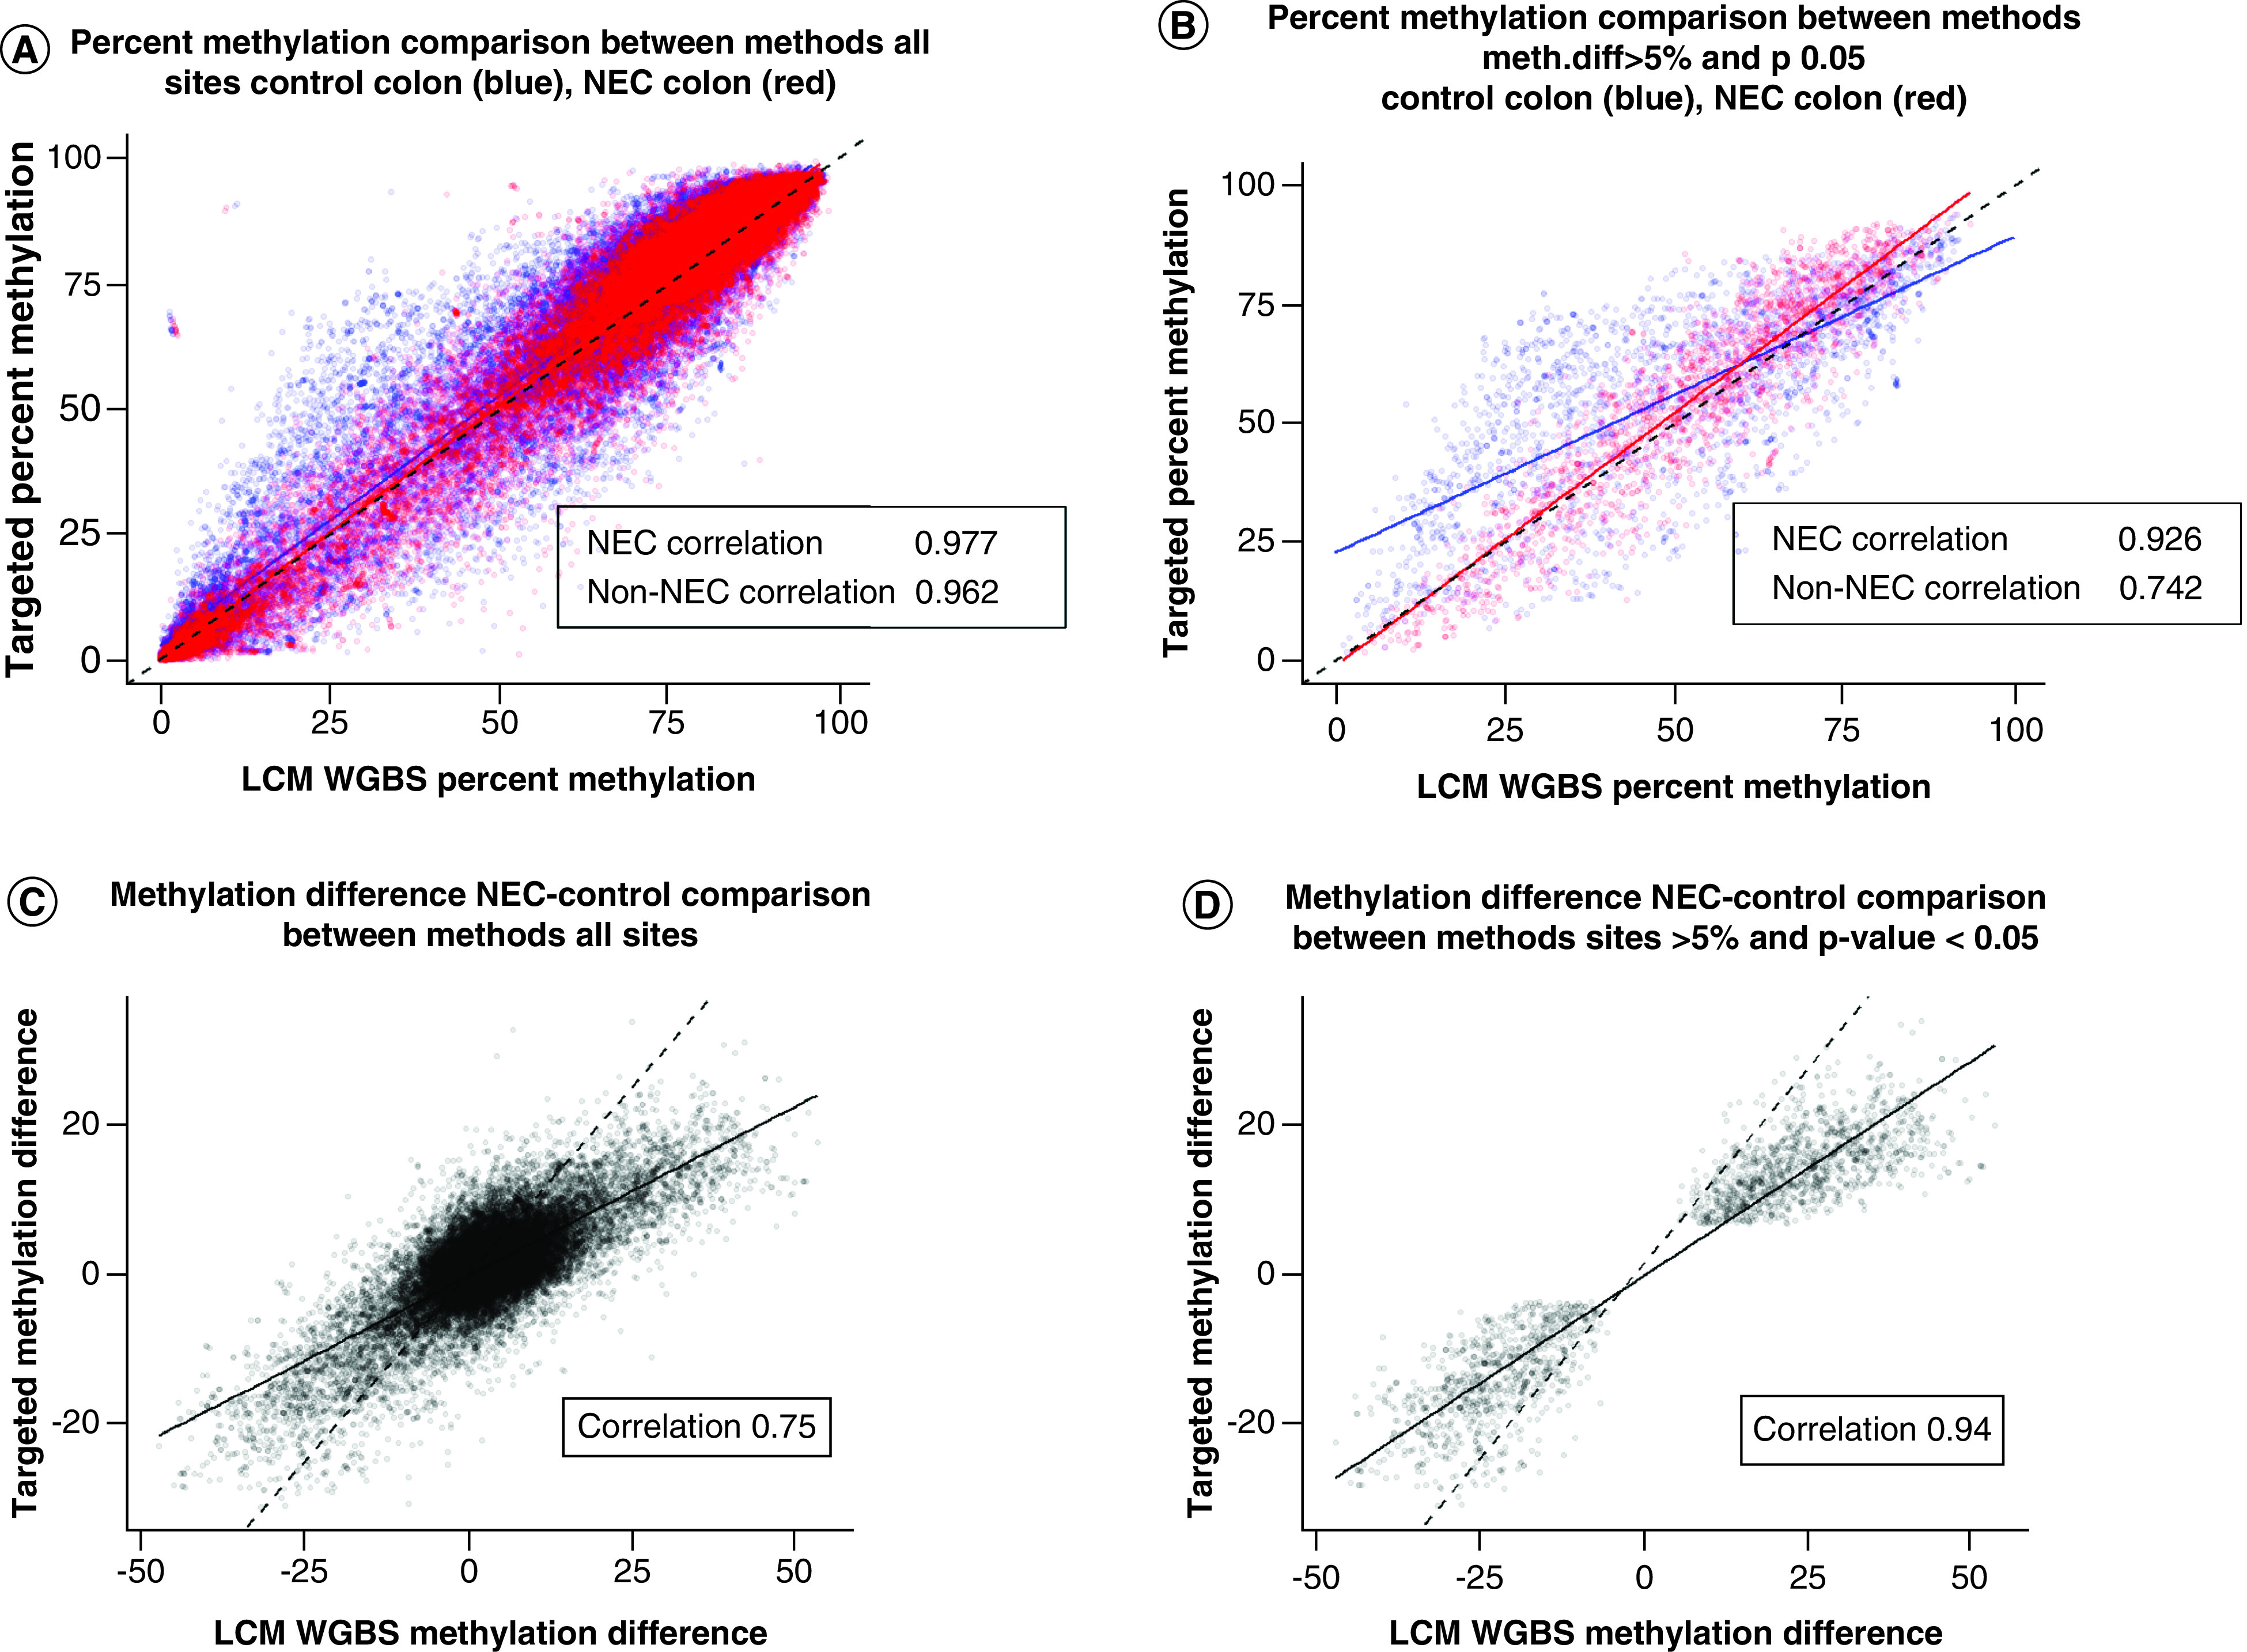
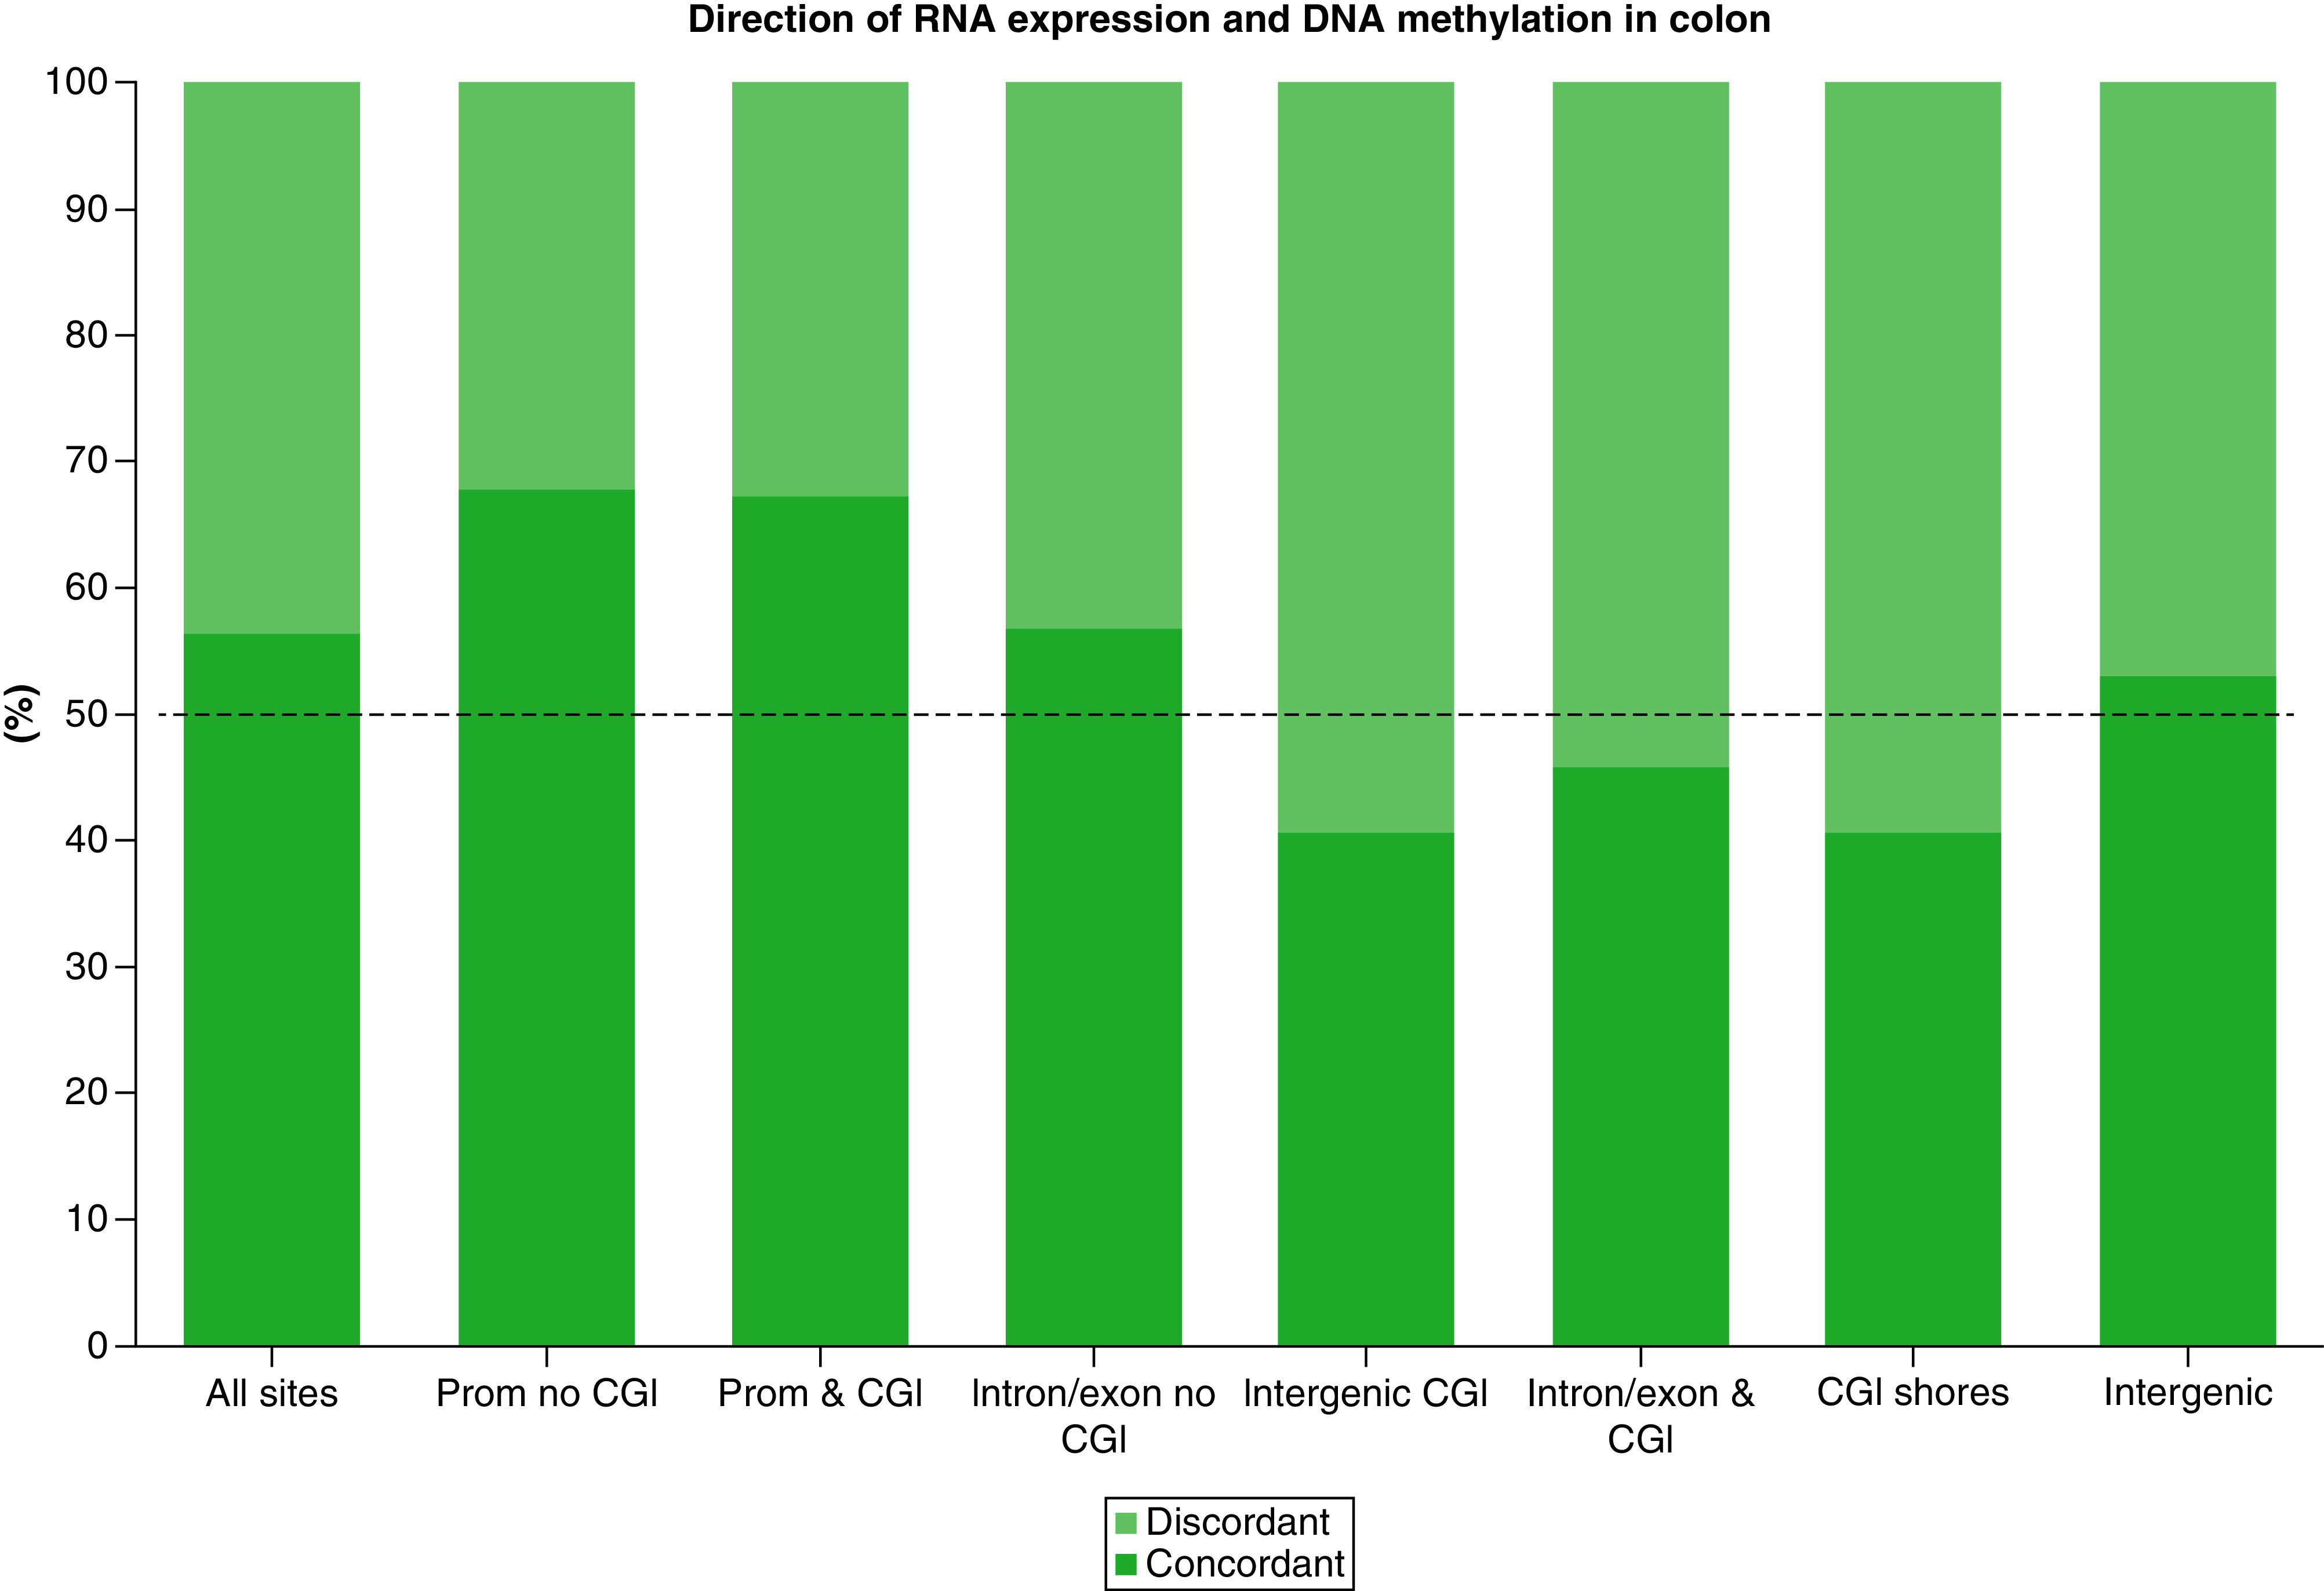
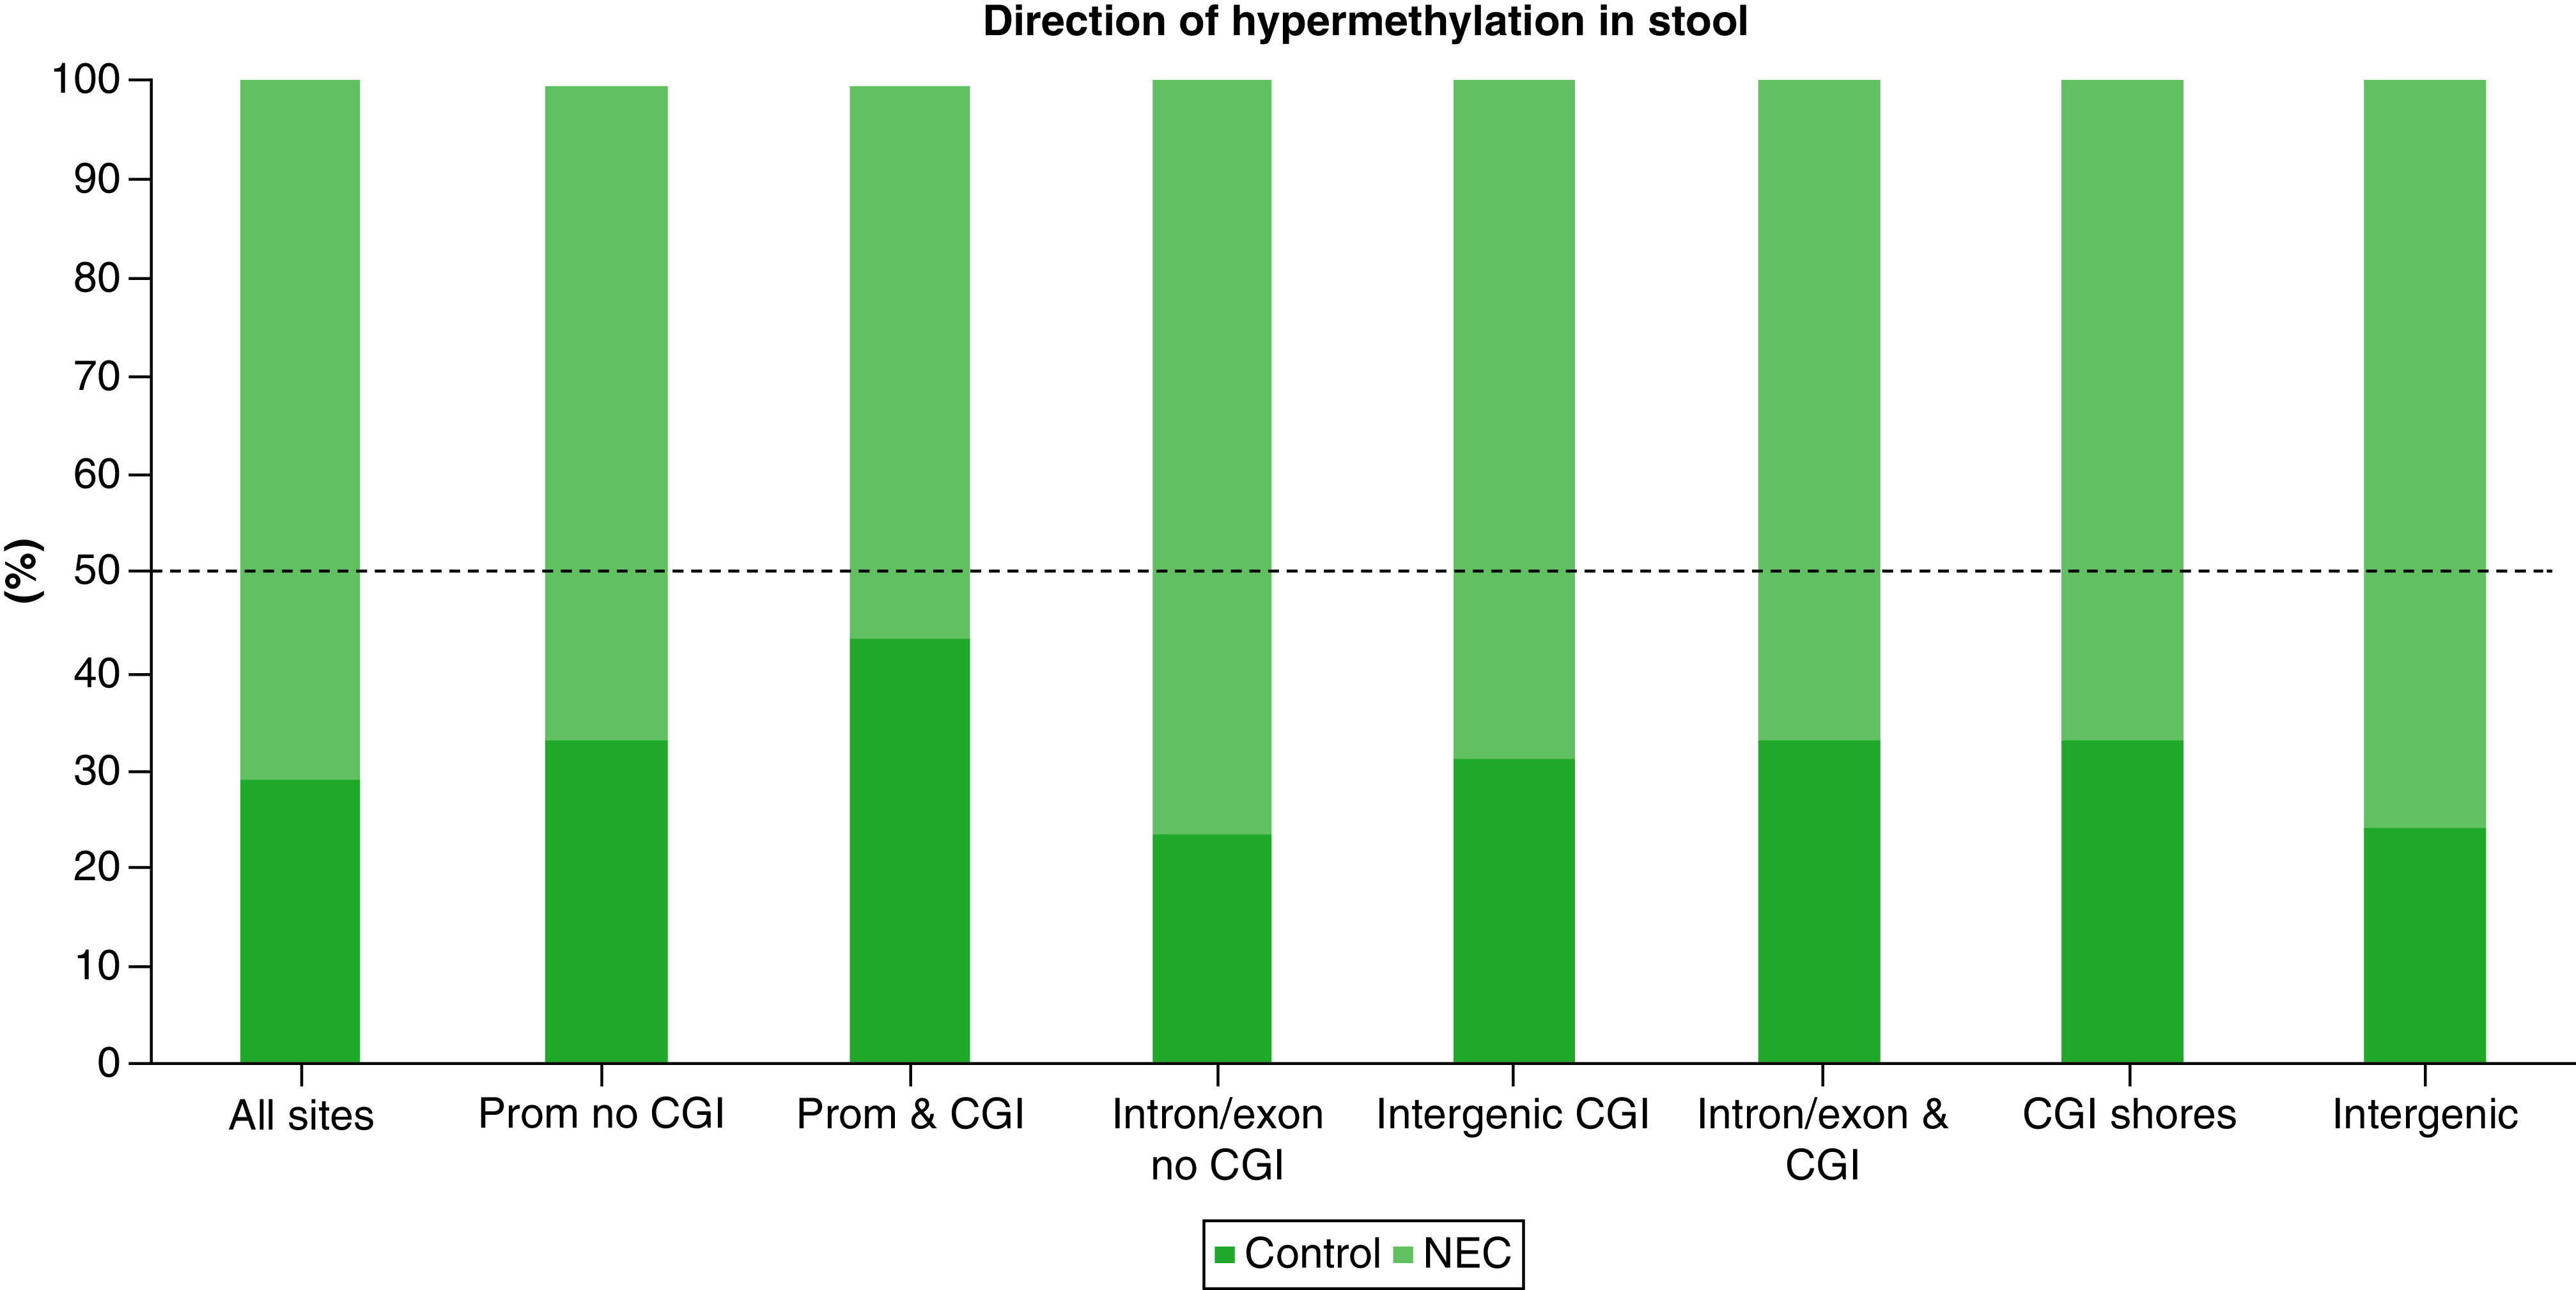
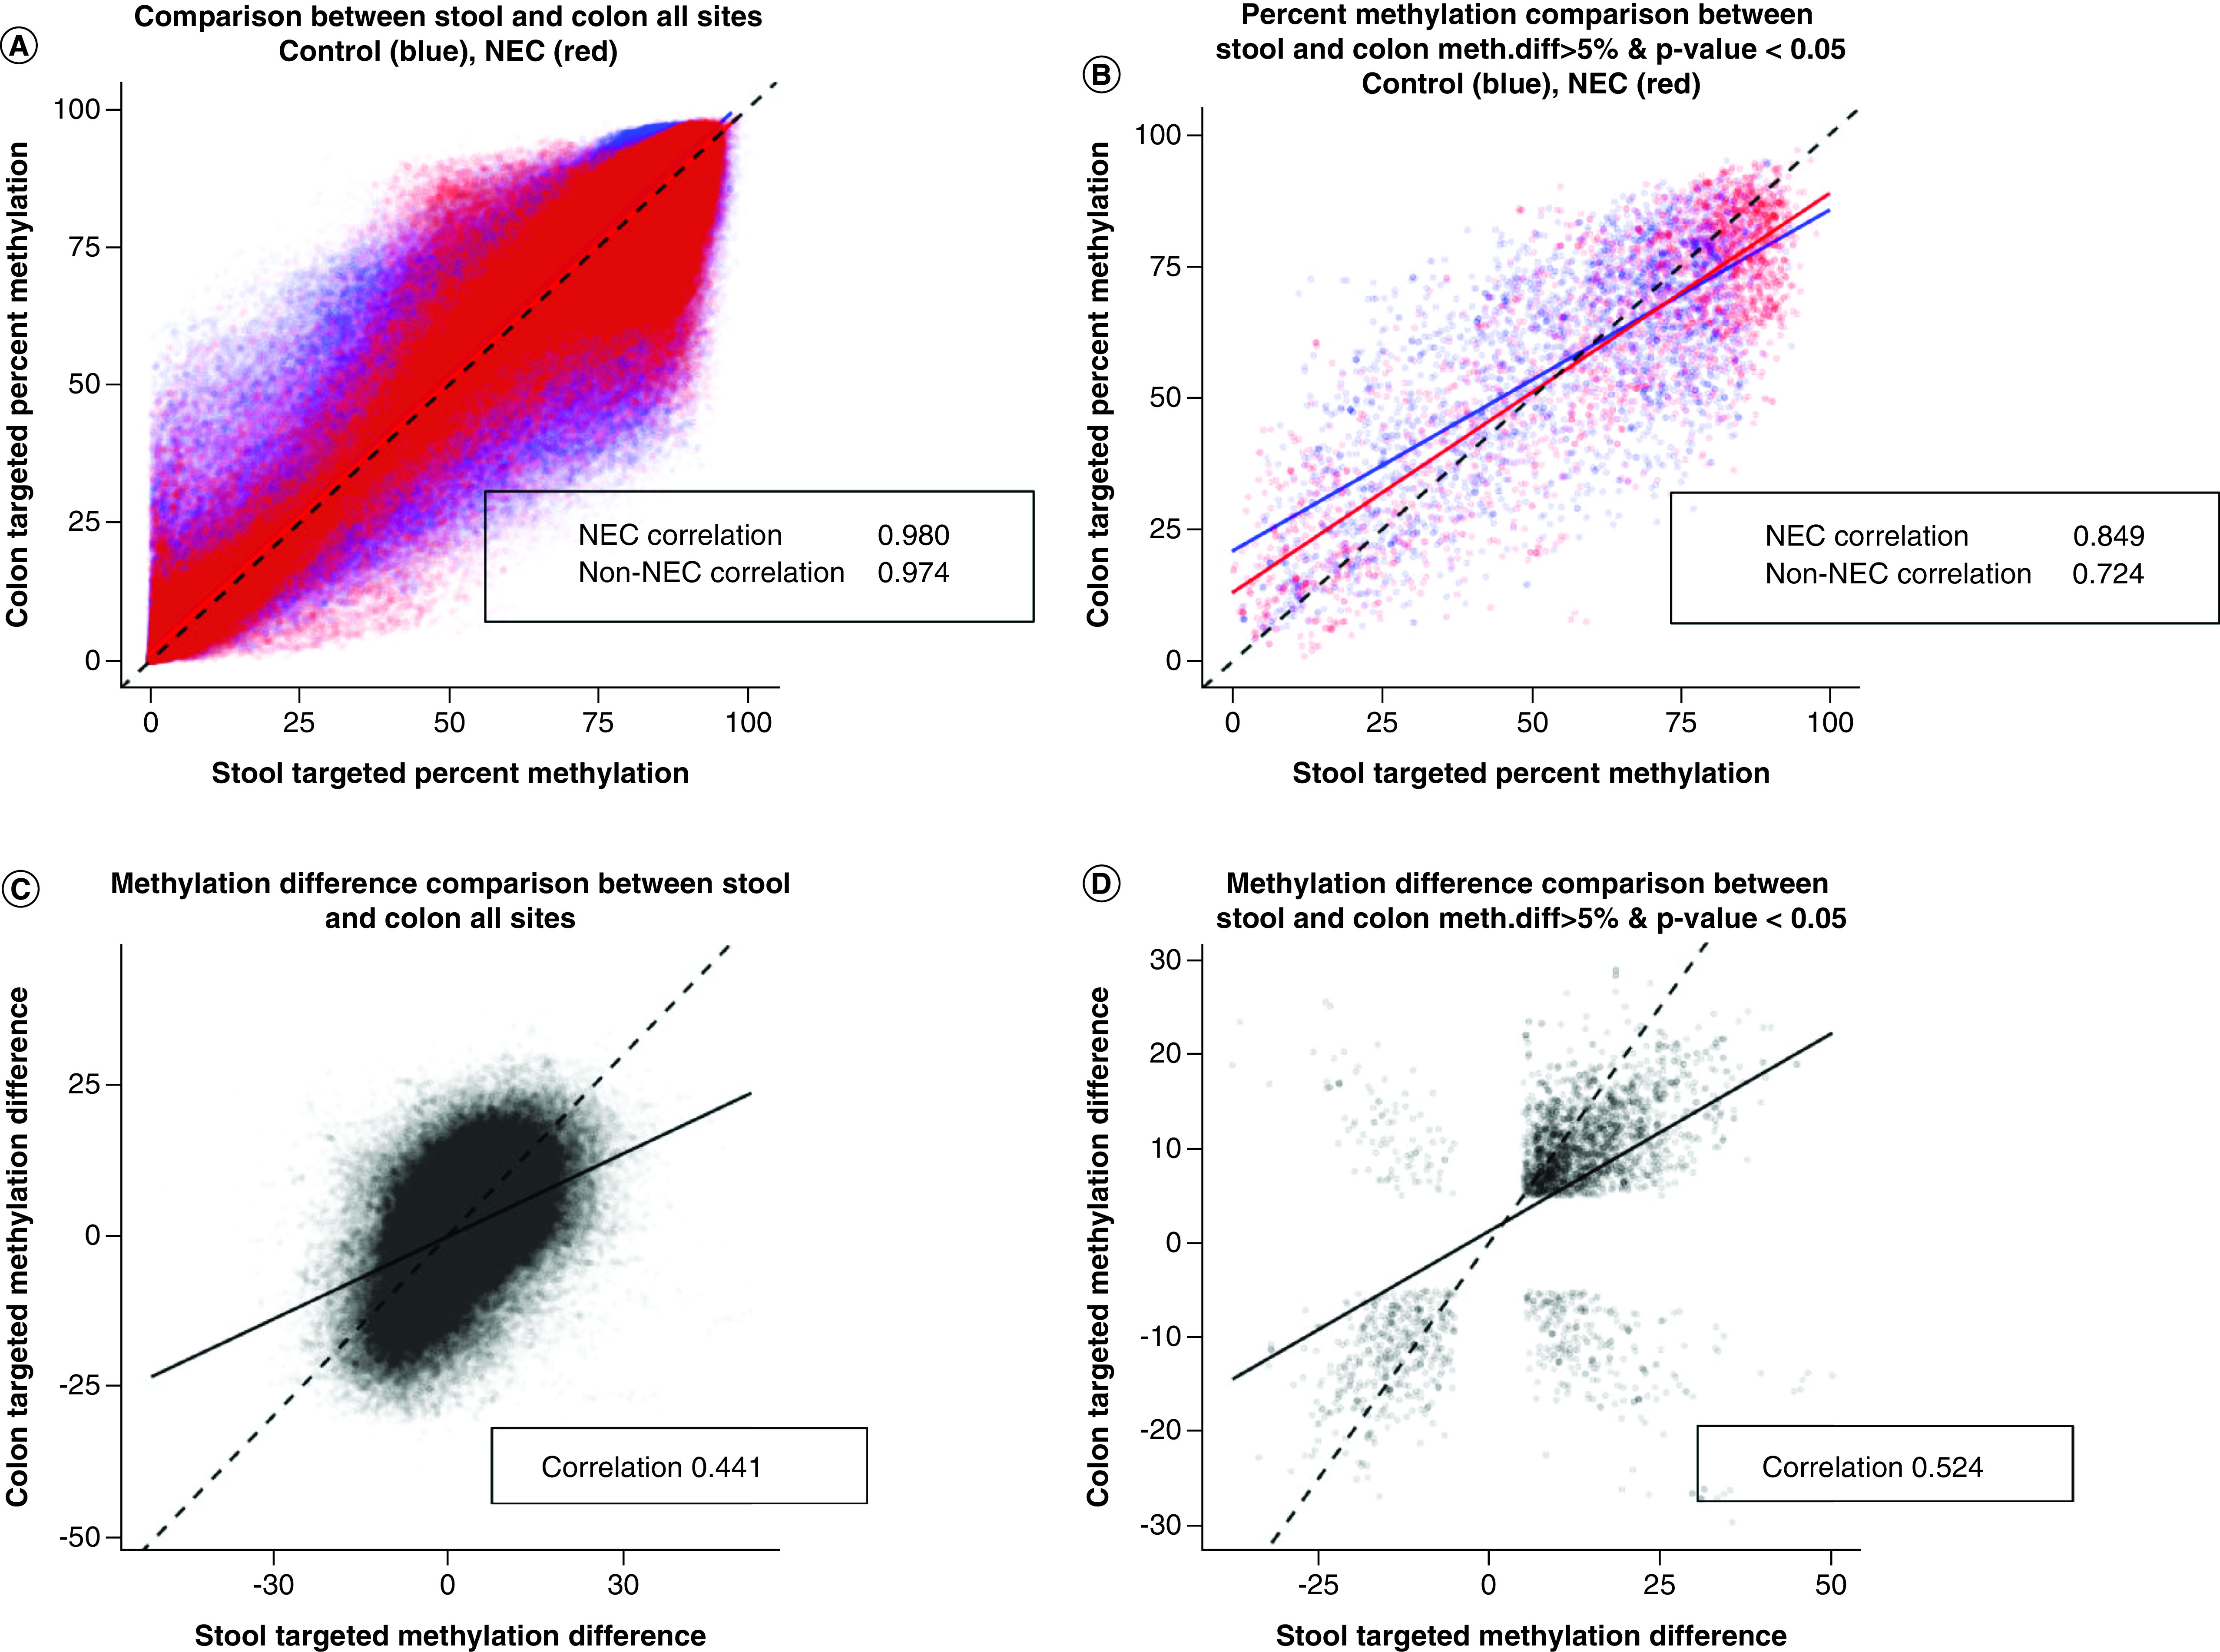
Aim: Neonatal necrotizing enterocolitis (NEC) is a deadly and unpredictable gastrointestinal disease, for which no biomarker exists. We aimed to describe the methylation patterns in stool and colon from infants with NEC. Methods: We performed a high-resolution genome-wide epigenomic analysis using solution-phase hybridization and next-generation sequencing of bisulfite-converted DNA. Results: Our data reveal significant genomic hypermethylation in NEC tissues compared with non-NEC controls. These changes were more pronounced in regions outside CpG islands and gene regulatory elements, suggesting that NEC-specific hypermethylation is not a nonspecific global phenomenon. Conclusions: This study provides evidence of a methylomic signature associated with NEC that is detectable noninvasively and provides a new opportunity for the development of a novel diagnostic method for NEC.

Keywords: DNA methylation; biomarker; colon; epigenetics; intestine; methylome; necrotizing enterocolitis; neonatal; prematurity; stool.


Conflict of interest statement

Financial & competing interests disclosure

M Good was supported by K08DK101608, R03DK111473, R01DK118568 and Pediatric Loan Repayment Program from the NIH, March of Dimes Foundation grant no. 5-FY17-79, the Children’s Discovery Institute of Washington University in St. Louis, the St. Louis Children’s Hospital Foundation and the Department of Pediatrics at Washington University School of Medicine. L Nolan was supported by 5T32HD043010 from the NIH. D Peters was supported by grants from the Pittsburgh Health Data Alliance (PHDA) and the Magee-Women’s Research Institute. The funding sources played no role in any part of the study. M Good has received sponsored research agreement funding from Astarte Medical Partners, Takeda Pharmaceuticals and Evive Biotech, Inc. The funding sources played no role in any part of the study. The authors have no other relevant affiliations or financial involvement with any organization or entity with a financial interest in or financial conflict with the subject matter or materials discussed in the manuscript apart from those disclosed.

No writing assistance was utilized in the production of this manuscript.

Figures

Figure 1.
Figure 1.. Differential methylation in colonic neonatal necrotizing enterocolitis.
(A) Multidimensional scaling (Euclidian) analysis of NEC (blue) and non-NEC (green) colon samples. (B) Proportion of CpG sites in different genomic elements that were hypermethylated in NEC versus hypermethylated in non-NEC control in colon. The dotted line represents a 50% ratio of hypermethylated sites in either type of tissue in a given genomic element. CGI: CpG island; NEC: Neonatal necrotizing enterocolitis.
Figure 2.
Figure 2.. Distribution of methylation of normal control (blue) versus neonatal necrotizing enterocolitis (red) colon by genomic element.
(A) All sites. (B) Promoter regions excluding CpG Islands (CGI). (C) Promoter regions including CGI (D) Introns/Exons excluding CGI. (E) Intergenic CGI. (F) Intron/Exon with CGI. (G) CGI shores. (H) Intergenic regions.
Figure 3.
Figure 3.. Comparison methylation category distribution of non-neonatal necrotizing enterocolitis and neonatal necrotizing enterocolitis colon by genomic element.
CpG sites could be grouped into low methylation (LM, <20%), intermediate methylation (IM, 20–80%) or high methylation (HM, >80%) categories. CGI: CpG island; IM: Intermediate methylation; NEC: Neonatal necrotizing enterocolitis.
Figure 4.
Figure 4.. Normal control (blue) and neonatal necrotizing enterocolitis (red) colonic methylation across chromosome 1, broken down by genomic element.
(A) All sites. (B) Promoter regions excluding CpG Islands (CGI). (C) Promoter regions including CGI (D) Introns/Exons excluding CGI. (E) Intergenic CGI. (F) Intron/Exon with CGI. (G) CGI shores. (H) Intergenic regions.
Figure 5.
Figure 5.. Comparison of whole-genome bisulfite sequencing sequencing of enterocytes to a targeted colonic neonatal necrotizing enterocolitis DNA methylation approach.
(A & B) Comparison of percentage methylation of NEC (red) and non-NEC (blue) between current data from colon tissue and previously published WGBS data of laser capture microscopy of enterocytes [17]. (A) All sites shared. (B) Shared sites with a minimum absolute methylation difference of 5% or more between NEC and non-NEC and p < 0.05 in both methods. (C & D) Comparison of methylation difference (NEC minus non-NEC) between colon tissue and WGBS of LCM enterocytes. (C) All sites shared. (D) Shared sites with a minimum absolute methylation difference of 5% or more between NEC and non-NEC and p < 0.05 in both methods. LCM: Laser capture microdissection; NEC: Neonatal necrotizing enterocolitis; WGBS: Whole-genome bisulfite sequencing.
Figure 6.
Figure 6.. Relationship between RNA expression and DNA methylation by genomic element.
Sites were considered concordant when NEC colon samples were hypermethylated and gene expression was lower in NEC samples and vice versa. Sites were considered discordant when NEC samples were hypomethylated and gene expression was higher in NEC samples and vice versa. CGI: CpG island; NEC: Neonatal necrotizing enterocolitis.
Figure 7.
Figure 7.. Putative regulatory associations for 25 POU5F1 target genes that were differentially methylated and differentially expressed in neonatal necrotizing enterocolitis versus normal colon.
Figure 8.
Figure 8.. Proportion of CpG sites in different genomic elements that were hypermethylated or hypomethylated in neonatal necrotizing enterocolitis versus normal control stool.
The dotted line represents a 50% ratio of hypermethylated to hypomethylated sites in a given genomic element. CGI: CpG island; NEC: Neonatal necrotizing enterocolitis.
Figure 9.
Figure 9.. Comparison of DNA methylation in neonatal necrotizing enterocolitis tissue and stool.
(A & B) Comparison of percentage methylation between NEC (red) and non-NEC/control (blue) between colon tissue and stool. (A) All sites shared. (B) Shared sites with a minimum absolute methylation difference of 5% or more between NEC and non-NEC and p < 0.05 in both methods. (C & D) Comparison of methylation difference (NEC vs non-NEC/control) between colon tissue and stool. (C) All sites shared. (D) Shared sites with a minimum absolute methylation difference of 5% or more between NEC and non-NEC and p < 0.05 in both methods. NEC: Neonatal necrotizing enterocolitis.

Similar articles

Cited by

References

    1. Patel RM, Kandefer S, Walsh MC et al. Causes and timing of death in extremely premature infants from 2000 through 2011. N. Engl. J. Med. 372(4), 331–340 (2015). - PMC - PubMed
    1. Neu J, Walker WA. Necrotizing enterocolitis. N. Engl. J. Med. 364(3), 255–264 (2011). - PMC - PubMed
    1. Bosch LJW, Melotte V, Mongera S et al. Multitarget stool DNA test performance in an average-risk colorectal cancer screening population. Am. J. Gastroenterol. 114(12), 1909–1918 (2019). - PMC - PubMed
    1. Ngo TTM, Moufarrej MN, Rasmussen M-LH et al. Noninvasive blood tests for fetal development predict gestational age and preterm delivery. Science 360(6393), 1133–1136 (2018). - PMC - PubMed
    1. Karlas T, Weise L, Kuhn S et al. Correlation of cell-free DNA plasma concentration with severity of non-alcoholic fatty liver disease. J. Transl. Med. 15(1), 106 (2017). - PMC - PubMed

Publication types