. 2021 Jun 1;131(11):e136459.
doi: 10.1172/JCI136459.

Frataxin deficiency promotes endothelial senescence in pulmonary hypertension

Affiliations

Frataxin deficiency promotes endothelial senescence in pulmonary hypertension

Miranda K Culley et al. J Clin Invest. .

Abstract

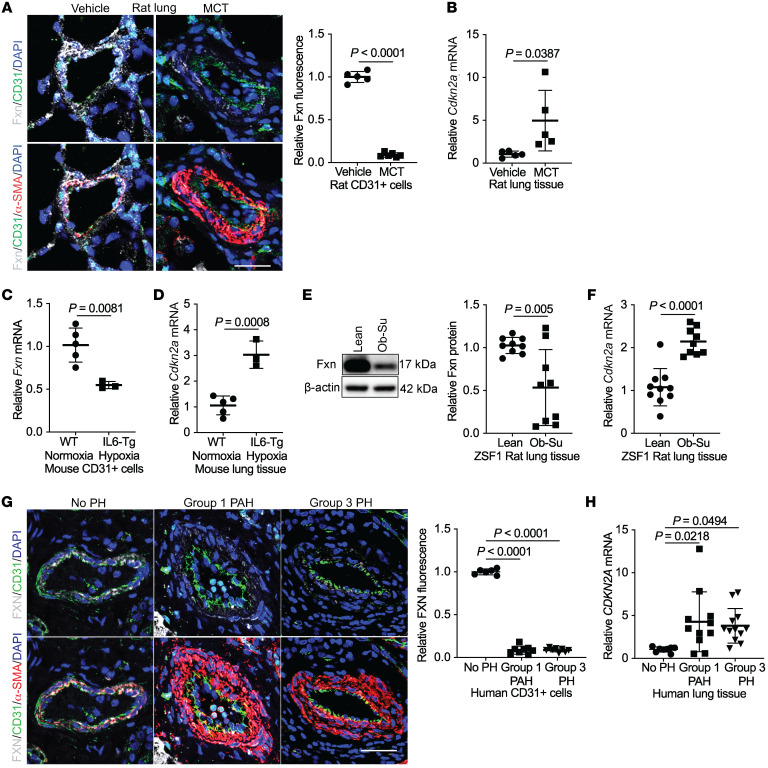
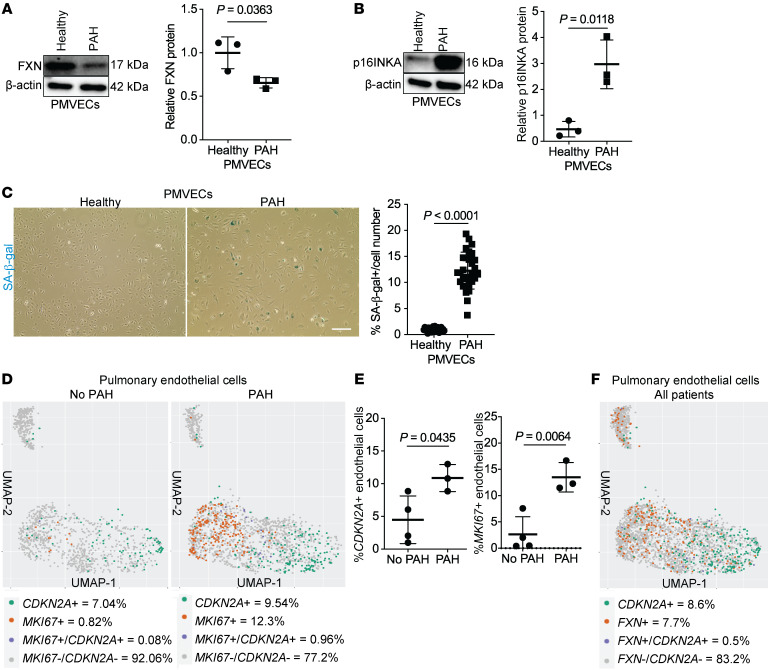
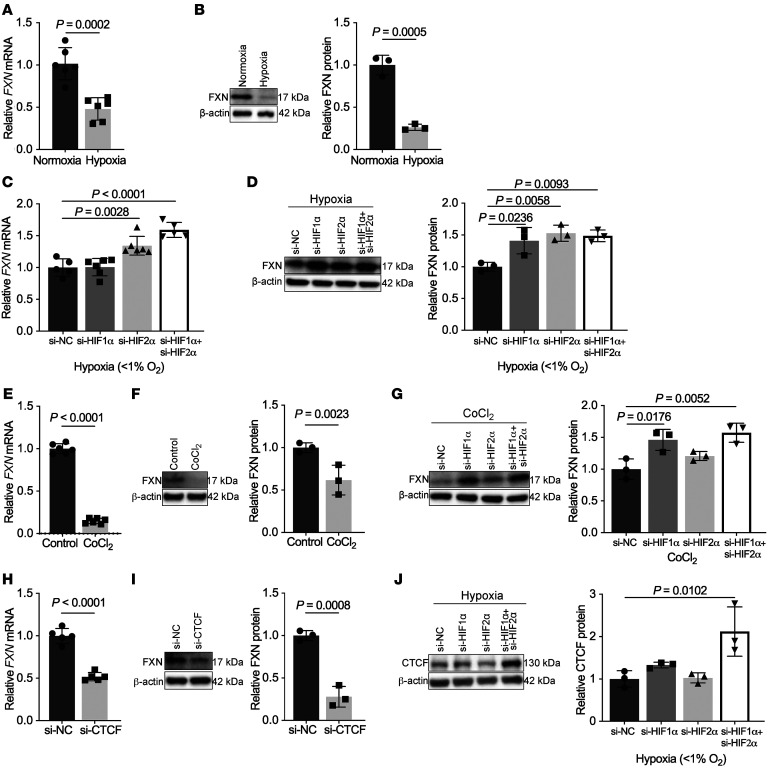
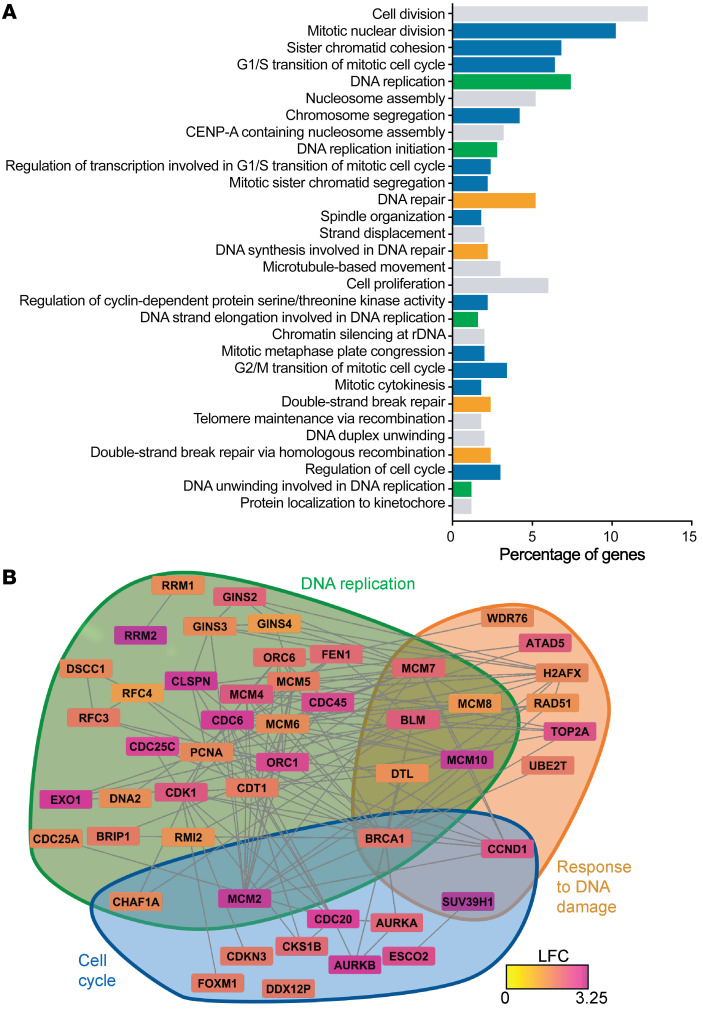
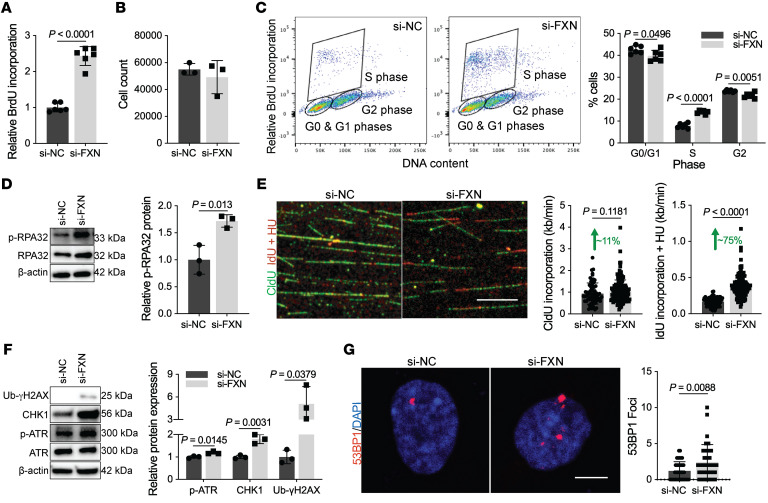
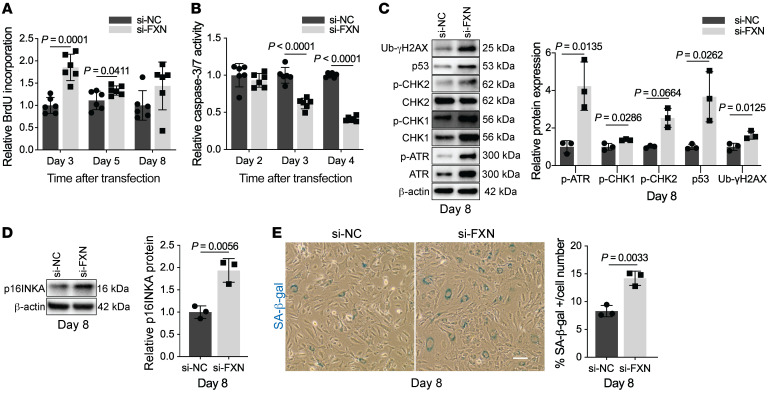
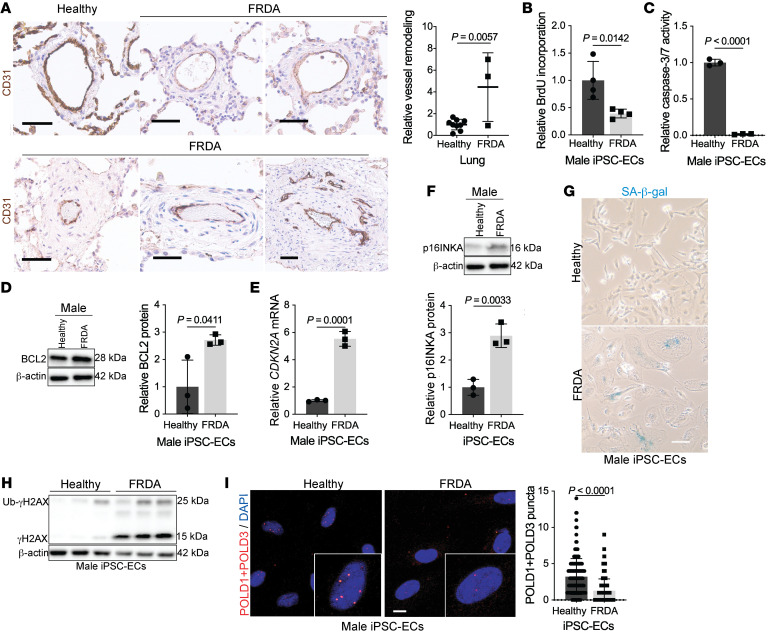
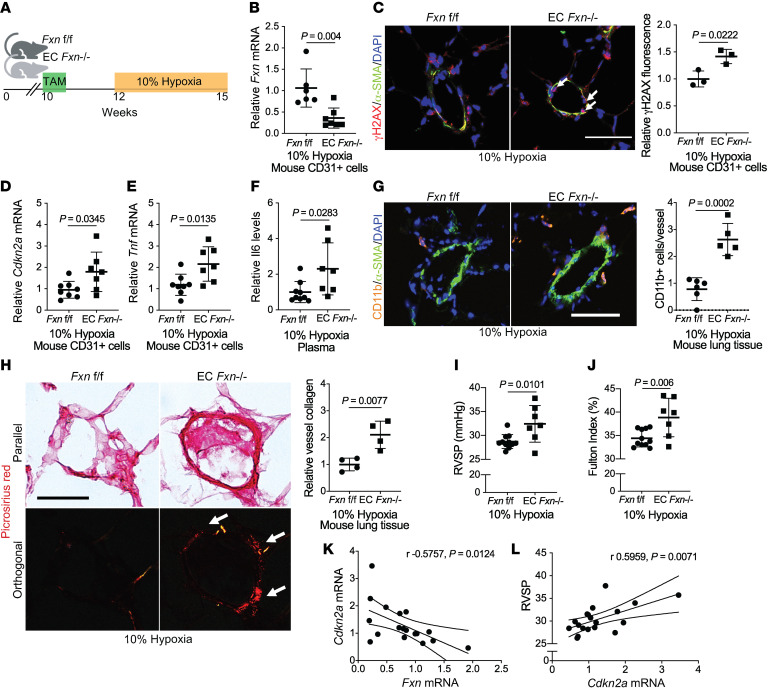
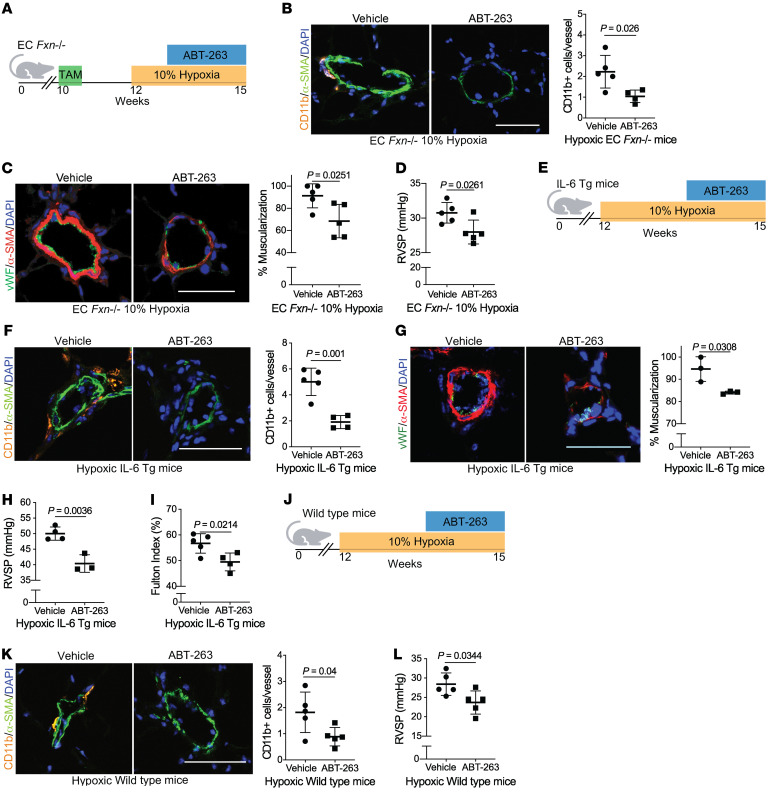
The dynamic regulation of endothelial pathophenotypes in pulmonary hypertension (PH) remains undefined. Cellular senescence is linked to PH with intracardiac shunts; however, its regulation across PH subtypes is unknown. Since endothelial deficiency of iron-sulfur (Fe-S) clusters is pathogenic in PH, we hypothesized that a Fe-S biogenesis protein, frataxin (FXN), controls endothelial senescence. An endothelial subpopulation in rodent and patient lungs across PH subtypes exhibited reduced FXN and elevated senescence. In vitro, hypoxic and inflammatory FXN deficiency abrogated activity of endothelial Fe-S-containing polymerases, promoting replication stress, DNA damage response, and senescence. This was also observed in stem cell-derived endothelial cells from Friedreich's ataxia (FRDA), a genetic disease of FXN deficiency, ataxia, and cardiomyopathy, often with PH. In vivo, FXN deficiency-dependent senescence drove vessel inflammation, remodeling, and PH, whereas pharmacologic removal of senescent cells in Fxn-deficient rodents ameliorated PH. These data offer a model of endothelial biology in PH, where FXN deficiency generates a senescent endothelial subpopulation, promoting vascular inflammatory and proliferative signals in other cells to drive disease. These findings also establish an endothelial etiology for PH in FRDA and left heart disease and support therapeutic development of senolytic drugs, reversing effects of Fe-S deficiency across PH subtypes.

Keywords: Cardiovascular disease; Endothelial cells; Hypertension; Pulmonology; Vascular Biology.


Conflict of interest statement

Conflict of interest: SYC has served as a consultant for United Therapeutics. SYC is a director, officer, and shareholder in Synhale Therapeutics. SYC has held grants from Actelion and Pfizer. SYC and TB have filed patent applications regarding metabolism in pulmonary hypertension (US 10,925,869 B2, “Compositions and methods for treating pulmonary vascular disease” and WO 2015/171641 A1, “Coordinate control of pathogenic signaling by the MIR-130-301 family in pulmonary hypertension and fibroproliferative diseases”).

Figures

Figure 1
Figure 1. Reduced FXN and elevated CDKN2A expression in Group 1, 2, and 3 PH lungs.
(A) Representative images of lungs stained with immunofluorescent probes for Fxn (gray), CD31 (green), α-SMA (red), counterstained with DAPI (blue), and imaged by confocal microscopy. Scale bar: 50 μm. Quantification of Fxn colocalized within the CD31+ endothelium in rats treated with monocrotaline (MCT) (n = 6) or vehicle (n = 5). (B) Relative Cdkn2a expression by RT-qPCR in lung tissue from MCT-treated rats compared with vehicle control (n = 5/group). (C) Fxn mRNA expression in isolated CD31+ cells and (D) whole-lung CDKN2A mRNA levels in hypoxic interleukin-6 transgenic (IL6-Tg) (n = 3) versus normoxic WT mice (n = 5). (E) Fxn protein and (F) Cdkn2a transcript expression in lung tissue from ZSF1 obese rats treated with Sugen (SU5416) (Ob-Su) (n = 9) versus lean controls (n = 9–10). (G) Representative confocal images showing FXN (gray), CD31 (green), α-SMA (red), and counterstained with DAPI (blue). Scale bar: 50 μm. Quantification of FXN in the CD31+ endothelium of Group 1 PAH (n = 8) or Group 3 PH (n = 8) patient lungs compared with controls (No PH) (n = 6). (H) RT-qPCR of CDKN2A mRNA levels in lung tissue of patient without PH (n = 8), Group 1 (n = 11), or Group 3 PH (n = 12). Two-tailed Student’s t test (AF) and 1-way ANOVA and Tukey’s post hoc analysis (G and H) with error bars that reflect mean ± SD.
Figure 2
Figure 2. A subpopulation of FXN-deficient senescent cells in the endothelium of patients with PAH.
(A and B) Immunoblot of FXN and p16INKA levels in cultured pulmonary microvascular endothelial cells (PMVECs) from a healthy patient versus a Group 1 patient with PAH (n = 3/group). (C) Representative brightfield images (scale bar: 400 μm) and quantification of the percentage of SA-β-gal–positive PMVECs (blue) from a healthy patient versus a Group 1 patient with PAH. (D) From single-cell RNA sequencing of lungs from Group 1 patients with PAH (n = 3) versus no PAH control (n = 4), aggregate UMAP plots were generated of all endothelial cells in each cohort. Single-positive (CDKN2A, green or MKI67, orange), double-positive (blue), and double-negative (gray) endothelial cells are marked, along with total percentages across the aggregate cohort populations. (E) Percentages of CDKN2A-positive and MKI67-positive endothelial cells in each individual patient were compared between cohorts (PAH vs. no PAH). (F) Aggregate UMAP plot of pulmonary endothelial cells across all sampled patients (n = 7), demonstrating the percentage of single-positive (CDKN2A-expressing, green or high FXN-expressing, orange), double-positive (CDKN2A-expressing and high FXN expressing, blue), and double-negative (CDKN2A-expressing and non–high FXN expressing, gray) cells. Two-tailed Student’s t test with error bars that reflect mean ± SD.
Figure 3
Figure 3. Hypoxia downregulates FXN expression via a HIF-α/CTCF axis in pulmonary artery endothelial cells.
(A and B) RT-qPCR analysis (n = 6/group) and immunoblot with densitometry (n = 3/group) of FXN in cultured human pulmonary artery endothelial cells (PAECs) after exposure to hypoxia (≥ 24 hours, < 1% O2). (C and D) Relative FXN transcript (n = 5–6/group) and protein levels (n = 3/group) in hypoxic PAECs transfected with HIF-1α, HIF-2α, or combined isoform-specific siRNAs compared with negative control (NC). (E and F) FXN expression analysis in PAECs treated with the HIF-1α activator cobalt(II) chloride (≥ 24 hours, 750 μM CoCl2) (n = 6/group and n = 3/group). (G) Immunoblot of FXN in PAECs treated with CoCl2 and transfected with HIF-1α, HIF-2α, or both siRNAs, compared with negative control (n = 3/group). (H and I) RT-qPCR (n = 5/group) and immunoblot (n = 3/group) of FXN in PAECs transfected with siRNA against CTCF or negative control. (J) Immunoblot of CTCF in hypoxic PAECs transfected with HIF-1α, HIF-2α, or both siRNAs, compared with control (n = 3/group). Two-tailed Student’s t test (A, B, E, F, H, and I) and 1-way ANOVA and Tukey’s post hoc analysis (C, D, G, and J) with error bars that reflect mean ± SD.
Figure 4
Figure 4. RNA sequencing of FXN-deficient pulmonary artery endothelial cells.
(A) Long RNA sequencing in PAECs transfected with FXN siRNA versus negative control followed by GO enrichment (n = 3/group). Histogram of the top 30 most significant direct GO terms (log fold change [LFC] > 1.2, FDR < 0.05) representing the percentage of differentially expressed genes in the RNAseq data set within each pathway. GO terms specifically related to cell cycle (blue), DNA replication (green), and cellular response to DNA damage stimulus (orange) and others (gray). (B) Hypergraph of differentially expressed genes (FDR < 0.05), depicting log fold change via a color scale within GO pathways pertaining to cell cycle (blue), DNA replication (green), and cellular response to DNA damage stimulus (orange).
Figure 5
Figure 5. Acute FXN knockdown promotes replication stress and S-phase arrest.
(AG) All experiments were performed 48 hours after transfection in PAECs with or without FXN inhibition by siRNA. (A) Colorimetric BrdU incorporation (n = 6/group). (B) Manual PAEC count (n = 3/group). (C) Flow cytometric analysis of FXN-deficient or control PAECs pulsed with BrdU and the DNA marker 7-AAD (n = 6/group). (D) Immunoblot and quantification of the replication stress marker, phosphorylated RPA32 (p-RPA32) (n = 3/group). (E) Representative confocal imaging and quantification of replication rate (kb/ min) in FXN-deficient or control PAECs pulsed with CldU (20 minutes, 50 μM; green) followed by IdU (20 minutes, 250 μM; red) with hydroxyurea (2 mM; HU) (n = 175 versus n = 204 forks). Scale bar: 10 μm. (F) Quantified immunoblot of DNA damage response markers (p-ATR, CHK1, Ub-γH2AX) (n = 3/group). (G) Immunofluorescence staining and confocal microscopy of nuclear 53BP1 foci (red) within DAPI-stained nuclei (blue) (n = 37 versus n = 34). Scale bar: 10 μm. Two-tailed Student’s t test with error bars that reflect mean ± SD.
Figure 6
Figure 6. Endothelial progression toward cellular senescence due to chronic FXN deficiency.
(A) Colorimetric BrdU incorporation in FXN-deficient PAECs compared with negative control at 3, 5, and 8 days after transfection (n = 6/group). (B) Chemiluminescent measurement of caspase-3/7 activity in FXN-deficient PAECs compared with controls at 2, 3, and 4 days after transfection (n = 6/group). (CE) Experiments reflect PAECs 8 days after transfection with FXN siRNA or negative control (n = 3/group). (C) Quantification of DNA damage response markers (p-ATR, p-CHK1, p-CHK2, p53, Ub-γH2AX) by immunoblot. (D) Immunoblot of p16INKA protein expression. (E) Light microscopic images of SA-β-gal staining (blue). Scale bar: 200 m. Quantification reflects average percentage of SA-β-gal–stained PAECs out of total cell number. Two-tailed Student’s t test with error bars that reflect mean ± SD.
Figure 7
Figure 7. FXN mutations in Friedreich’s ataxia are associated with pulmonary vascular disease and endothelial senescence.
(A) Lungs from age- and sex-matched FRDA (n = 3) versus healthy donors (n = 9) stained with CD31+ (brown) and hematoxylin counterstain (blue). Scale bar: 50 μm. Quantification of relative pulmonary arteriolar wall thickness in FRDA lungs in comparison to controls. Two-tailed Student’s t test with error bars that reflect weighted averages ± SD. (BI) Phenotypic experiments performed in male age-matched iPSC-ECs from healthy controls versus patients with FRDA. (B) Colorimetric BrdU incorporation assay (n = 4/group). (C) Chemiluminescent caspase-3/7 activity (n = 3/group). (D) Immunoblot quantification of apoptosis resistance BCL2 protein (n = 3/group). (E and F) Relative CDKN2A transcript and p16INKA protein expression in male FRDA iPSC-ECs compared with healthy controls (n = 3/group). (G) Representative light microscopic images of β-galactosidase (blue) in male iPSC-ECs. Scale bar: 200 μm. (H) Immunoblot of phosphorylated (γH2AX) and ubiquitinated (Ub-γH2AX) forms of H2AX in FRDA patient iPSC-ECs compared with control (n = 3/group). (I) Proximity ligation assay followed by confocal microscopy showing quantification of associated POLD1 and POLD3 subunits of DNA Pol δ in FRDA iPSC-ECs compared with healthy controls (n = 190 nuclei/group). Scale bars: 10 μm. The same β-actin blot was used as a control for panels D and K. Two-tailed Student’s t test with error bars that reflect mean ± SD.
Figure 8
Figure 8. FXN deficiency promotes endothelial senescence and worsens PH in vivo.
(A) Diagram of conditional endothelial-specific Fxn knockout mouse model. Experiments compare male Fxn flox/flox (Fxnf/f) control mice to mice expressing a tamoxifen-dependent Cdh5(PAC)-ERT2+-Cre recombinase (EC Fxn–/–) following chronic hypoxia exposure (3 weeks, 10% O2). (B) RT-qPCR of Fxn expression in CD31+ cells isolated from lungs (n = 6–7/group). (C) Confocal microscopic imaging and quantification of endothelial γH2AX (red signal represented by white arrows), α-SMA (green), and DAPI (blue) in lung tissue (n = 3/group). (D and E) Relative Cdkn2a and Tnf mRNA by RT-qPCR in CD31+ cells isolated from mouse lungs (n = 6–7/group). (F) Plasma IL-6 protein expression (n = 9 versus n = 7). (G) Measurement of immunofluorescent staining of vessel-associated Cd11b+ myeloid cells (orange), α-SMA (green), and DAPI (blue) in lung tissue (n = 5–6/group). (H) Picrosirius red staining in parallel versus orthogonal light with quantification of orthogonal signal representative of vessel collagen deposition (n = 4/group). (I) RVSP (mmHg) measured by right heart catheterization (n = 11 versus n = 7). (J) Fulton index (RV/LV+S, %) (n = 11 versus n = 7). (K) Pearson correlation between relative Fxn and Cdkn2a transcript levels (n = 18). (L) Pearson correlation between Cdkn2a expression and RVSP (n = 18). Scale bars: 50 μm. Two-tailed Student’s t test was performed with error bars that reflect mean ± SD.
Figure 9
Figure 9. Senolytic therapy prevents FXN-dependent PH development.
(A) Diagram for senolytic treatment in female and male hypoxic EC Fxn–/– mice. ABT-263 (25 mg/kg/day) or vehicle control (n = 5/group) was administered via oral gavage in weeks 2 and 3 of hypoxic exposure (3 weeks, 10% O2). (B) Immunofluorescence staining and assessment of Cd11b+ myeloid cells (orange), α-SMA+ vessel smooth muscle cells (green), and counterstaining of nuclei (blue). (C) Representative confocal images and quantified percentage of pulmonary vessel muscularization by immunofluorescence staining of vWF (green) and α-SMA (red). (D) RVSP (mmHg). (E) Diagram depicting senolytic treatment in female and male IL-6 Tg mice during weeks 2 and 3 of hypoxic exposure. (F) Measurement of vessel-associated inflammatory infiltration via Cd11b (orange) (n = 5 versus n = 4). (G) Representative images and quantified percentage of vessel muscularization measured by immunofluorescence staining of vWF (green) and α-SMA (red) (n = 3/group). (H) RVSP (n = 4 versus n = 3). (I) Fulton index (RV/LV+S, %) (n = 5 versus n = 4). (J) Diagram of male hypoxic WT mice treated with ABT-263 (n = 5/group). (K) Vessel-associated CD11b+ cells. (L) RVSP. Two-tailed Student’s t test was performed with error bars that reflect mean ± SD. Scale bars: 50 μm.

Comment in

References

    1. Simonneau G, et al. Haemodynamic definitions and updated clinical classification of pulmonary hypertension. Eur Respir J. 2019;53(1):1801913. doi: 10.1183/13993003.01913-2018. - DOI - PMC - PubMed
    1. Lai YC, et al. Pulmonary arterial hypertension: the clinical syndrome. Circ Res. 2014;115(1):115–130. doi: 10.1161/CIRCRESAHA.115.301146. - DOI - PMC - PubMed
    1. Prince MJ, et al. The burden of disease in older people and implications for health policy and practice. Lancet. 2015;385(9967):549–562. doi: 10.1016/S0140-6736(14)61347-7. - DOI - PubMed
    1. Guazzi M. Pulmonary hypertension in heart failure preserved ejection fraction: prevalence, pathophysiology, and clinical perspectives. Circ Heart Fail. 2014;7(2):367–377. doi: 10.1161/CIRCHEARTFAILURE.113.000823. - DOI - PubMed
    1. Gopal DM, et al. Impaired right ventricular hemodynamics indicate preclinical pulmonary hypertension in patients with metabolic syndrome. J Am Heart Assoc. 2015;4(3):e001597. - PMC - PubMed

Publication types

MeSH terms

Substances