. 2021 Apr 27;16(4):e0250291.
doi: 10.1371/journal.pone.0250291. eCollection 2021.

Protection of the C. elegans germ cell genome depends on diverse DNA repair pathways during normal proliferation

Affiliations

Protection of the C. elegans germ cell genome depends on diverse DNA repair pathways during normal proliferation

Bettina Meier et al. PLoS One. .

Abstract

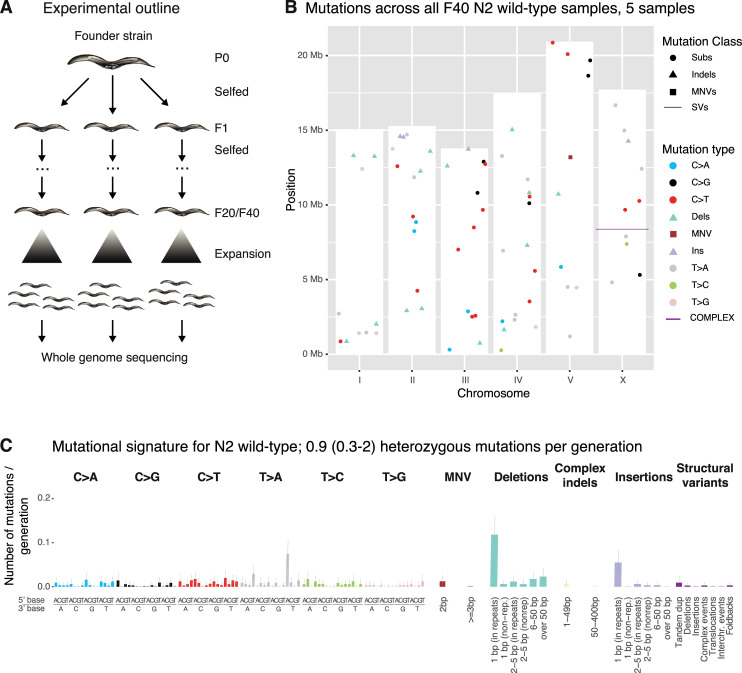
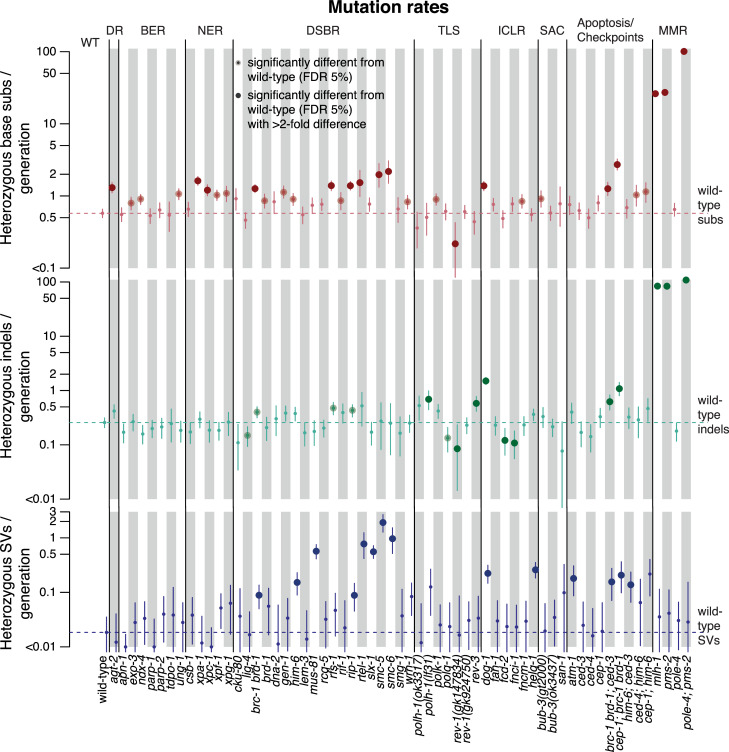
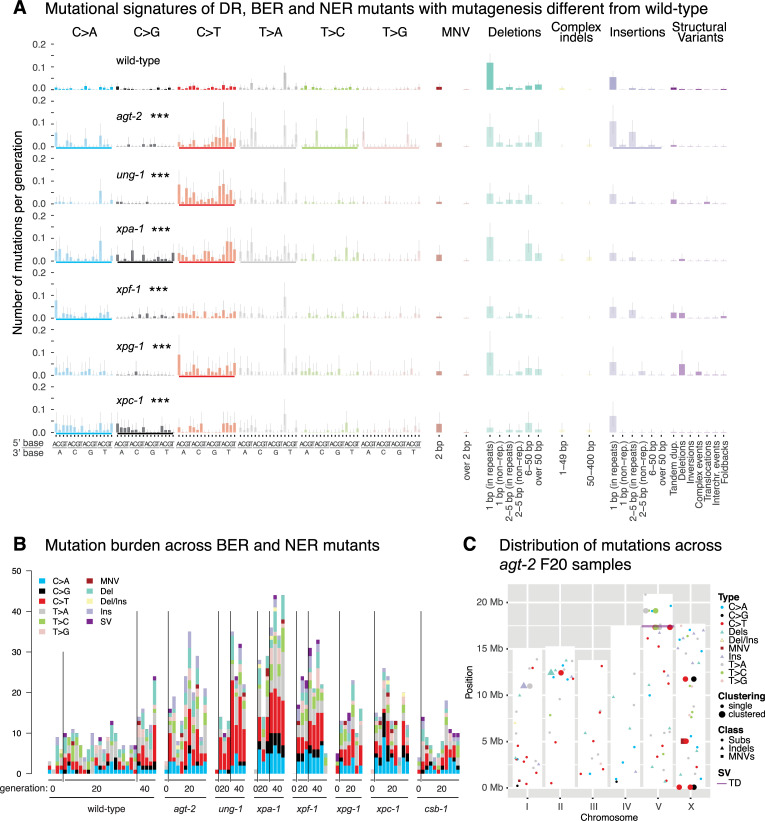
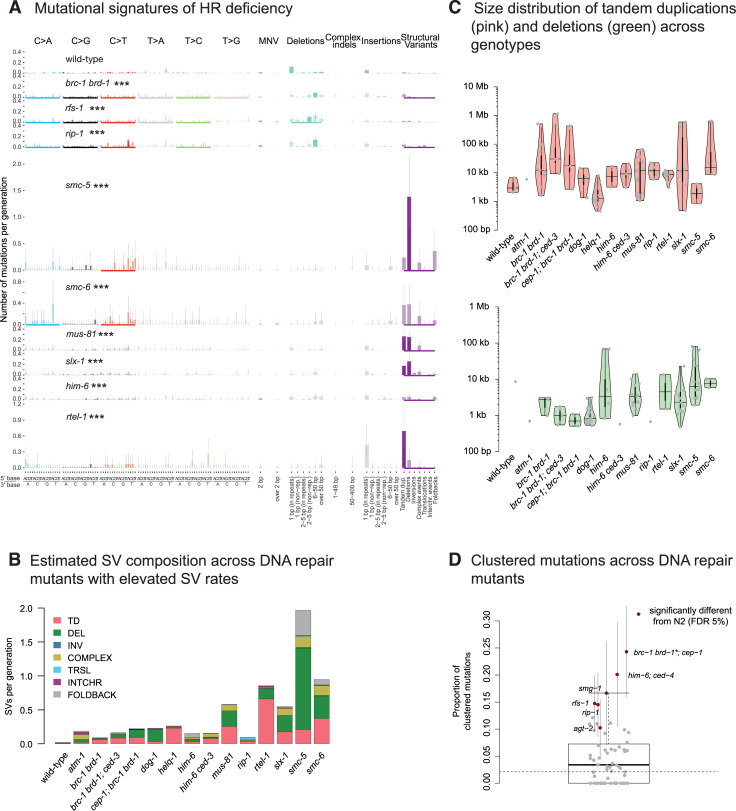
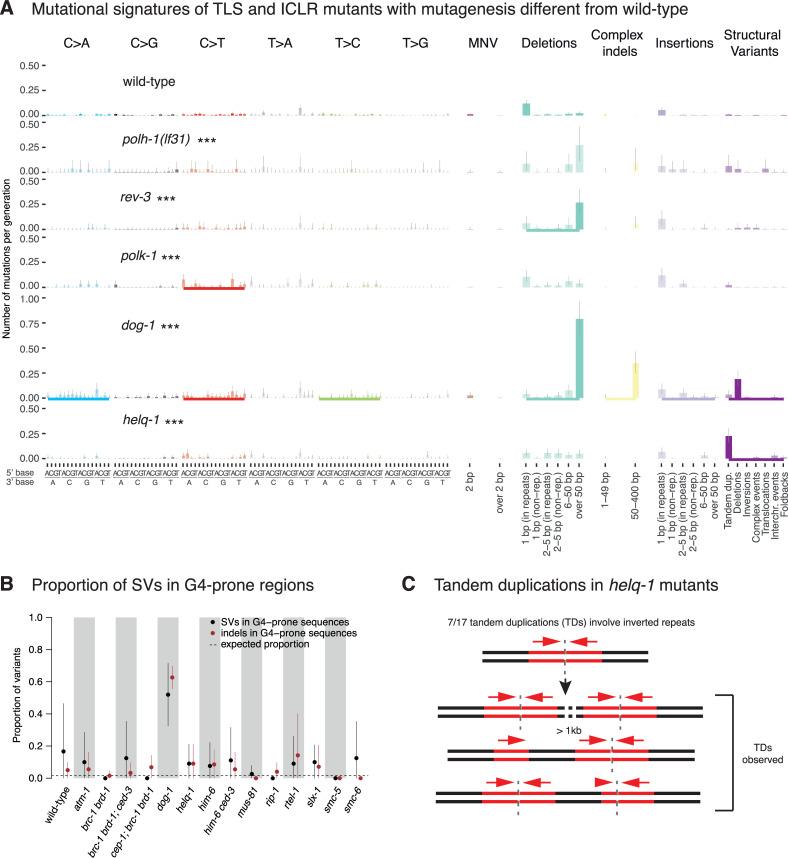
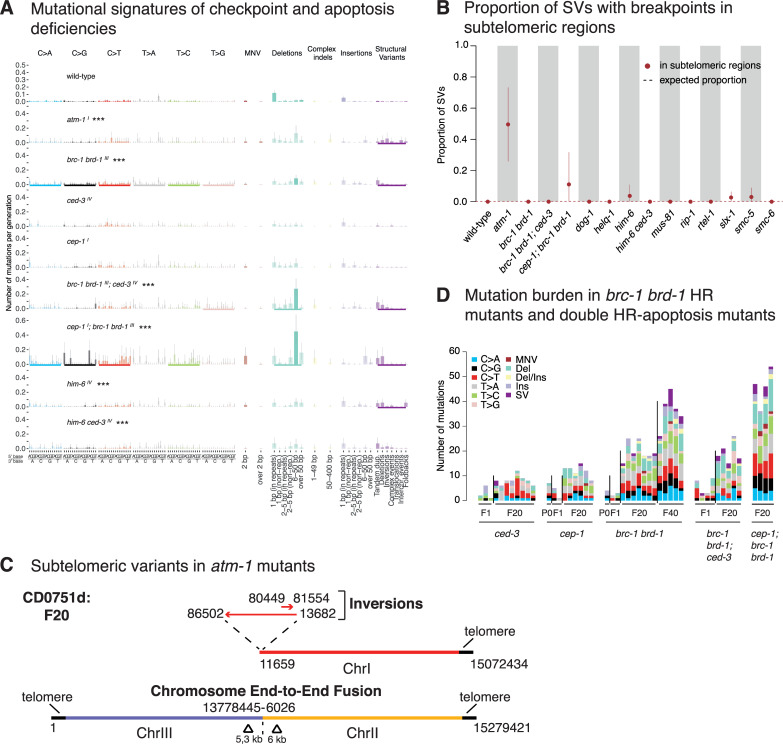
Maintaining genome integrity is particularly important in germ cells to ensure faithful transmission of genetic information across generations. Here we systematically describe germ cell mutagenesis in wild-type and 61 DNA repair mutants cultivated over multiple generations. ~44% of the DNA repair mutants analysed showed a >2-fold increased mutagenesis with a broad spectrum of mutational outcomes. Nucleotide excision repair deficiency led to higher base substitution rates, whereas polh-1(Polη) and rev-3(Polζ) translesion synthesis polymerase mutants resulted in 50-400 bp deletions. Signatures associated with defective homologous recombination fall into two classes: 1) brc-1/BRCA1 and rad-51/RAD51 paralog mutants showed increased mutations across all mutation classes, 2) mus-81/MUS81 and slx-1/SLX1 nuclease, and him-6/BLM, helq-1/HELQ or rtel-1/RTEL1 helicase mutants primarily accumulated structural variants. Repetitive and G-quadruplex sequence-containing loci were more frequently mutated in specific DNA repair backgrounds. Tandem duplications embedded in inverted repeats were observed in helq-1 helicase mutants, and a unique pattern of 'translocations' involving homeologous sequences occurred in rip-1 recombination mutants. atm-1/ATM checkpoint mutants harboured structural variants specifically enriched in subtelomeric regions. Interestingly, locally clustered mutagenesis was only observed for combined brc-1 and cep-1/p53 deficiency. Our study provides a global view of how different DNA repair pathways contribute to prevent germ cell mutagenesis.


Conflict of interest statement

The authors have declared that no competing interests exist.

Figures

Fig 1
Fig 1. Experimental outline and background mutagenesis in wild-type.
A. L4 larvae (F1 generation) from a parental founder strain (P0) were individually picked onto NGM plates and allowed to self-fertilize prior to picking individual L4 larvae of the next generation (F2) from each F1 plate. This process was repeated until clonal lines reached generation F20 or F40. Clonal lines were then allowed to expand, harvested, and prepared for whole genome sequencing (Materials and Methods). B. Mutation types and their location on the 6 C. elegans chromosomes (I-V and X) across all wild-type samples and mutation classes. The height of the white bars corresponds to the length of the respective C. elegans chromosome. Single nucleotide variants are indicated by a dot, dinucleotide variants (DNVs) by a square, indels divided in deletions (D) and insertions (I) by a triangle, and structural variants (SVs) by a line. C. Average number of heterozygous mutations in the N2 wild-type genome per generation across all mutation classes and types. Single nucleotide variants are shown in the context of their 5’ and 3’ base. Grey bars denote 95% credible intervals for the number of mutations in each type. “Complex indels” class denotes deletions with insertions. Data for N2 was previously shown in ([10] Fig 1C) . Information related to the 528 whole genome sequencing WGS primary-source datasets (56 deposited in this study, 472 deposited in (Suppl Data 1 and Supple Note 1 of [10] can be found in S1 Table).
Fig 2
Fig 2. Mutation rates across 60 C. elegans genotypes stratified by mutation type: Base substitutions, indels, and structural variants.
Mutation rates are shown as number of heterozygous mutations per generation for N2 wild-type (WT), and mutants used in this study grouped by the major DNA repair pathway they contribute to; direct damage reversal (DR), base excision repair (BER), nucleotide excision repair (NER), DNA double-strand break repair (DSBR), translesion synthesis (TLS), crosslink repair (ICLR), spindle assembly checkpoint (SAC), apoptosis, and mismatch repair (MMR). Base substitutions are shown in red (top), indels in green (center) and structural variants in blue (bottom). Dotted lines denote the mutation rates for wild-type. Error bars show the 95% confidence intervals; large dots represent variants with 2-fold increased or decreased mutation rates over N2 wild-type which are statistically significant with a false discovery rate (FDR) below 5%. All CIs which extend below the lower edge of the plot have zero as their lower border. Information related to the 528 whole genome sequencing WGS primary-source datasets (56 deposited in this study, 472 deposited in (Suppl Data 1 and Supple Note 1 of [10] can be found in S1 Table).
Fig 3
Fig 3. Mutation analysis of C. elegans BER, NER, and DR mutants with mutation rates or spectra different from wild-type.
A. Mutational signatures of BER, NER, and DR mutants that display statistically significantly different mutation spectra than wild-type shown as the number of mutations per generation across all mutation classes. Underscores (bold coloured bars) below each mutation profile indicate mutation types where the total mutation numbers are different from wild-type, three stars indicate genotypes with significantly different rates of substitutions, indels or SVs compared to those in wild-type (FDR < 5%). Single nucleotide variants are shown in the context of their 5’ and 3’ base context. B. Number of mutations of all classes shown for each individual sequenced line of the indicated genotype and generation. The four sequenced wild-type P0 lines reflect the variance present in initial generations. Mutations are shown cumulatively with mutations present in generation F20 included in F40. C. Mutation types of all classes and their location on the 6 C. elegans chromosomes (I-V and X) observed across agt-2 mutant lines. The height of the white bars corresponds to the length of each individual chromosome. Single nucleotide variants (SNVs) are indicated by a dot, dinucleotide variants (DNVs) by a square, indels divided in deletions (D), insertions (I), and deletions with insertions (DI) by a triangle, and structural variants (SVs) by a line. Clustered mutations that are present within a single agt-2 line are depicted by enlarged bold symbols. An analysis of brca-1, him-6 and smc-6 swas previously shown in ([10] Fig 1C). Information related to the 528 whole genome sequencing WGS primary-source datasets (56 deposited in this study, 472 deposited in (Suppl Data 1 and Supple Note 1 of [10] can be found in S1 Table).
Fig 4
Fig 4. Mutational signatures and genomic features of mutations in DSBR deficient C. elegans.
A. Mutational signatures of DSBR mutants that exhibited statistically significant different mutation rates to wild-type displayed in numbers of mutations per generation. Bold coloured bars denote individual mutation classes where the number of mutations is different from wild-type, an underscore below each mutation profile indicates mutation types with total mutation numbers different from wild-type, and three stars indicate genotypes which have rates of substitutions, indels or SVs significantly different compared to wild-type (FDR < 5%). B. Estimated composition of structural variants per generation as estimated for wild-type and DNA repair mutants with elevated SV rates. C. Size distributions of tandem duplications (top, pink) and deletions (bottom, green) across wild-type and mutants with elevated SV rates. D. Clustering of mutations in DNA repair deficient mutants. Grey dots reflect the average proportions of clustered mutations. Error bars denote 95% confidence intervals. Mutants with a significantly different propensity for mutation clustering from wild-type (dotted black line) are shown and highlighted in red. ‘Information related to the 528 whole genome sequencing WGS primary-source datasets (56 deposited in this study, 472 deposited in (Suppl Data 1 and Supple Note 1 of [10] can be found in S1 Table).
Fig 5
Fig 5. Signatures and genomic features of mutations in TLS and ICLR deficient C. elegans.
A. Mutational signatures of TLS and ICLR mutants that exhibited statistically significant differences to wild-type mutation rates displayed in numbers of mutations per generation. Same layout as Fig 4A. B. Proportion of indels (brown) and SVs (black) in G-rich regions in wild-type and across genotypes with elevated rates of SVs. Dotted line represents the proportion of variants falling into these regions as expected by chance. C. Tandem duplications (TDs) in helq-1 mutants. An analysis of rev-3 was previously shown in ([10] Fig 1C). Information related to the 528 whole genome sequencing WGS primary-source datasets (56 deposited in this study, 472 deposited in (Suppl Data 1 and Supple Note 1 of [10] can be found in S1 Table).
Fig 6
Fig 6. Signatures and genomic features of mutations in DNA damage checkpoint and apoptosis deficient C. elegans.
A. Mutational signatures of mutants that exhibited statistically significant differences to wild-type mutation rates. The chromosomes on which respective genes are located are indicated in superscript following each mutant name. Layout as Fig 4A. B. Proportion of SVs with breakpoints into subtelomeric regions across wild-type and mutants that exhibit elevated SV rates. Dotted lines represent the fraction of variants expected to occur in subtelomeric regions by chance. C. Examples of subtelomeric structural variants in atm-1 mutants. D. Quantification of mutation burden in indicated DNA repair mutants for initial generations and F20 and F40 generations as shown. Information related to the 528 whole genome sequencing WGS primary-source datasets (56 deposited in this study, 472 deposited in (Suppl Data 1 and Supple Note 1 of [10] can be found in S1 Table).

Similar articles

Cited by

References

    1. Lindahl T, Barnes DE. Repair of endogenous DNA damage. Cold Spring Harb Symp Quant Biol. 2000;65: 127–133. 10.1101/sqb.2000.65.127 - DOI - PubMed
    1. Ames BN, Shigenaga MK, Gold LS. DNA lesions, inducible DNA repair, and cell division: three key factors in mutagenesis and carcinogenesis. Environ Health Perspect. 1993;101 Suppl 5: 35–44. 10.1289/ehp.93101s535 - DOI - PMC - PubMed
    1. Mehta A, Haber JE. Sources of DNA double-strand breaks and models of recombinational DNA repair. Cold Spring Harb Perspect Biol. 2014;6: a016428. 10.1101/cshperspect.a016428 - DOI - PMC - PubMed
    1. Hillers KJ, Jantsch V, Martinez-Perez E, Yanowitz JL. Meiosis (May 4, 2017), WormBook, ed. The C. elegans Research Community, WormBook, 10.1895/wormbook.1.178.1.2017 - DOI - PMC - PubMed
    1. Keightley PD, Ness RW, Halligan DL, Haddrill PR. Estimation of the Spontaneous Mutation Rate per Nucleotide Site in aDrosophila melanogasterFull-Sib Family. Genetics. 2014. pp. 313–320. 10.1534/genetics.113.158758 - DOI - PMC - PubMed

Publication types

MeSH terms