

The influence of fine particulate matter on the association between residential greenness and ovarian reserve
- PMID: 33905704
- PMCID: PMC8487590
- DOI: 10.1016/j.envres.2021.111162
The influence of fine particulate matter on the association between residential greenness and ovarian reserve
Abstract
Background: Natural vegetation, or greenness, is thought to improve health through its ability to buffer and reduce harmful environmental exposures as well as relieve stress, promote physical activity, restore attention, and increase social cohesion. In concert, these effects could help mitigate the detrimental effects of air pollution on reproductive aging in women.
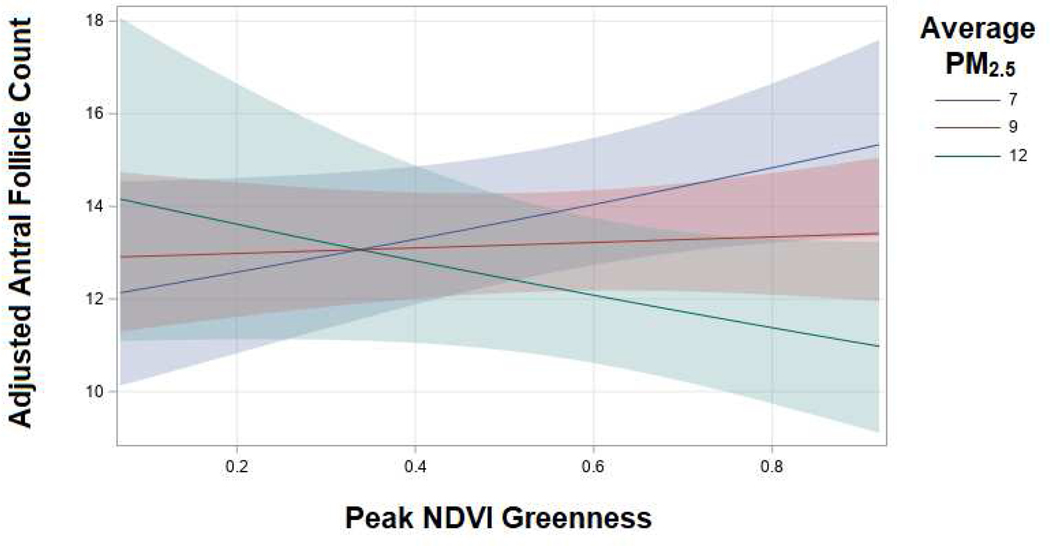
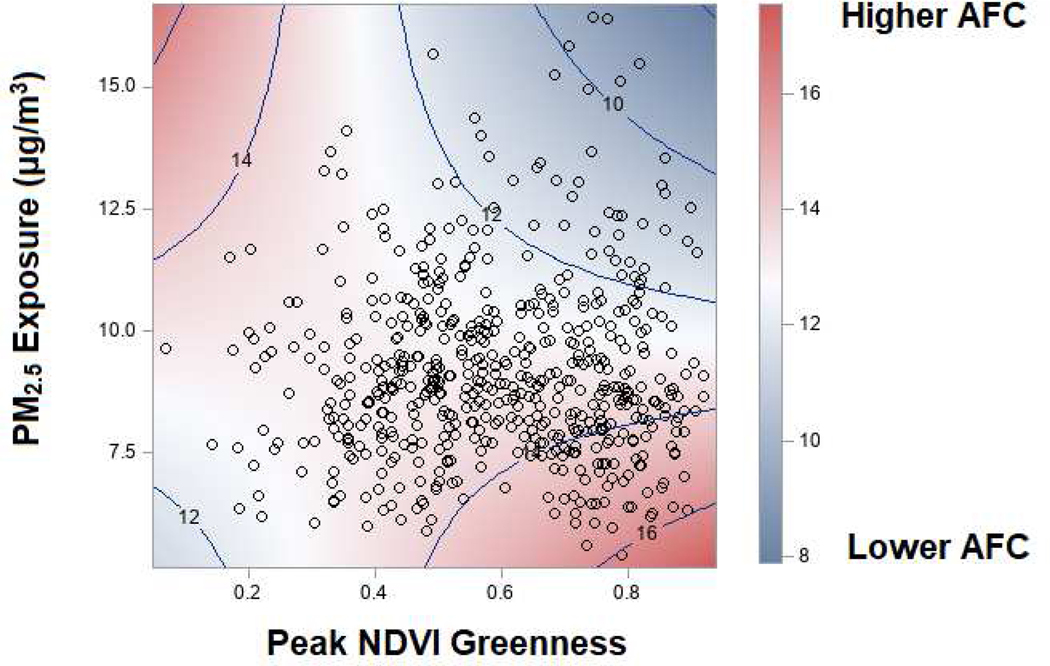
Methods: Our analysis included 565 women attending the Massachusetts General Hospital Fertility Center (2004-2014) who had a measured antral follicle count (AFC), a marker of ovarian reserve. We calculated peak residential greenness in the year prior to AFC using 250 m2 normalized difference vegetation index (NDVI) from the Terra and Aqua satellites operated by the United States National Aeronautics and Space Administration. Validated spatiotemporal models estimated daily residential exposure to particulate matter <2.5 μm (PM2.5) for the 3 months prior to AFC. Poisson regression models with robust standard errors were used to estimate the association between peak greenness, average PM2.5 exposure, and AFC adjusted for age, BMI, smoking status, education, year, and season.
Results: Women in our study had a mean age of 35.2 years with a standard deviation (SD) of 4.3 years (min: 20 years, max: 45 years). The peak residential NDVI ranged from 0.07 to 0.92 with a SD of 0.18. There was no statistically significant association between peak residential greenness and AFC; however, higher exposure to PM2.5 was associated with lower AFC (-6.2% per 2 μg/m3 [1 SD increase] 95% CI -11.8, -0.3). There was a significant interaction between exposure to PM2.5 and peak greenness on AFC (P-interaction: 0.03). Among women with an average PM2.5 exposure of 7 μg/m3, a SD increase in residential peak greenness was associated with a 5.6% (95% CI -0.4, 12.0) higher AFC. Conversely, among women with a PM2.5 exposure of 12 μg/m3, a SD increase in residential peak greenness was associated with a 5.8% (95% CI -13.1, 2.1) lower AFC.
Conclusions: Residing in an area with high levels of greenness may slow reproductive aging in women only when exposure to PM2.5 is low.
Keywords: Air pollution; Built environment; Fertility; Greenness; Ovarian aging.
Copyright © 2021 Elsevier Inc. All rights reserved.
Conflict of interest statement
Declaration of interests
The authors declare that they have no known competing financial interests or personal relationships that could have appeared to influence the work reported in this paper.
Figures

Similar articles
-
Fine particulate matter and ovarian health: A review of emerging risks.Heliyon. 2024 Nov 19;10(22):e40503. doi: 10.1016/j.heliyon.2024.e40503. eCollection 2024 Nov 30. Heliyon. 2024. PMID: 39650185 Free PMC article. Review.
-
Exposure to Fine Particulate Matter and Ovarian Reserve Among Women from a Fertility Clinic.Epidemiology. 2019 Jul;30(4):486-491. doi: 10.1097/EDE.0000000000001029. Epidemiology. 2019. PMID: 31162281 Free PMC article.
-
Association of Fine Particulate Matter and Residential Greenness With Risk of Pulmonary Tuberculosis Retreatment: Population-Based Retrospective Study.JMIR Public Health Surveill. 2024 Aug 12;10:e50244. doi: 10.2196/50244. JMIR Public Health Surveill. 2024. PMID: 39140280 Free PMC article.
-
Air pollution, residential greenness, and metabolic dysfunction biomarkers: analyses in the Chinese Longitudinal Healthy Longevity Survey.BMC Public Health. 2022 May 4;22(1):885. doi: 10.1186/s12889-022-13126-8. BMC Public Health. 2022. PMID: 35509051 Free PMC article.
-
Association of exposure to air pollution and green space with ovarian reserve hormones levels.Environ Res. 2020 May;184:109342. doi: 10.1016/j.envres.2020.109342. Epub 2020 Mar 3. Environ Res. 2020. PMID: 32172073
Cited by
-
Is Greenness Associated with Dementia? A Systematic Review and Dose-Response Meta-analysis.Curr Environ Health Rep. 2022 Dec;9(4):574-590. doi: 10.1007/s40572-022-00365-5. Epub 2022 Jul 20. Curr Environ Health Rep. 2022. PMID: 35857243 Free PMC article.
-
Associations between Residential Greenspace and Fecundability in a North American Preconception Cohort Study.Environ Health Perspect. 2023 Apr;131(4):47012. doi: 10.1289/EHP10648. Epub 2023 Apr 26. Environ Health Perspect. 2023. PMID: 37098782 Free PMC article.
-
Fine particulate matter and ovarian health: A review of emerging risks.Heliyon. 2024 Nov 19;10(22):e40503. doi: 10.1016/j.heliyon.2024.e40503. eCollection 2024 Nov 30. Heliyon. 2024. PMID: 39650185 Free PMC article. Review.
-
Air pollutants and ovarian reserve: a systematic review of the evidence.Front Public Health. 2024 Sep 23;12:1425876. doi: 10.3389/fpubh.2024.1425876. eCollection 2024. Front Public Health. 2024. PMID: 39376999 Free PMC article.
-
PM2.5, vegetation density, and childhood cancer: a case-control registry-based study from Texas 1995-2011.J Natl Cancer Inst. 2024 Jun 7;116(6):876-884. doi: 10.1093/jnci/djae035. J Natl Cancer Inst. 2024. PMID: 38366656 Free PMC article.
References
-
- Weier J, Herring D. Measuring Vegetation (NDVI & EVI). NASA. https://earthobservatory.nasa.gov/features/MeasuringVegetation. Published 2000. Updated 08/03/2000. Accessed September 23, 2020.
-
- Vivanco-Hidalgo RM, Avellaneda-Gómez C, Dadvand P, et al.Association of residential air pollution, noise, and greenspace with initial ischemic stroke severity. Environ Res. 2019;179(Pt A):108725. - PubMed
Publication types
MeSH terms
Substances
Grants and funding
LinkOut - more resources
Full Text Sources
Other Literature Sources
Medical
