

The aversion positivity: Mediofrontal cortical potentials reflect parametric aversive prediction errors and drive behavioral modification following negative reinforcement
- PMID: 33905968
- PMCID: PMC8169579
- DOI: 10.1016/j.cortex.2021.03.012
The aversion positivity: Mediofrontal cortical potentials reflect parametric aversive prediction errors and drive behavioral modification following negative reinforcement
Abstract
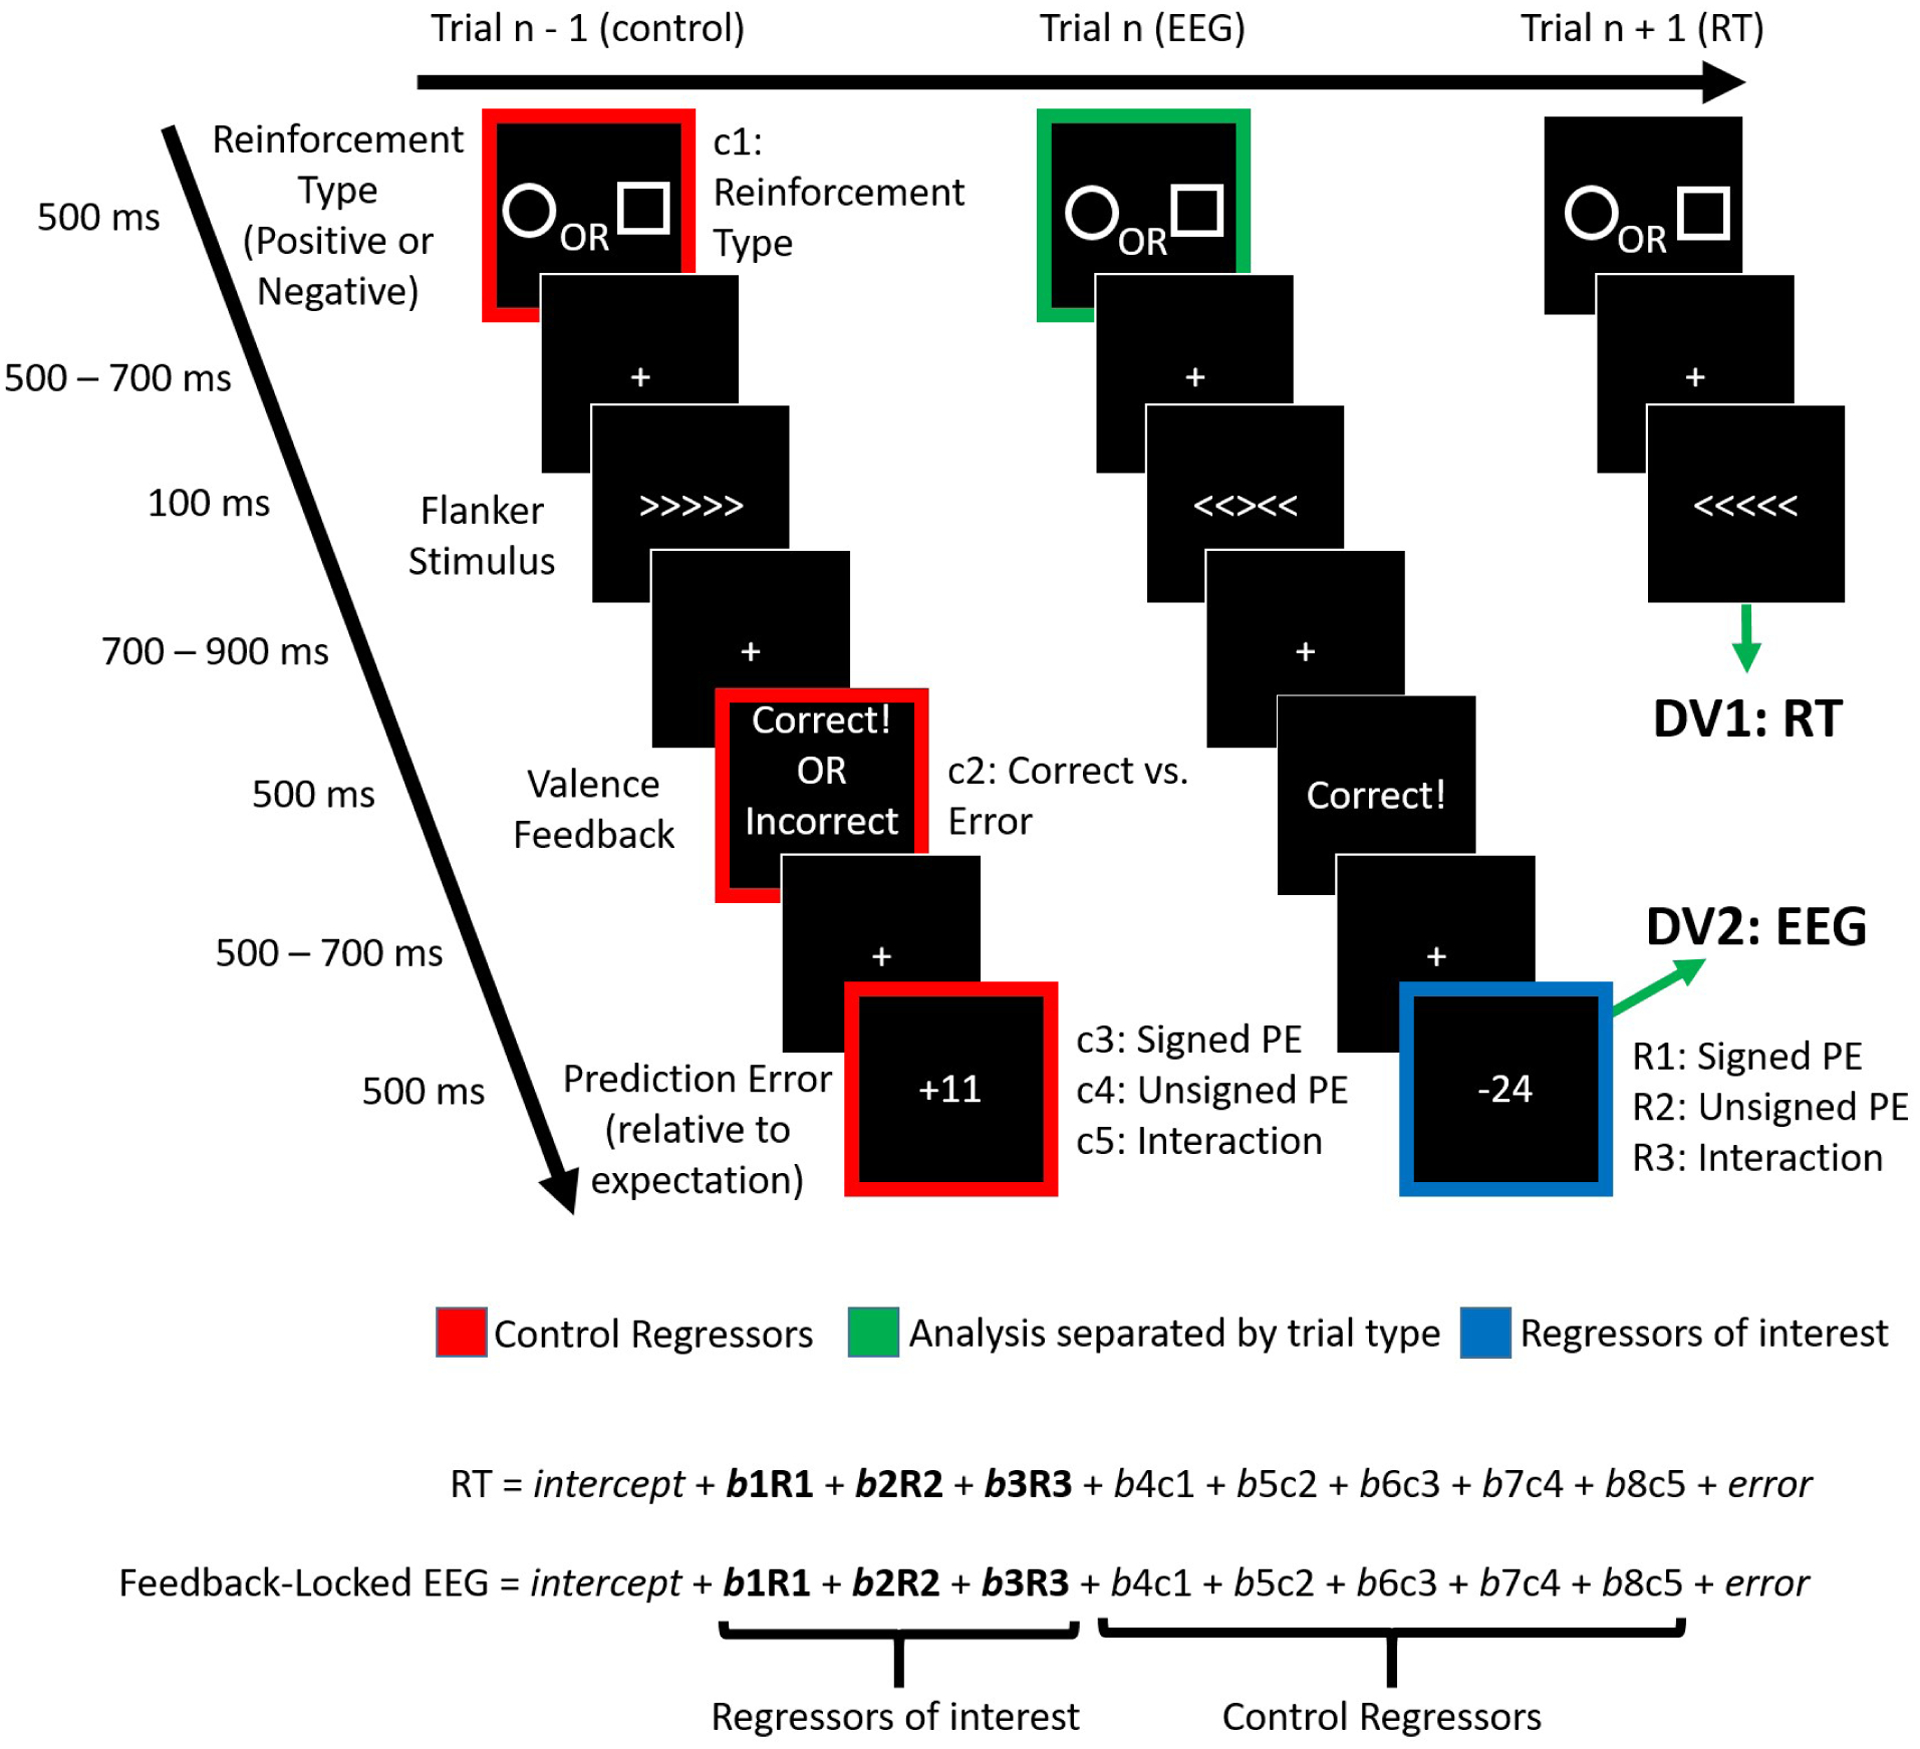
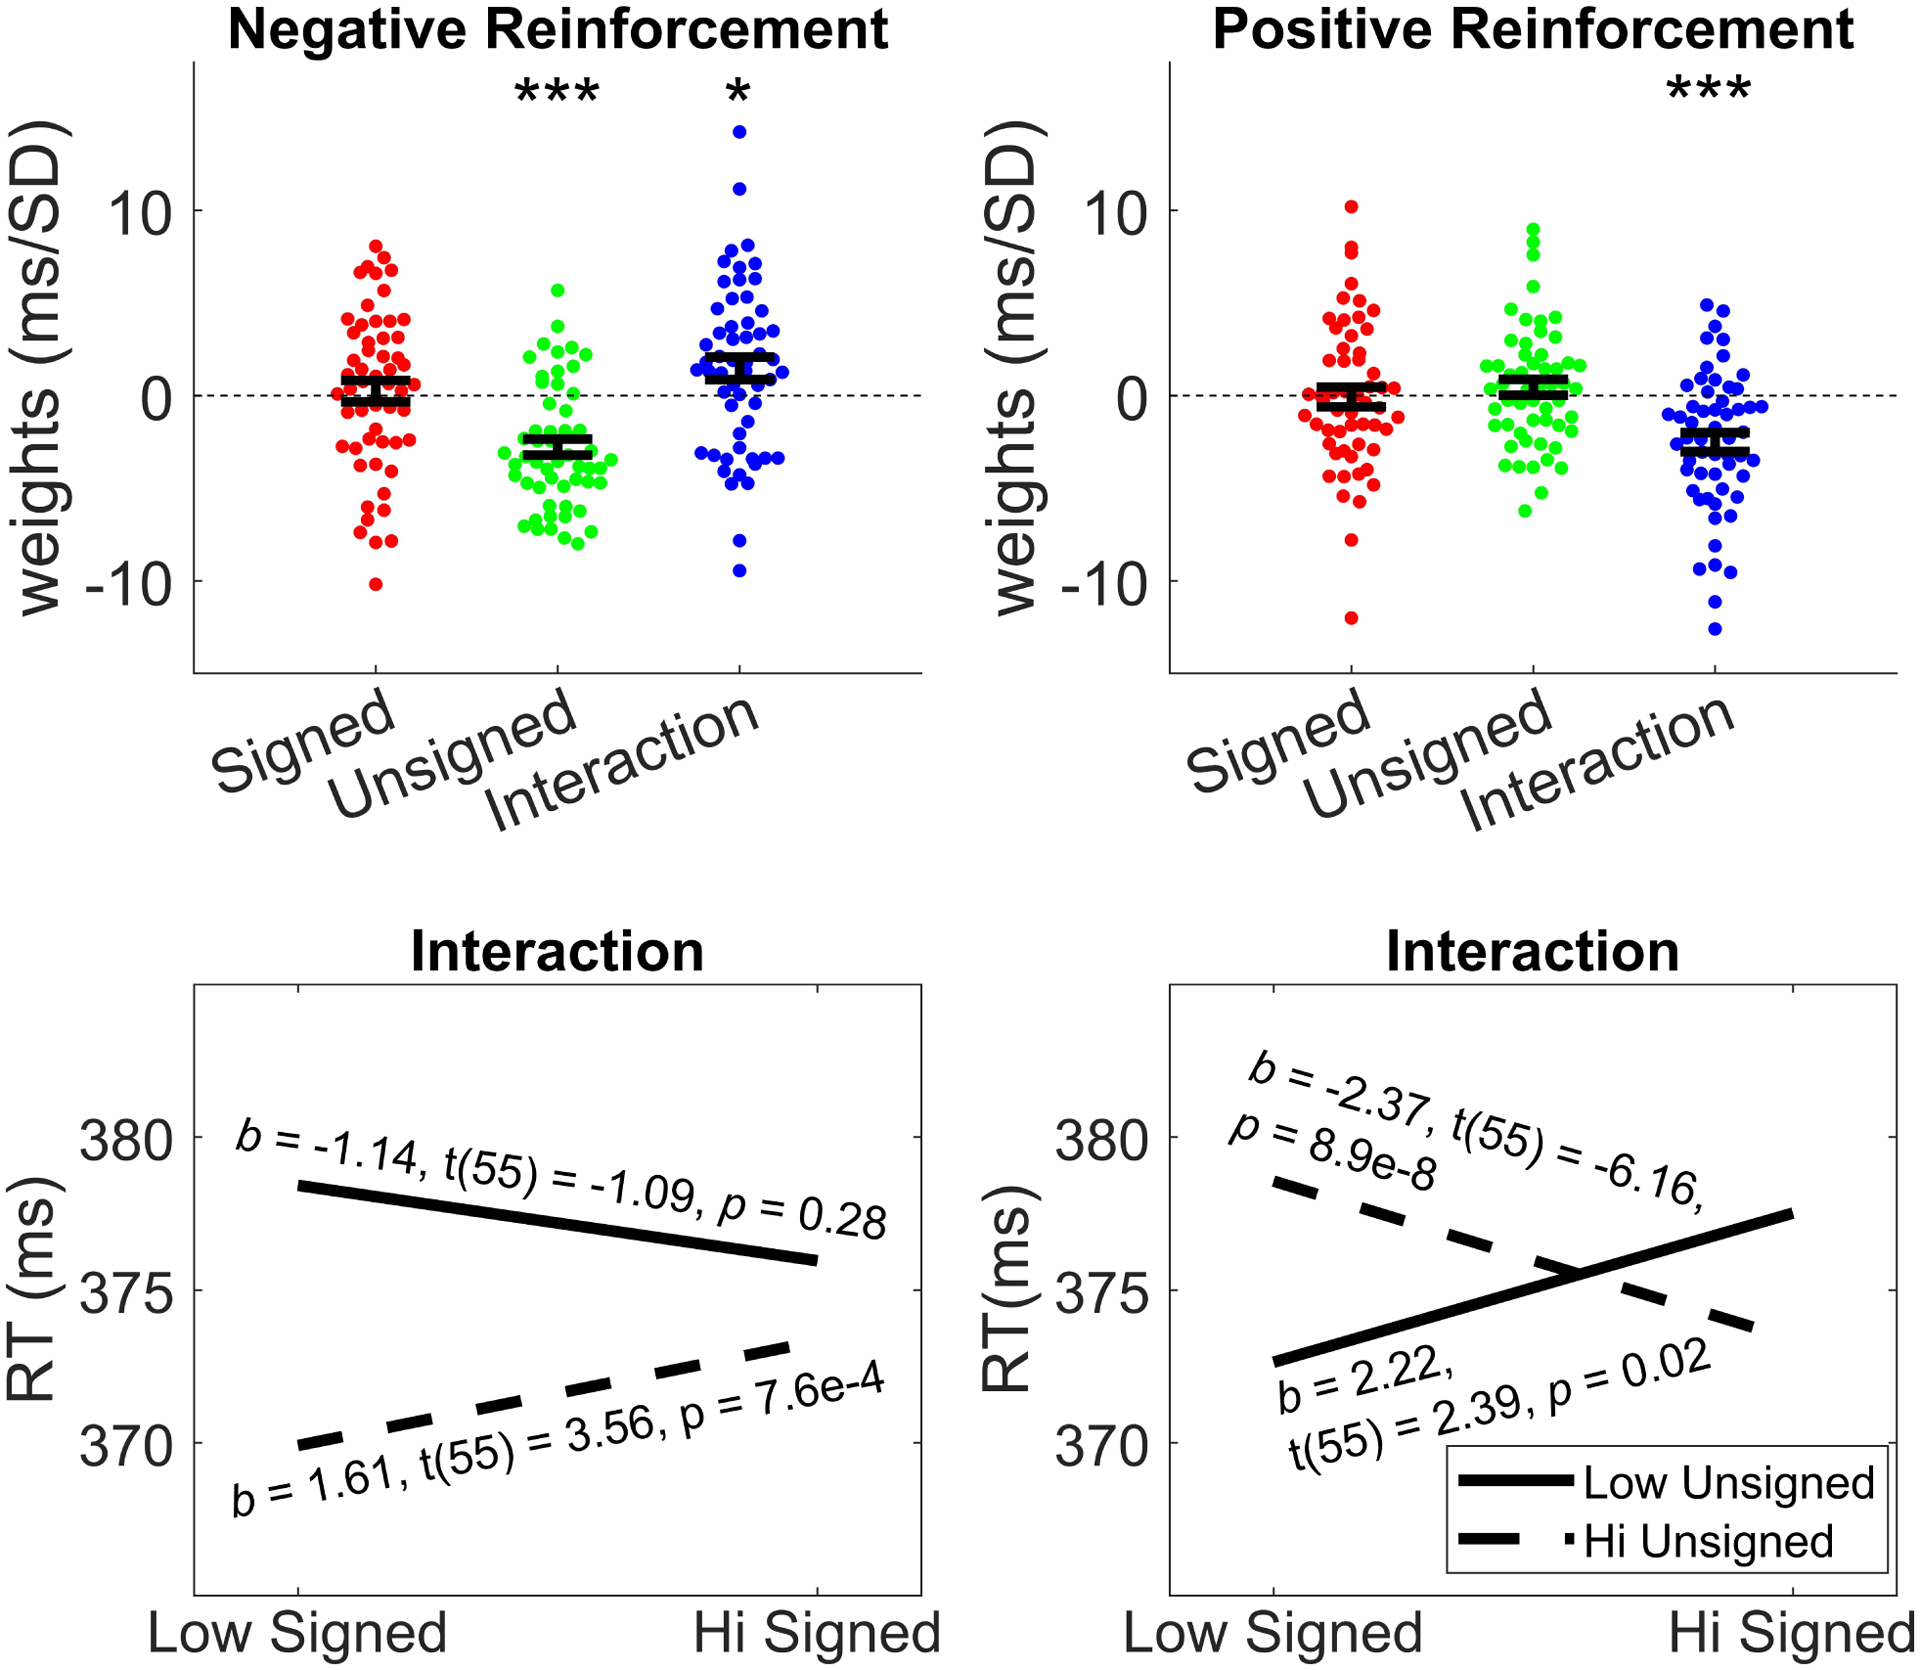
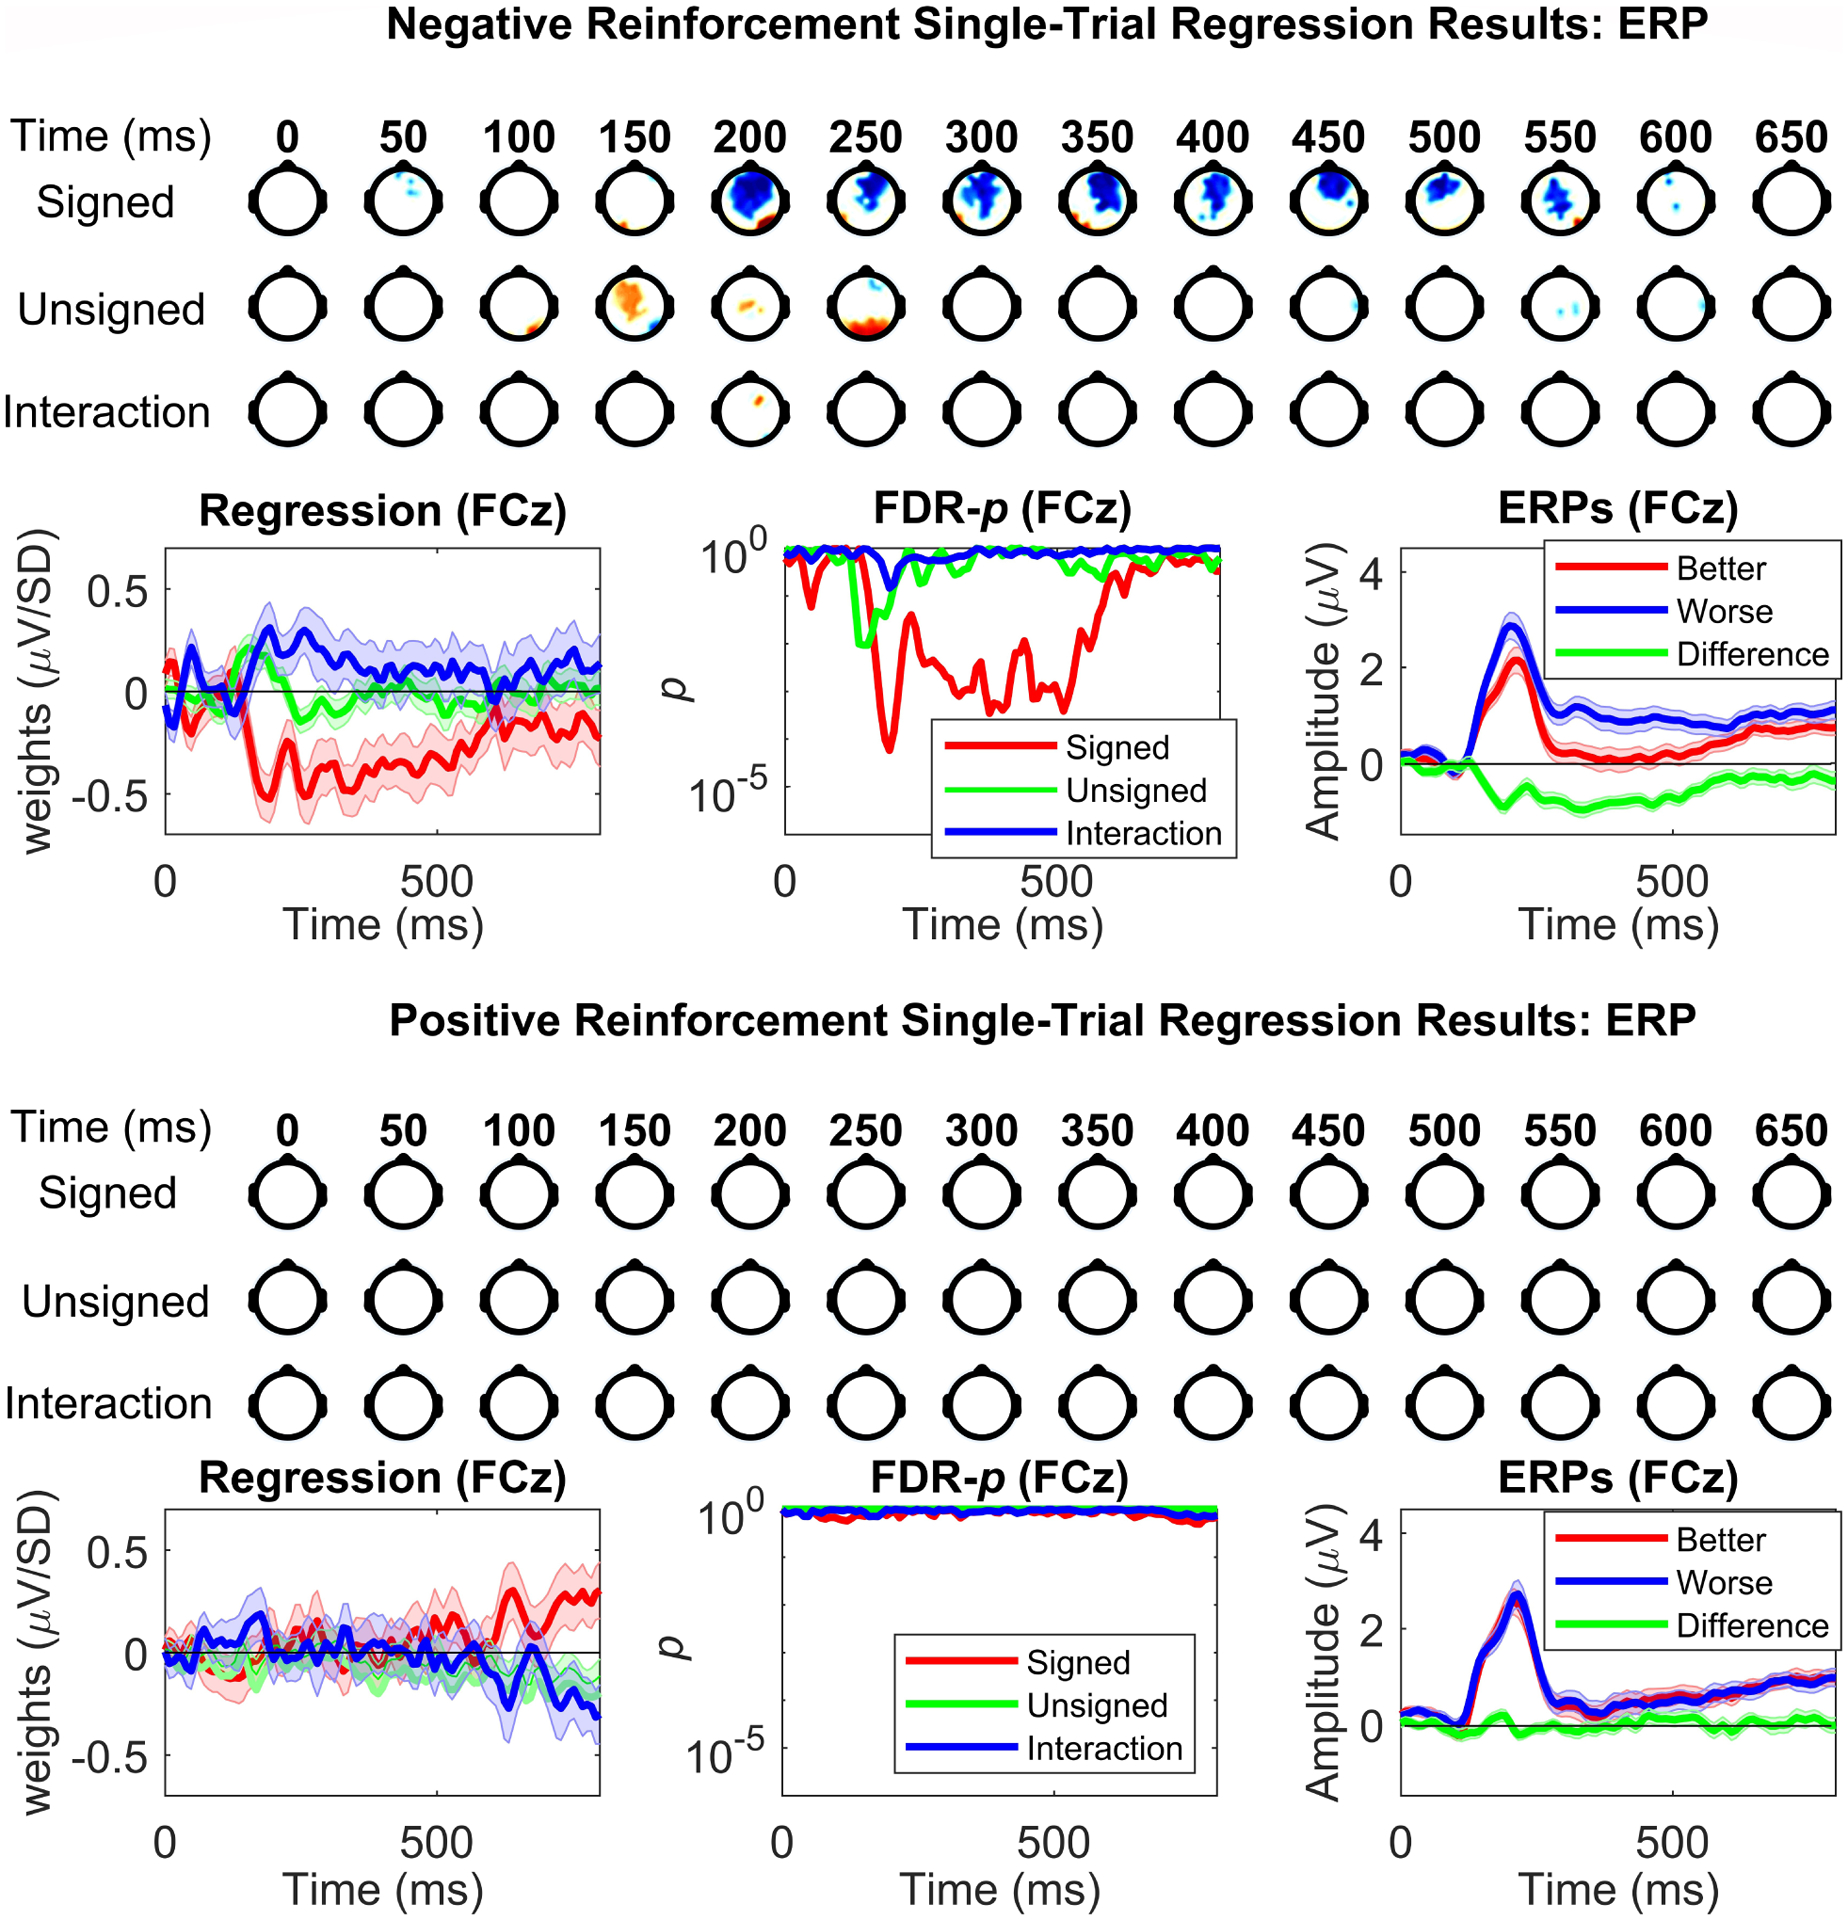
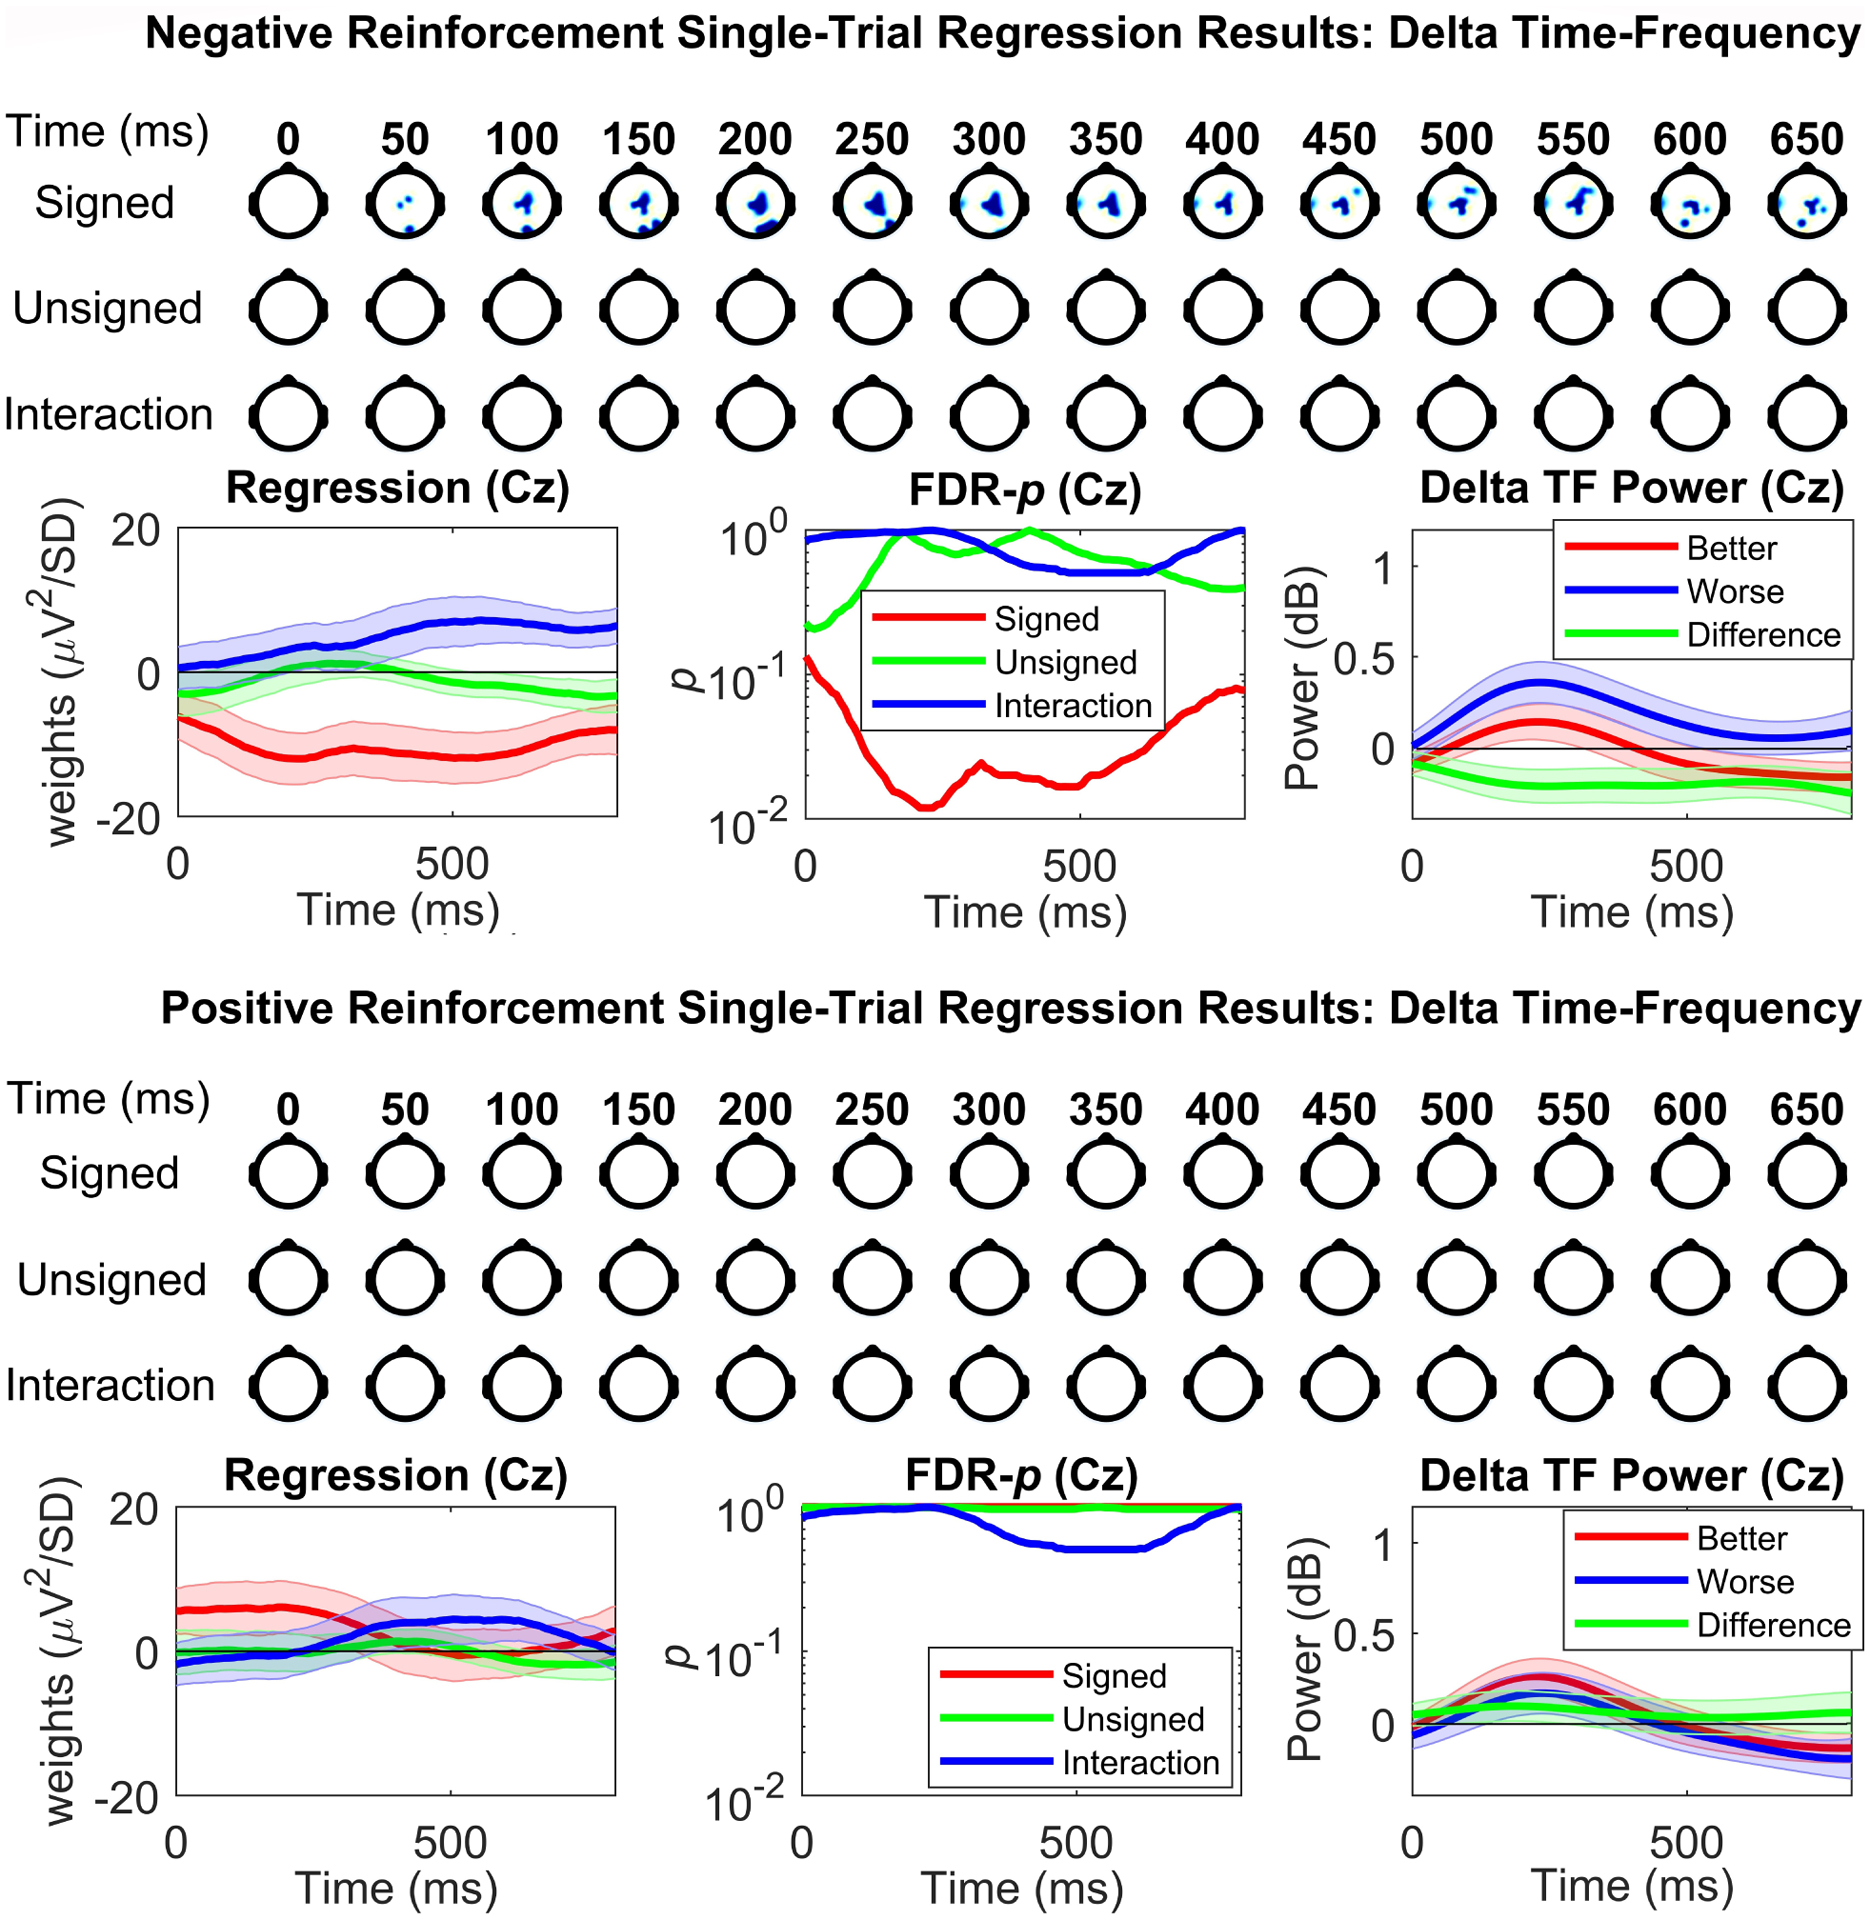
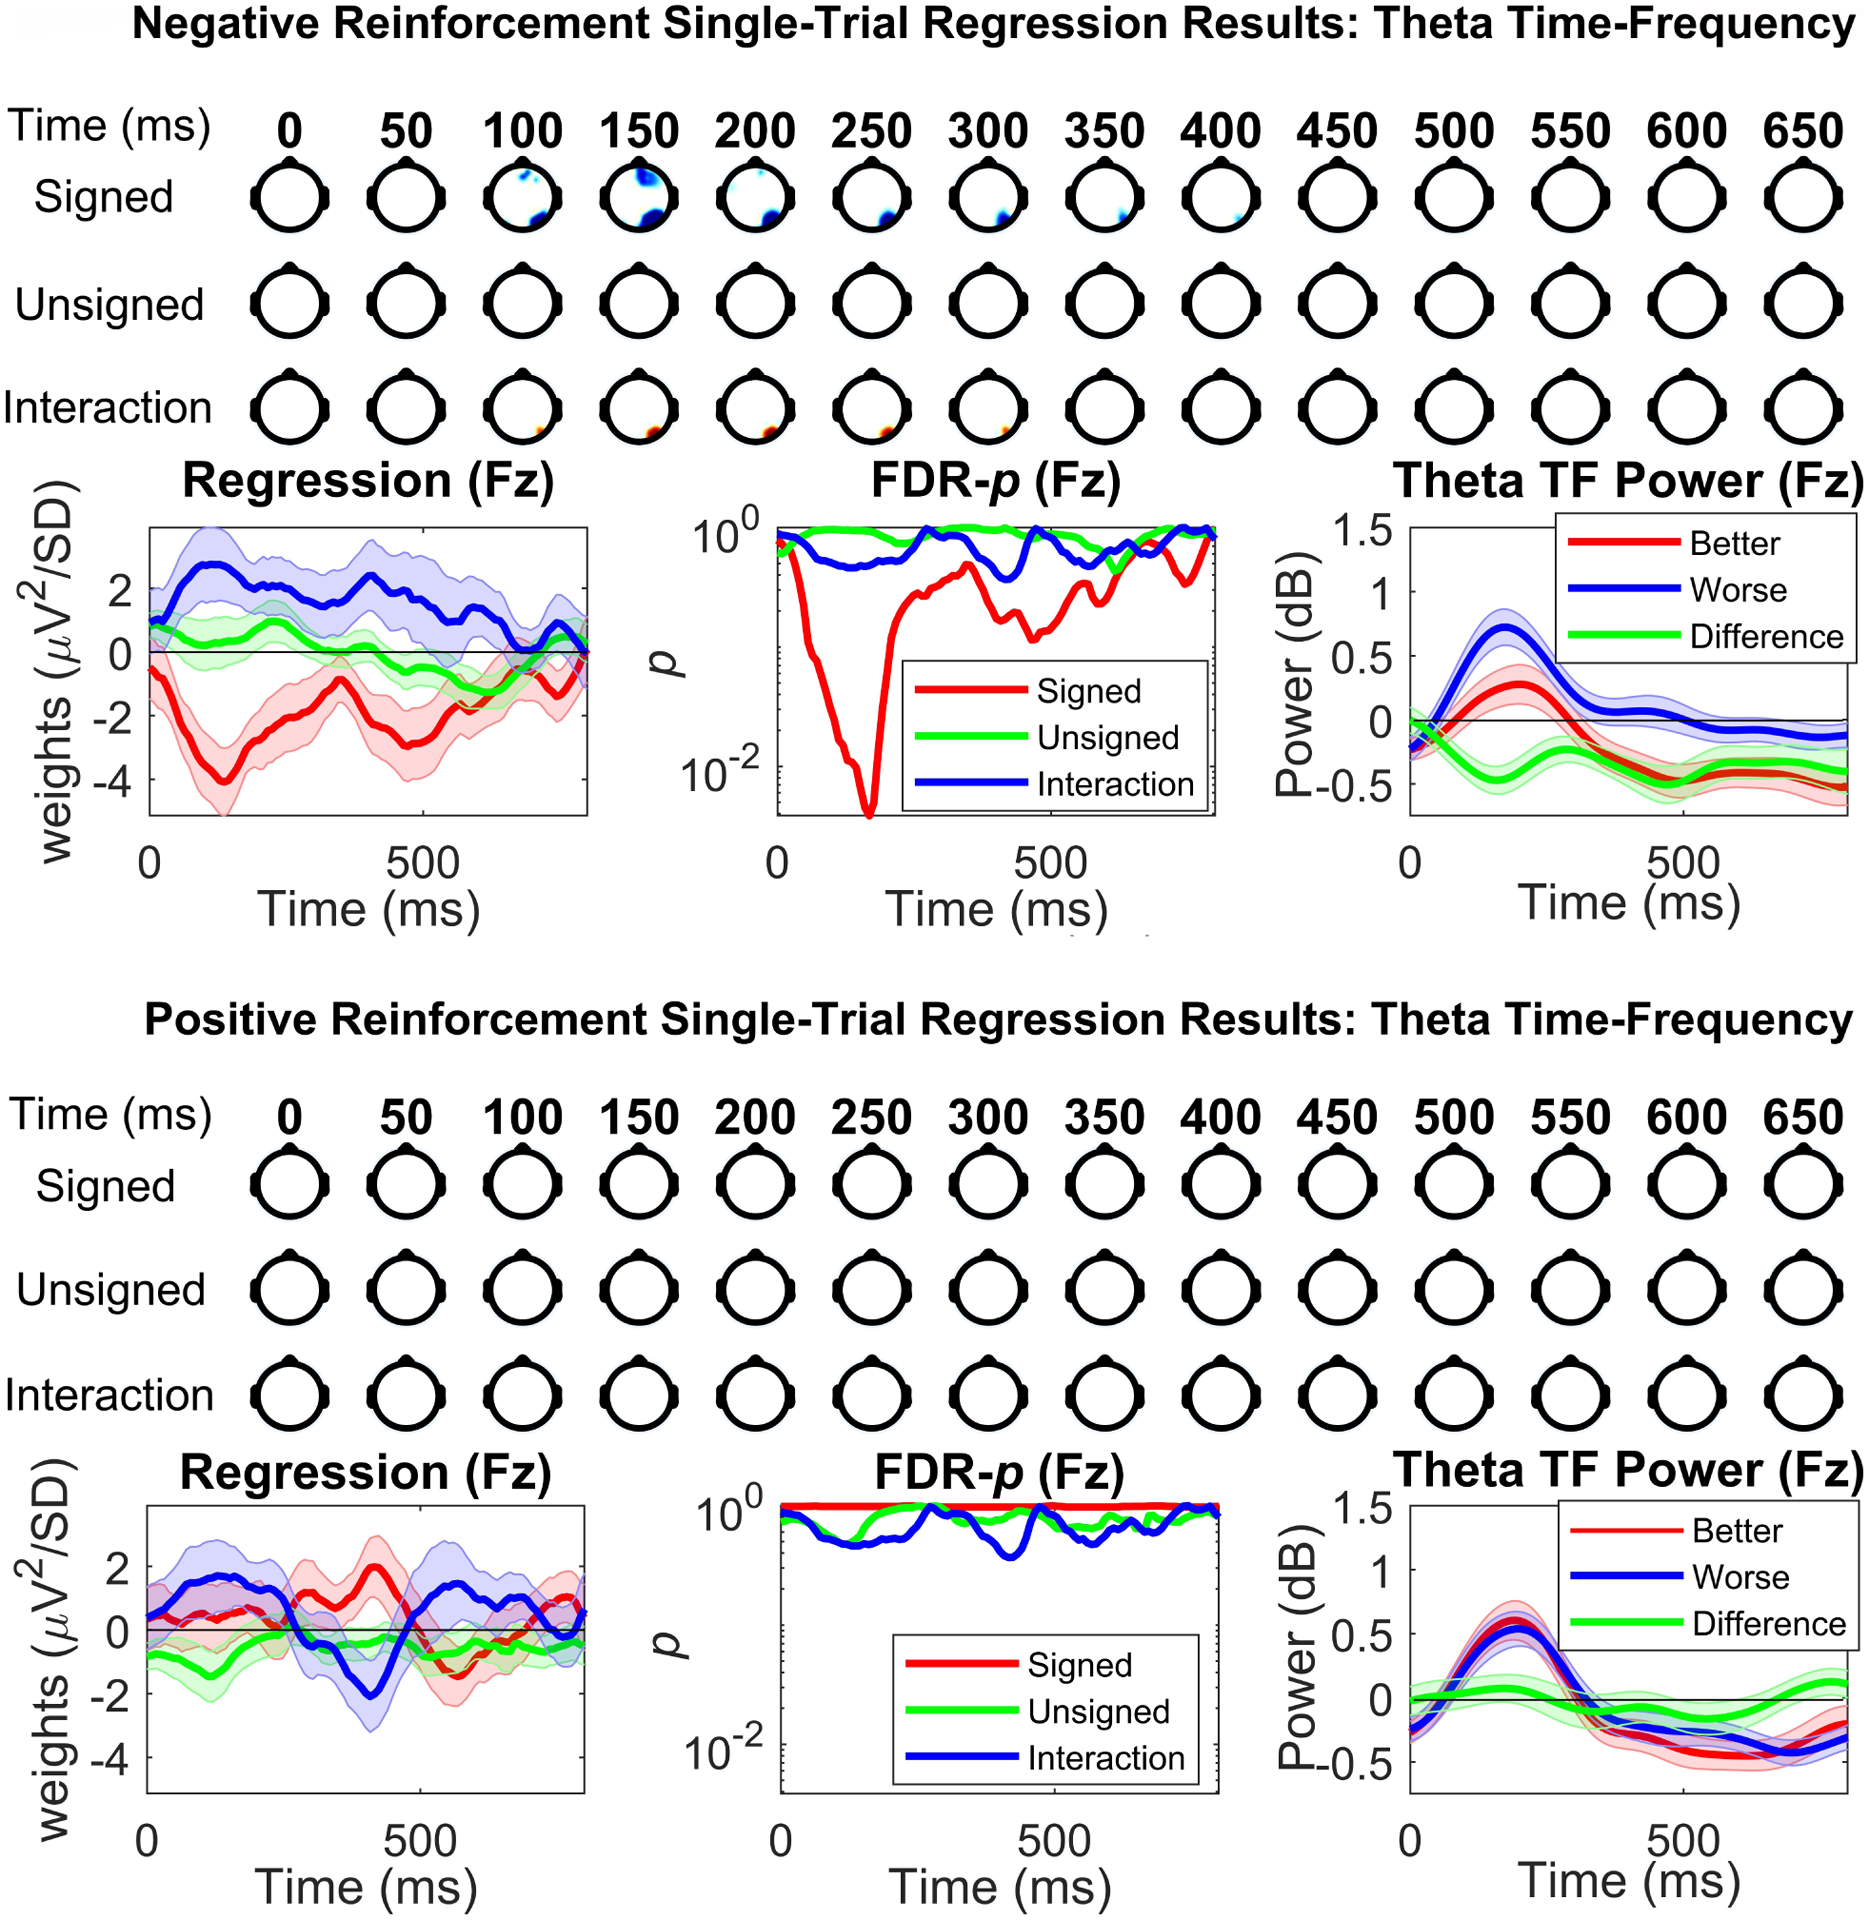
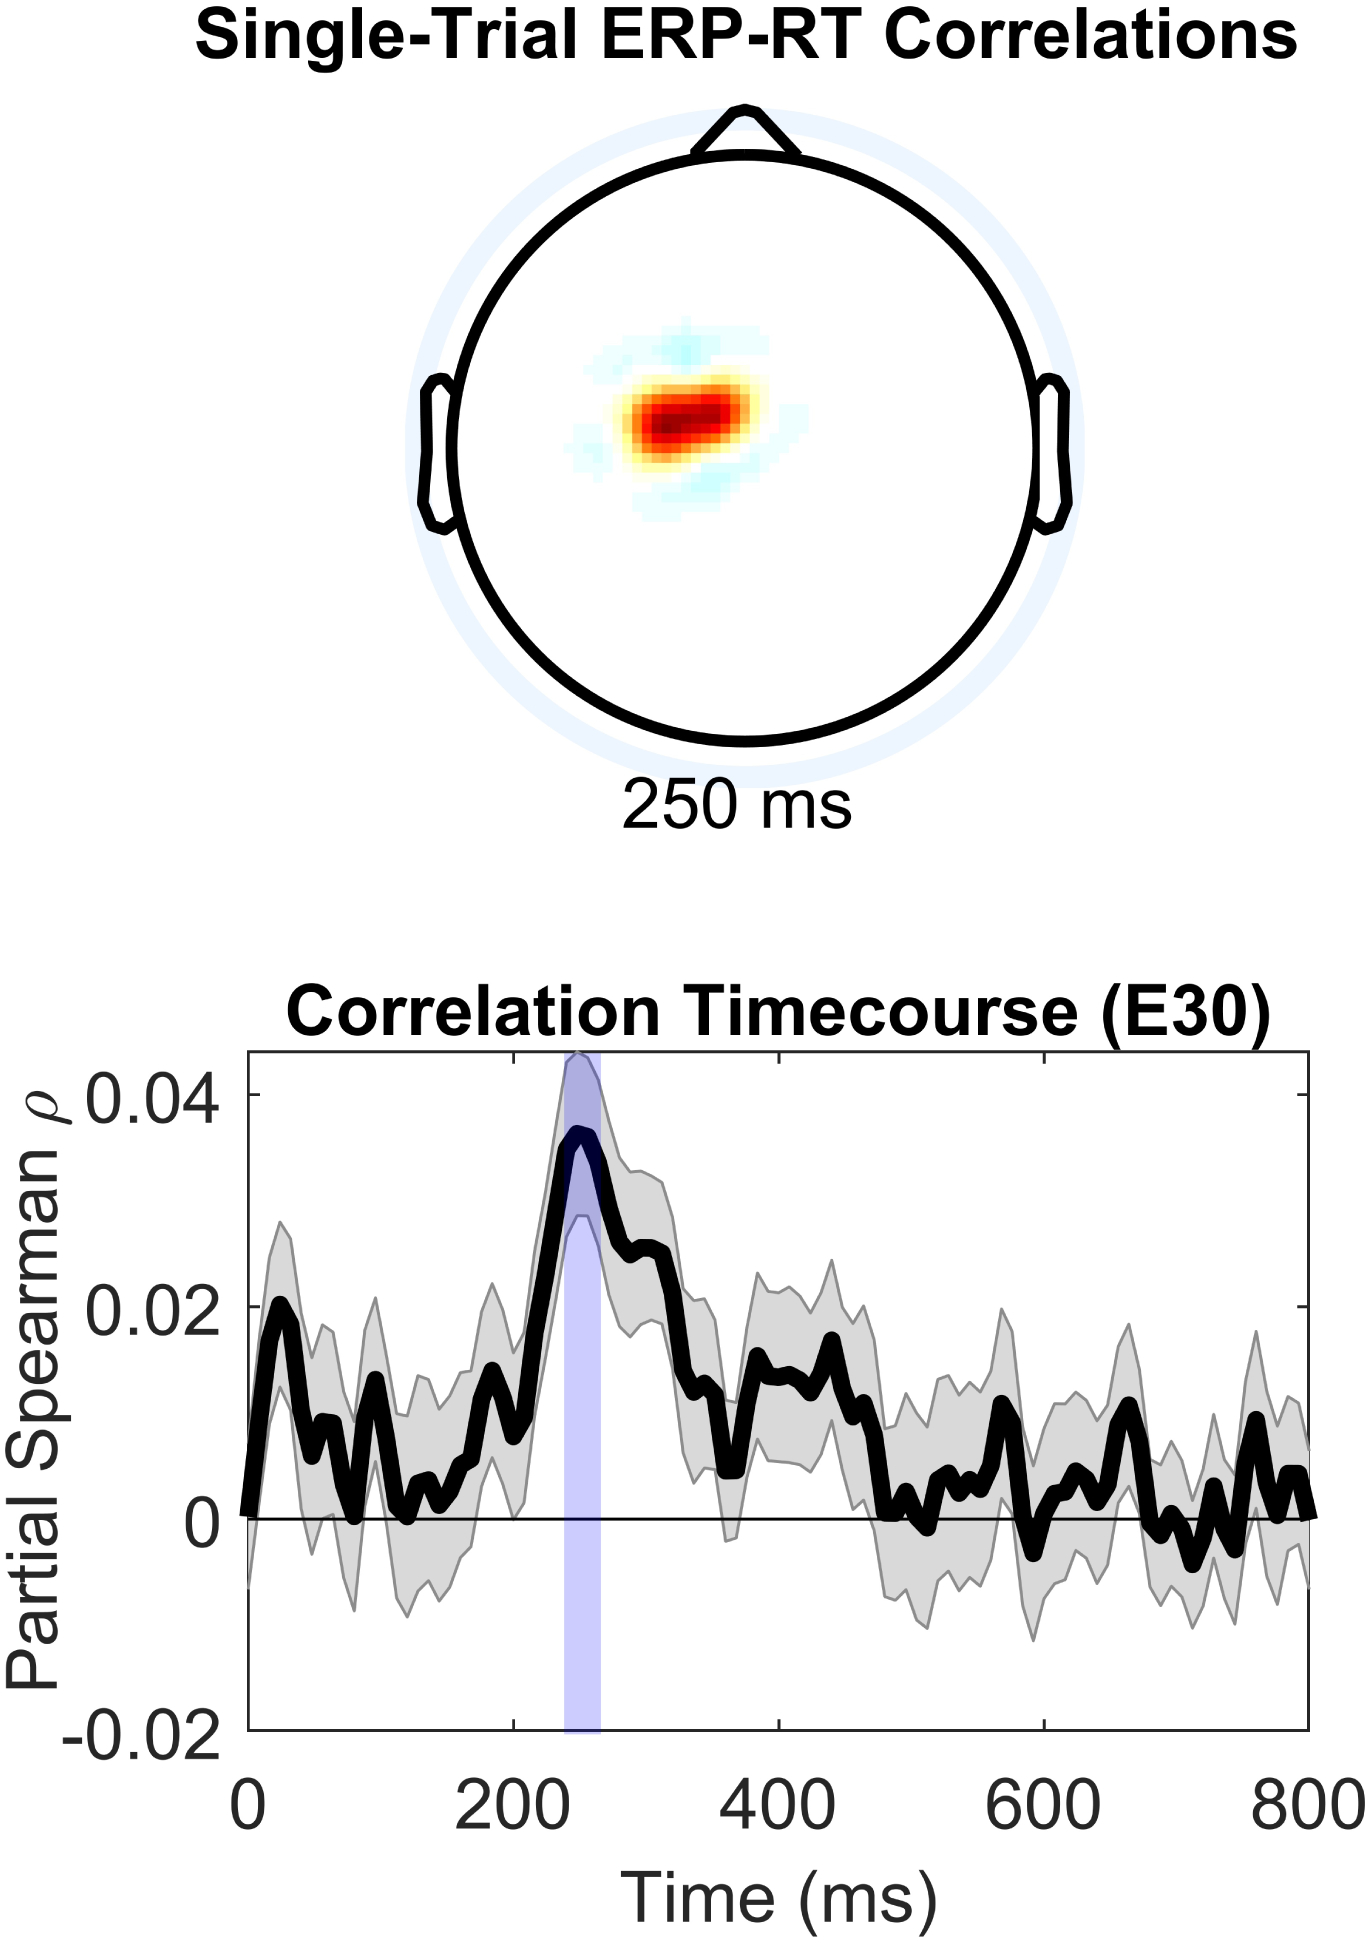
Reinforcement learning capitalizes on prediction errors (PEs), representing the deviation of received outcomes from expected outcomes. Mediofrontal event-related potentials (ERPs), in particular the feedback-related negativity (FRN)/reward positivity (RewP), are related to PE signaling, but there is disagreement as to whether the FRN/RewP encode signed or unsigned PEs. PE encoding can potentially be dissected by time-frequency analysis, as frontal theta [4-8 Hz] might represent poor outcomes, while central delta [1-3 Hz] might instead represent rewarding outcomes. However, cortical PE signaling in negative reinforcement is still poorly understood, and the role of cortical PE representations in behavioral reinforcement learning following negative reinforcement is relatively unexplored. We recorded EEG while participants completed a task with matched positive and negative reinforcement outcome modalities, with parametrically manipulated single-trial outcomes producing positive and negative PEs. We first demonstrated that PEs systematically influence future behavior in both positive and negative reinforcement conditions. In negative reinforcement conditions, mediofrontal ERPs positively signaled unsigned PEs in a time window encompassing the P2 potential, and negatively signaled signed PEs for a time window encompassing the FRN/RewP and frontal P3 (an "aversion positivity"). Central delta power increased parametrically with increasingly aversive outcomes, contributing to the "aversion positivity". Finally, negative reinforcement ERPs correlated with RTs on the following trial, suggesting cortical PEs guide behavioral adaptations. Positive reinforcement PEs did not influence ERP or time-frequency activity, despite significant behavioral effects. These results demonstrate that mediofrontal PE signals are a mechanism underlying negative reinforcement learning, and that delta power increases for aversive outcomes might contribute to the "aversion positivity."
Keywords: Feedback-related negativity (FRN); Negative reinforcement; Prediction error; Reinforcement learning; Reward positivity (RewP); Salience; Signed; Unsigned; Value.
Copyright © 2021 Elsevier Ltd. All rights reserved.
Conflict of interest statement
Declaration of competing interest The authors declare no competing financial interests.
Figures
Similar articles
-
Feedback-Related Negativity and Frontal Midline Theta Reflect Dissociable Processing of Reinforcement.Front Hum Neurosci. 2020 Jan 9;13:452. doi: 10.3389/fnhum.2019.00452. eCollection 2019. Front Hum Neurosci. 2020. PMID: 31998100 Free PMC article.
-
Posttraumatic reexperiencing and alcohol use: mediofrontal theta as a neural mechanism for negative reinforcement.bioRxiv [Preprint]. 2023 Dec 18:2023.07.12.547253. doi: 10.1101/2023.07.12.547253. bioRxiv. 2023. Update in: J Psychopathol Clin Sci. 2025 Apr;134(3):308-318. doi: 10.1037/abn0000925. PMID: 37502872 Free PMC article. Updated. Preprint.
-
Posttraumatic reexperiencing and alcohol use: Mediofrontal theta as a neural mechanism for negative reinforcement.J Psychopathol Clin Sci. 2025 Apr;134(3):308-318. doi: 10.1037/abn0000925. Epub 2025 Feb 3. J Psychopathol Clin Sci. 2025. PMID: 39899115 Free PMC article.
-
Beyond the FRN: Broadening the time-course of EEG and ERP components implicated in reward processing.Int J Psychophysiol. 2018 Oct;132(Pt B):184-202. doi: 10.1016/j.ijpsycho.2018.02.002. Epub 2018 Feb 15. Int J Psychophysiol. 2018. PMID: 29454641 Review.
-
Feedback processing in cognitive and motor tasks: A meta-analysis on the feedback-related negativity.Psychophysiology. 2023 Dec;60(12):e14439. doi: 10.1111/psyp.14439. Epub 2023 Sep 26. Psychophysiology. 2023. PMID: 37750509 Review.
Cited by
-
Can Social Norms Promote Recycled Water Use on Campus? The Evidence From Event-Related Potentials.Front Psychol. 2022 Feb 4;13:818292. doi: 10.3389/fpsyg.2022.818292. eCollection 2022. Front Psychol. 2022. PMID: 35185735 Free PMC article.
-
The cerebellum contributes to prediction error coding in reinforcement learning in humans.J Neurosci. 2025 Mar 26;45(19):e1972242025. doi: 10.1523/JNEUROSCI.1972-24.2025. Online ahead of print. J Neurosci. 2025. PMID: 40139806
-
Parametric Cortical Representations of Complexity and Preference for Artistic and Computer-Generated Fractal Patterns Revealed by Single-Trial EEG Power Spectral Analysis.Neuroimage. 2021 Aug 1;236:118092. doi: 10.1016/j.neuroimage.2021.118092. Epub 2021 Apr 23. Neuroimage. 2021. PMID: 33895307 Free PMC article.
-
Negative urgency as a risk factor for hazardous alcohol use: Dual influences of cognitive control and reinforcement processing.Neuropsychologia. 2021 Oct 15;161:108009. doi: 10.1016/j.neuropsychologia.2021.108009. Epub 2021 Aug 26. Neuropsychologia. 2021. PMID: 34454939 Free PMC article.
-
Frontal midline theta differentiates separate cognitive control strategies while still generalizing the need for cognitive control.Sci Rep. 2021 Jul 19;11(1):14641. doi: 10.1038/s41598-021-94162-z. Sci Rep. 2021. PMID: 34282209 Free PMC article.
References
-
- Benjamini Y, & Hochberg Y (1995). Controlling the False Discovery Rate: A Practical and Powerful Approach to Multiple Testing. Journal of the Royal Statistical Society. Series B (Methodological), 57(1), 289–300. JSTOR.
Publication types
MeSH terms
Grants and funding
LinkOut - more resources
Full Text Sources
Other Literature Sources
