. 2022 Jan 29;74(2):237-245.
doi: 10.1093/cid/ciab380.

Severe Acute Respiratory Syndrome Coronavirus 2 (SARS-CoV-2) Sequence Characteristics of Coronavirus Disease 2019 (COVID-19) Persistence and Reinfection

Affiliations

Severe Acute Respiratory Syndrome Coronavirus 2 (SARS-CoV-2) Sequence Characteristics of Coronavirus Disease 2019 (COVID-19) Persistence and Reinfection

Manish C Choudhary et al. Clin Infect Dis. .

Abstract

Background: Both severe acute respiratory syndrome coronavirus 2 (SARS-CoV-2) reinfection and persistent infection have been reported, but sequence characteristics in these scenarios have not been described. We assessed published cases of SARS-CoV-2 reinfection and persistence, characterizing the hallmarks of reinfecting sequences and the rate of viral evolution in persistent infection.

Methods: A systematic review of PubMed was conducted to identify cases of SARS-CoV-2 reinfection and persistence with available sequences. Nucleotide and amino acid changes in the reinfecting sequence were compared with both the initial and contemporaneous community variants. Time-measured phylogenetic reconstruction was performed to compare intrahost viral evolution in persistent SARS-CoV-2 to community-driven evolution.

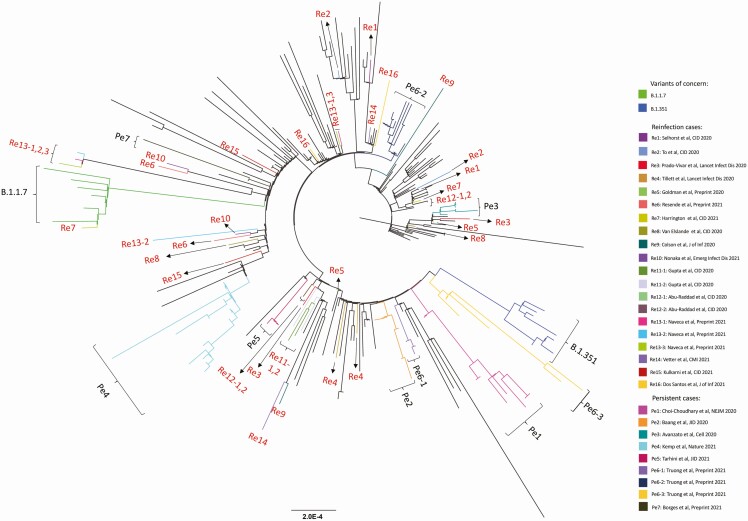
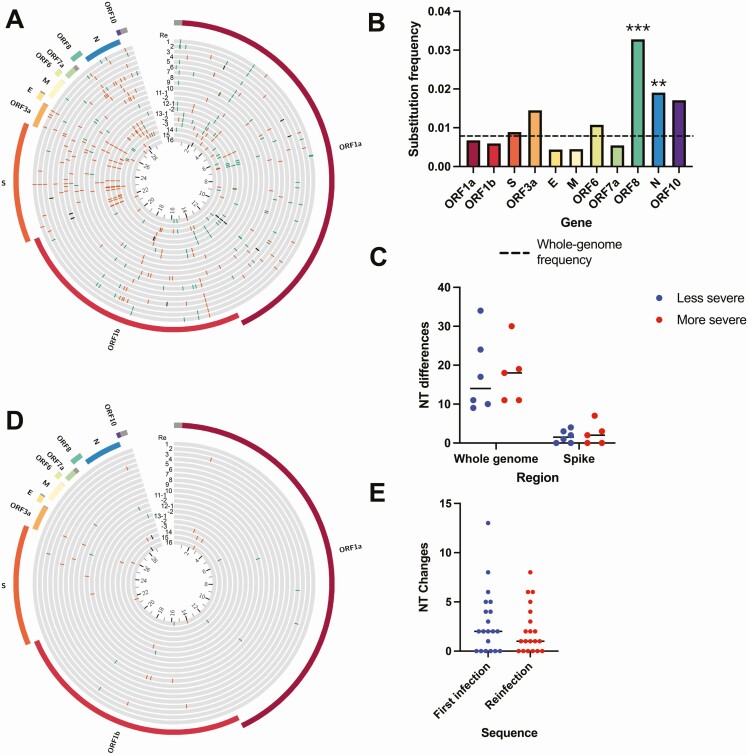
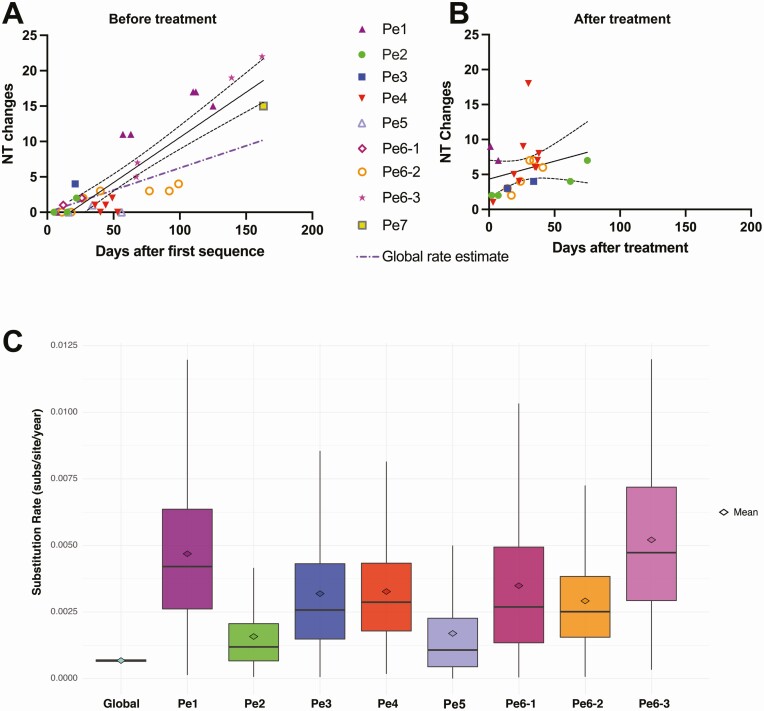
Results: Twenty reinfection and 9 persistent infection cases were identified. Reports of reinfection cases spanned a broad distribution of ages, baseline health status, reinfection severity, and occurred as early as 1.5 months or >8 months after the initial infection. The reinfecting viral sequences had a median of 17.5 nucleotide changes with enrichment in the ORF8 and N genes. The number of changes did not differ by the severity of reinfection and reinfecting variants were similar to the contemporaneous sequences circulating in the community. Patients with persistent coronavirus disease 2019 (COVID-19) demonstrated more rapid accumulation of sequence changes than seen with community-driven evolution with continued evolution during convalescent plasma or monoclonal antibody treatment.

Conclusions: Reinfecting SARS-CoV-2 viral genomes largely mirror contemporaneous circulating sequences in that geographic region, while persistent COVID-19 has been largely described in immunosuppressed individuals and is associated with accelerated viral evolution.

Keywords: SARS-CoV-2; immunosuppression; persistent COVID-19; reinfection; sequence analysis.


Figures

Figure 1.
Figure 1.
Maximum-likelihood phylogenetic tree of sequences from persistent COVID-19 cases (Pe1–Pe7), COVID-19 reinfection cases (Re1–Re16), the variants of concern B.1.1.7 and B.1.351, and globally sampled sequences from GISAID. Abbreviations: CID, Clinical Infectious Diseases; COVID-19, coronavirus disease 2019; NEJM, New England Journal of Medicine; Lancet Infect Dis, Lancet Infectious Diseases; J of Inf, Journal of Infection; Emerg Infect Dis, Emerging Infectious Diseases; CMI, Clinical Microbiology and Infection; JID, Journal of Infectious Diseases .
Figure 2.
Figure 2.
Comparison of viral sequences from reinfection cases. (A) Circos plot showing location of nucleotide changes in the reinfecting sequence relative to the initial infection sequence for each of the 20 cases. The inner ring indicates nucleotide position in kilobases. Synonymous changes are in green, nonsynonymous changes in orange, deletions in black. (B) Nucleotide substitution frequency pooled across all reinfection cases for each SARS-CoV-2 gene. The dashed line indicates global substitution frequency across the whole genome. Substitution frequency for each gene was compared with the substitution frequency in the rest of the genome using Fisher’s exact tests. P values were corrected for multiple comparisons using the Bonferroni correction. **P < .01, and ***P < .001. (C) Nucleotide changes in the second infection relative to the first infection by clinical disease severity. Mutations shown for the whole genome and S gene. P = .67, Mann-Whitney test. (D) Circos plot showing the location of nucleotide mutations from the second infection relative to other viruses circulating at the same time in the same geographic region. Only rare mutations present in <1% of contemporaneous community sequences are shown. (E) Number of rare nucleotide polymorphisms at each time point relative to circulating sequences in the community. P = .26, Wilcoxon matched-pairs signed-rank test. Abbreviations: E, envelope; M, membrane; NT, nucleotide; N, nucleocapsid; ORF, open reading frame; S, spike; SARS-CoV-2, severe acute respiratory syndrome coronavirus 2.
Figure 3.
Figure 3.
SARS-CoV-2 mutation location and evolutionary rate in the persistent COVID-19 cases. (A) Nucleotide substitution frequency pooled across all persistent cases for each SARS-CoV-2 gene. The dashed line indicates global substitution frequency across the whole genome. Substitution frequency for each gene was compared with the substitution frequency in the rest of the genome using Fisher’s exact tests. P values were corrected for multiple comparisons using the Bonferroni correction. *P < .05, and ***P < .001. (B) Nucleotide changes in samples taken prior to convalescent plasma or monoclonal antibody treatment relative to first sampled sequence in each persistently infected patient. Regression line and 95% confidence bands are shown. The purple dash-dotted line is the global rate estimate obtained from Nextstrain. (C) Nucleotide changes in samples taken after convalescent plasma or monoclonal antibody treatment relative to the last sample taken prior to treatment in each persistently infected patient. Regression line and 95% confidence bands are shown. (D) Substitution rate (nucleotide substitutions per site per year) of sampled global SARS-CoV-2 sequences relative to persistent patients based on Markov chain Monte Carlo time-measured phylogenetic reconstruction. Box plots show median and interquartile ranges of estimated substitution rates. The mean, median, and 95% HPD interval can be found in Supplementary Table 4. Abbreviations: COVID-19, coronavirus disease 2019; HPD, highest posterior density; Nt, nucleotide; Pe, persistent; SARS-CoV-2, severe acute respiratory syndrome coronavirus 2.

Comment in

References

    1. Dan JM, Mateus J, Kato Y, et al. . Immunological memory to SARS-CoV-2 assessed for up to 8 months after infection. Science 2021; 371. - PMC - PubMed
    1. Van Elslande J, Vermeersch P, Vandervoort K, et al. . Symptomatic SARS-CoV-2 reinfection by a phylogenetically distinct strain. Clin Infect Dis 2021; 73:354–6. - PMC - PubMed
    1. To KK, Hung IF, Ip JD, et al. . COVID-19 re-infection by a phylogenetically distinct SARS-coronavirus-2 strain confirmed by whole genome sequencing. Clin Infect Dis 2021; 73:e2946–51. - PMC - PubMed
    1. Tillett RL, Sevinsky JR, Hartley PD, et al. . Genomic evidence for reinfection with SARS-CoV-2: a case study. Lancet Infect Dis 2021; 21:52–8. - PMC - PubMed
    1. Selhorst P, Van Ierssel S, Michiels J, et al. . Symptomatic SARS-CoV-2 reinfection of a health care worker in a Belgian nosocomial outbreak despite primary neutralizing antibody response. Clin Infect Dis 2021; 73:e2985–91. - PMC - PubMed

Publication types