Review
. 2021 Oct;16(10):1565-1577.
doi: 10.2215/CJN.14010820. Epub 2021 Apr 27.

Urinary Cell mRNA Profiles Predictive of Human Kidney Allograft Status

Affiliations
Review

Urinary Cell mRNA Profiles Predictive of Human Kidney Allograft Status

Michelle L Lubetzky et al. Clin J Am Soc Nephrol. 2021 Oct.

Abstract

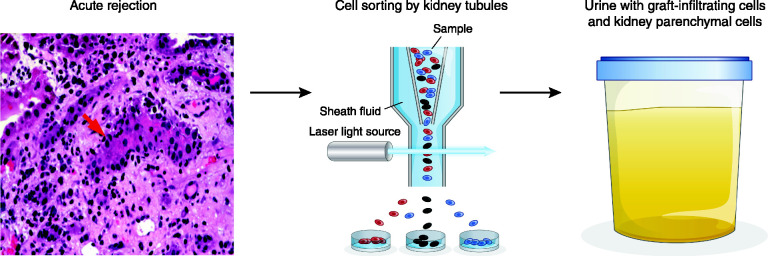
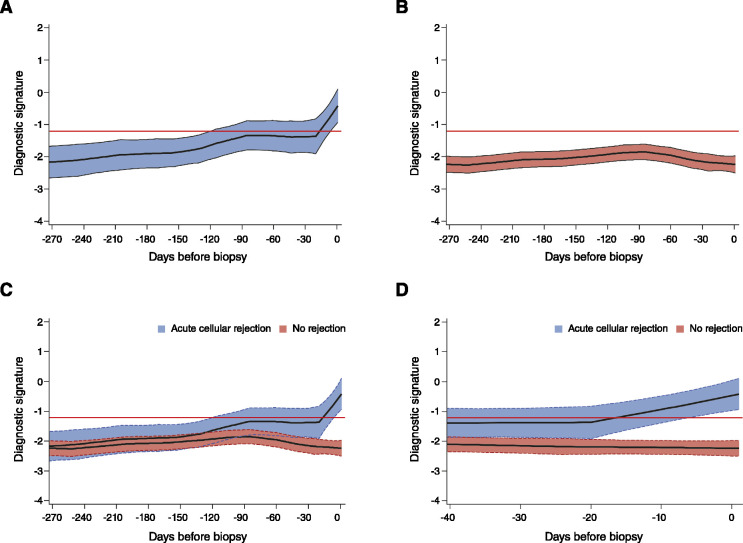
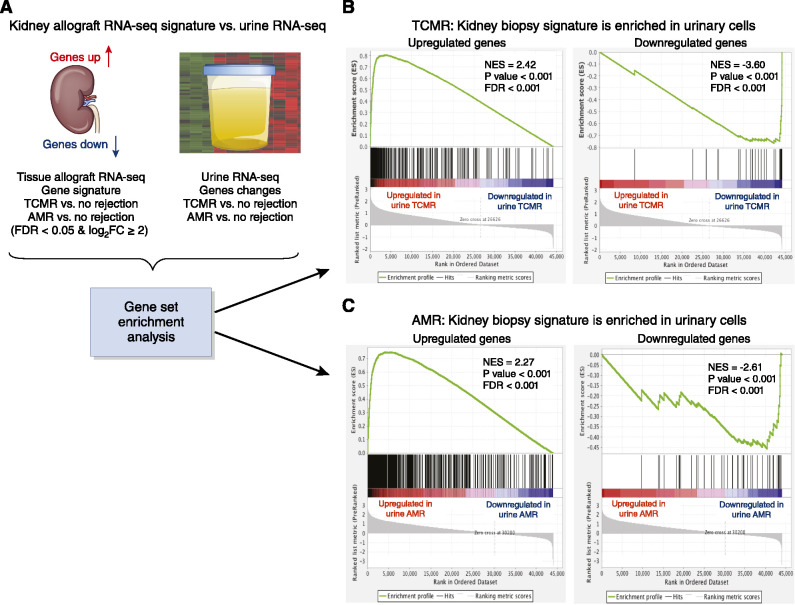
Immune monitoring of kidney allograft recipients and personalized therapeutics may help reach the aspirational goal of "one transplant for life." The invasive kidney biopsy procedure, the diagnostic tool of choice, has become safer and the biopsy classification more refined. Nevertheless, biopsy-associated complications, interobserver variability in biopsy specimen scoring, and costs continue to be significant concerns. The dynamics of the immune repertoire make frequent assessments of allograft status necessary, but repeat biopsies of the kidney are neither practical nor safe. To address the existing challenges, we developed urinary cell mRNA profiling and investigated the diagnostic, prognostic, and predictive accuracy of absolute levels of a hypothesis-based panel of mRNAs encoding immunoregulatory proteins. Enabled by our refinements of the PCR assay and by investigating mechanistic hypotheses, our single-center studies identified urinary cell mRNAs associated with T cell-mediated rejection, antibody-mediated rejection, interstitial fibrosis and tubular atrophy, and BK virus nephropathy. In the multicenter National Institutes of Health Clinical Trials in Organ Transplantation-04, we discovered and validated a urinary cell three-gene signature of T-cell CD3 ε chain mRNA, interferon gamma inducible protein 10 (IP-10) mRNA, and 18s ribosomal RNA that is diagnostic of subclinical acute cellular rejection and acute cellular rejection and prognostic of acute cellular rejection and graft function. The trajectory of the signature score remained flat and below the diagnostic threshold for acute cellular rejection in the patients with no rejection biopsy specimens, whereas a sharp rise was observed during the weeks before the biopsy specimen that showed acute cellular rejection. Our RNA sequencing and bioinformatics identified kidney allograft biopsy specimen gene signatures of acute rejection to be enriched in urinary cells matched to acute rejection biopsy specimens. The urinary cellular landscape was more diverse and more enriched for immune cell types compared with kidney allograft biopsy specimens. Urinary cell mRNA profile-guided clinical trials are needed to evaluate their value compared with current standard of care.

Keywords: acute allograft rejection; allografts; gene expression; kidney biopsy; kidney transplantation; kidney transplantation series; mRNA; urinary cell mRNA.


Figures

Figure 1.
Figure 1.
Formulation that a kidney allograft functions as an in vivo flow cytometer. Acute T cell–mediated rejection is characterized by the infiltration of the kidney allograft by T cells, macrophages, and other cell types. The concurrent presence of graft-infiltrating cells in the interstitial space and the presence of cells within the tubules (tubulitis) are the histologic hallmarks of T cell–mediated rejection. In our conceptualization, a kidney allograft undergoing acute T cell–mediated rejection functions as an in vivo flow cytometer and sorts graft-infiltrating cells and targeted graft parenchymal cells into the urinary space; therefore, profiling of urinary cells for their gene expression pattern offers a noninvasive means of diagnosing acute T cell–mediated rejection. Adapted from ref. , with permission.
Figure 2.
Figure 2.
Retrospective trajectory of diagnostic signature in acute cellular rejection and no rejection. The average within-person retrospective trajectory of the diagnostic signature (i.e., the trajectory as a function of the time before biopsy) in urine samples obtained at or before biopsy (which passed quality control) is shown (A) for the group of 38 patients with first biopsy specimens showing acute cellular rejection (201 urine samples) and (B) the group of 113 patients with specimens showing no rejection (833 urine samples). Only specimens obtained during the first 400 days after transplantation were included. (C) The diagnostic signature remained relatively flat and well below the −1.213 threshold that was diagnostic of acute cellular rejection during the 270 days before biopsy in the group of patients with findings showing no rejection. (D) There was a significant difference in the trajectories between the two groups, with a marked increase in the diagnostic signature during the 20-day period before the first specimen showing acute cellular rejection (P<0.001). The y-axis values are diagnostic signature scores without intrinsic units of measurement; they were calculated from the logistic regression equation (−6.1487+0.8534 log10[CD3ε/18S]+0.6376 log10[IP-10/18S]+1.6464 log10[18S]) as follows. Absolute levels of CD3ε mRNA, IP-10 mRNA, and 18S rRNA in the cells from each urine sample were measured by PCR assay, with the units of measurement being copies per microgram of total RNA for each mRNA measure, and copies (×10−6) per microgram of total RNA for 18S rRNA. The mRNA copy numbers were 18S normalized by dividing the mRNA copy number by the 18S rRNA copy number in the same sample, and the ratio was log10 transformed. In all of the panels, the black lines indicate the trajectory, the colored bands the 95% confidence interval, and the red lines the diagnostic threshold. Adapted from ref. , with permission.
Figure 3.
Figure 3.
Kidney allograft biopsy specimen gene signatures are enriched in urinary cells. Kidney allograft biopsy specimen signatures derived by RNA sequencing (RNA-seq) of 49 biopsy specimens from 49 patients. (A) Gene-set enrichment analysis was performed to compare biopsy specimen gene signatures with urinary cell gene expression patterns. (B) The upregulated gene signature from T cell–mediated rejection (TCMR) biopsy specimens versus specimens showing no rejection is also significantly upregulated in the TCMR urine versus urine showing no rejection: normalized enrichment score (NES)=2.42, P<0.001, false discovery rate (FDR)<0.001. The downregulated gene signature in TCMR biopsy specimens versus specimens showing no rejection was also enriched in TCMR urine versus no-rejection urine: NES=−3.60, P<0.001, FDR<0.001. (C) The upregulated gene signature in antibody-mediated rejection (AMR) biopsy specimens versus specimens showing no rejection was significantly upregulated in AMR urine versus no-rejection urine: NES=2.27, P<0.001, FDR<0.001. The downregulated signature in AMR biopsy specimens versus no-rejection biopsy specimens was enriched in AMR urine versus no-rejection urine: NES=−2.61, P<0.001, FDR <0.001. The ranked list of genes in the biopsy specimen (x axis) and the enrichment score (ES; y axis) are shown. A positive ES indicates the top-ranked genes in the biopsy specimen are enriched in urinary cells. The top portion of the plot shows the ES (green line). The ES for this gene set is the score at the peak of the plot. The middle portion shows where urinary cell genes appear in the ranked list of biopsy specimen genes. The bottom portion shows the value of the ranking metric moving down the list of ranked genes, and goes from positive (correlation with TCMR) to negative (correlation with no rejection). The NES accounts for differences in gene-set size and correlations between the urine and biopsy specimen gene sets. The FDR is the estimated probability that a gene set with a given NES represents a false positive. Adapted from ref. , with permission. FC, fold change.
Figure 4.
Figure 4.
Preliminary consort diagrams for two potential randomized clinical trials (RCTs) to evaluate the utility of the Clinical Trials in Organ Transplantation-04 three-gene (18S-normalized CD3ε mRNA, 18S-normalized IP-10 mRNA, and 18S rRNA) signature diagnostic of acute cellular rejection. (A) Single-center RCT to evaluate the efficacy of preemptive antirejection therapy to prevent acute cellular rejection. Starting 30 days post-transplant, eligible patients with kidney allografts would be screened biweekly for elevated levels of the three-gene signature. Inclusion criteria: single kidney transplant, adult recipients (>18 years of age), single kidney graft, and stable graft function. Exclusion criteria: multiorgan recipient, rejection in the preceding 30 days, recipient or donor positive for hepatitis C virus recipient or donor, HIV+ recipient or donor, three-gene signature score greater than −1.213. Upon detection of an elevated signature score postenrollment, the patient would be randomized to 7 days of preemptive treatment with either low-dose steroids (e.g., 60 mg, oral, per day, active arm) or placebo. The primary outcomes would be (1) incident biopsy specimen–confirmed acute rejection during the 3 months post-randomization; and (2) a composite end point of incident biopsy specimen–confirmed acute rejection, the presence of subclinical acute rejection, Banff grade II or more interstitial fibrosis/tubular atrophy (IF/TA), arteriolar hyalinosis, donor-specific anti-HLA antibodies, C4d deposition in the 12-month surveillance biopsy specimen, graft loss, or death. Secondary end points: kidney allograft functional status (eGFR, incidence and degree of albuminuria [measured by albumin-creatinine ratio]), incidence of BK virus replication, incidence of BK virus nephropathy, and incidence of cytomegalovirus disease. (B) Single-center RCT to evaluate the efficacy of urinary cell three-gene signature to facilitate a 50% reduction in tacrolimus dosage. At 12 months post-transplant, eligible, consented patients would undergo a stepwise reduction in tacrolimus dosage to 50% of pre-enrollment dosage. The patients will be randomized to either a biweekly monitoring of three-gene signature arm or no three-gene signature monitoring arm. In those assigned to the urinary cell mRNA monitoring arm, stepwise reduction will stop if the score is greater than −1.213. Both groups would receive standard-of-care monitoring for graft dysfunction, with for-cause biopsies and treatment as indicated for the next 12 months. At 12 months post-randomization, all patients would be evaluated for overt graft dysfunction and have a protocol biopsy for the detection of subclinical rejection and/or graft dysfunction. The primary outcomes would be (1) a composite end point of incident biopsy specimen–confirmed acute rejection, the presence of subclinical acute rejection, Banff grade II or more IF/TA, arteriolar hyalinosis, donor-specific anti-HLA antibodies, C4d deposition in the 12-month surveillance biopsy specimen, graft loss, or death; and (2) cumulative tacrolimus dosage. Secondary end points: kidney allograft functional status (eGFR, incidence and degree of albuminuria [measured by albumin-creatinine ratio]), incidence of BK virus replication, incidence of BK virus nephropathy, and incidence of cytomegalovirus disease. An independent data safety monitoring board will monitor these institutional review board–approved trials. Tx, treatment.

Similar articles

Cited by

References

    1. Stegall MD, Gaston RS, Cosio FG, Matas A: Through a glass darkly: Seeking clarity in preventing late kidney transplant failure. J Am Soc Nephrol 26: 20–29, 2015 - PMC - PubMed
    1. Wolfe RA, Ashby VB, Milford EL, Ojo AO, Ettenger RE, Agodoa LY, Held PJ, Port FK: Comparison of mortality in all patients on dialysis, patients on dialysis awaiting transplantation, and recipients of a first cadaveric transplant. N Engl J Med 341: 1725–1730, 1999 - PubMed
    1. Hart A, Smith JM, Skeans MA, Gustafson SK, Wilk AR, Castro S, Foutz J, Wainright JL, Snyder JJ, Kasiske BL, Israni AK: OPTN/SRTR 2018 annual data report: Kidney. Am J Transplant 20[Supp 1]: 20–130, 2020 - PubMed
    1. Veronese FV, Manfro RC, Roman FR, Edelweiss MI, Rush DN, Dancea S, Goldberg J, Gonçalves LF: Reproducibility of the Banff classification in subclinical kidney transplant rejection. Clin Transplant 19: 518–521, 2005 - PubMed
    1. Furness PN, Taub N; Convergence of European Renal Transplant Pathology Assessment Procedures (CERTPAP) Project : International variation in the interpretation of renal transplant biopsies: Report of the CERTPAP Project [published correction appears in Kidney Int 60: 2429, 2001]. Kidney Int 60: 1998–2012, 2001 - PubMed

Publication types

MeSH terms