. 2021 May 4;118(18):e2018181118.
doi: 10.1073/pnas.2018181118.

High-throughput functional variant screens via in vivo production of single-stranded DNA

Affiliations

High-throughput functional variant screens via in vivo production of single-stranded DNA

Max G Schubert et al. Proc Natl Acad Sci U S A. .

Abstract

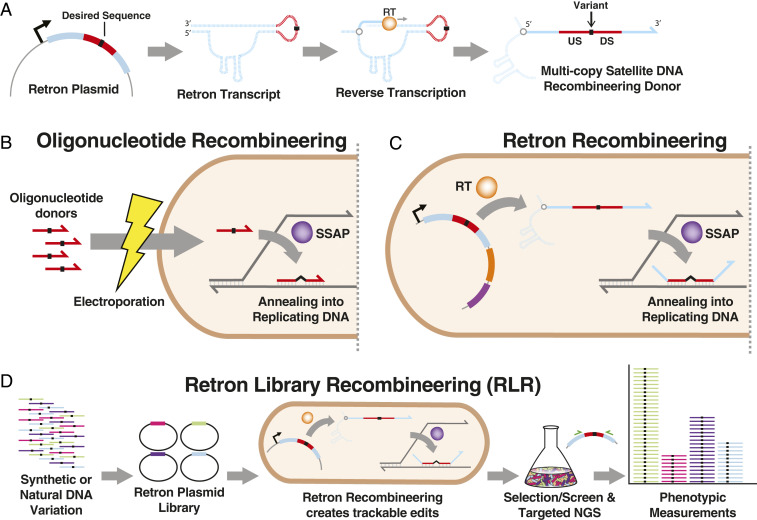
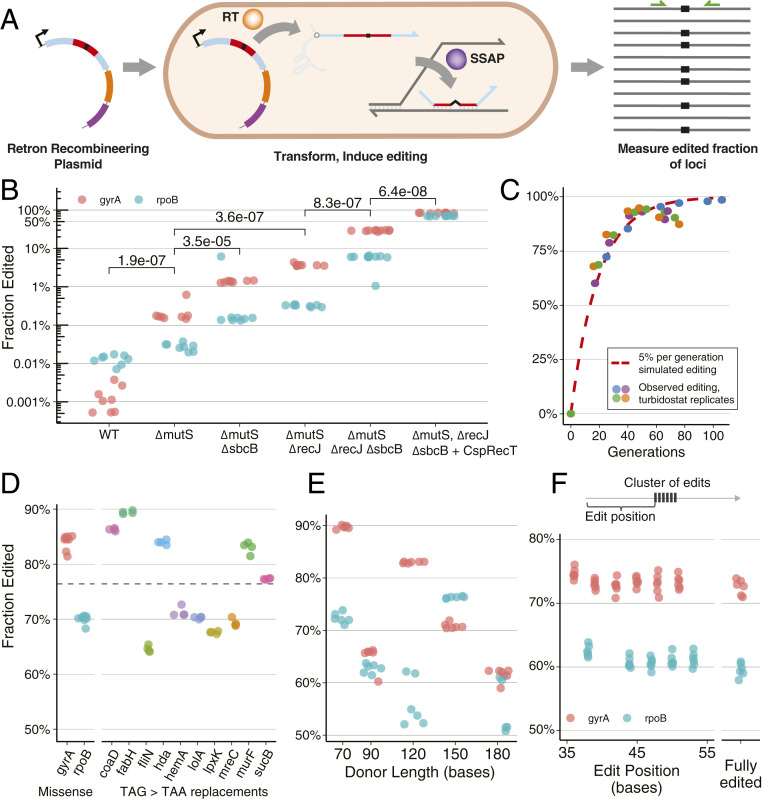
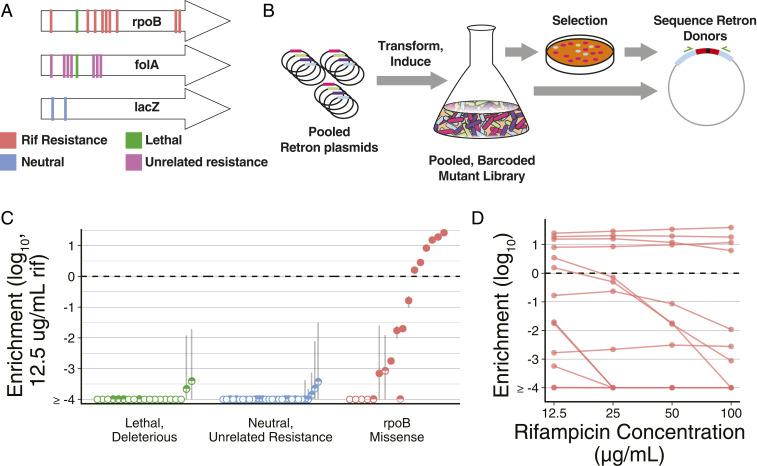
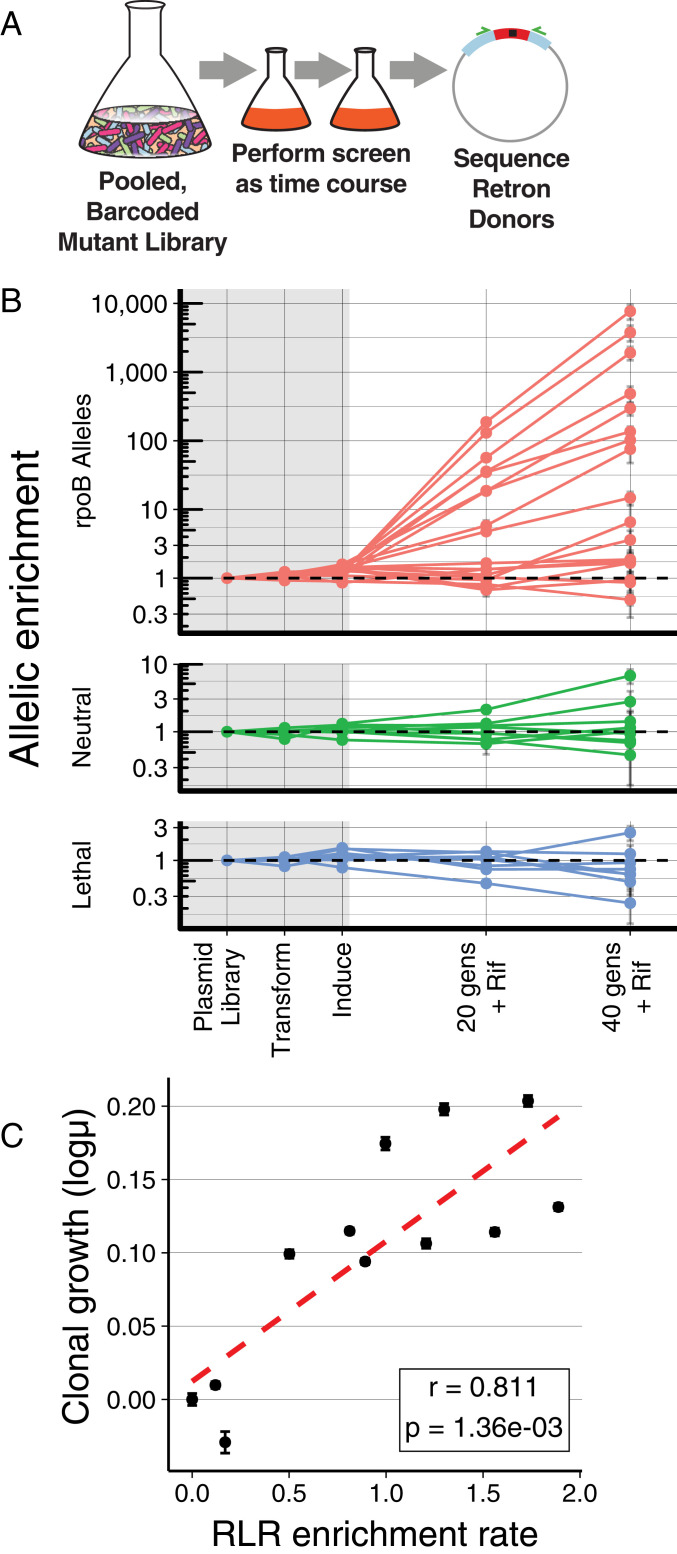
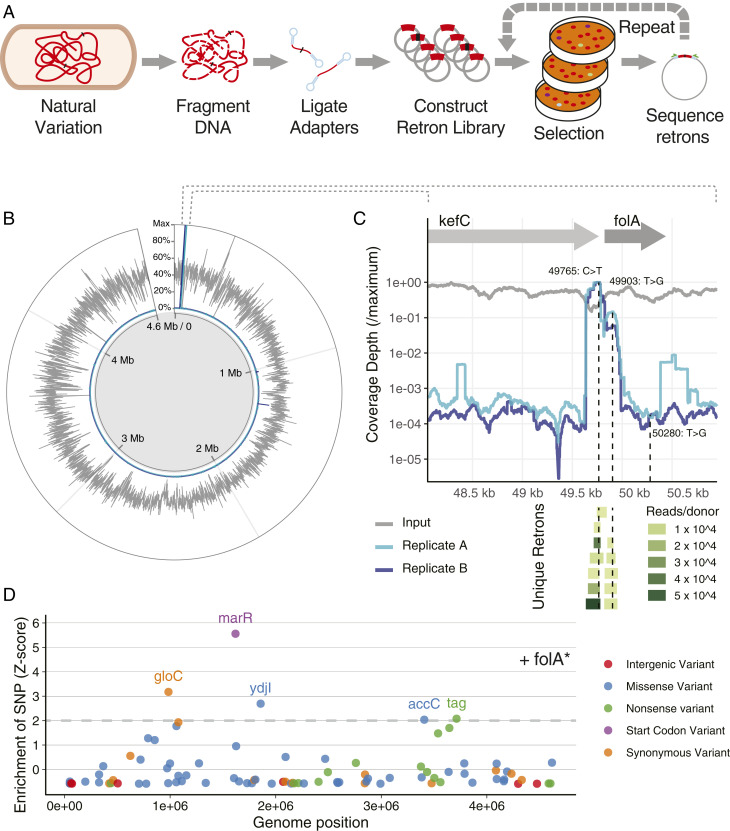
Creating and characterizing individual genetic variants remains limited in scale, compared to the tremendous variation both existing in nature and envisioned by genome engineers. Here we introduce retron library recombineering (RLR), a methodology for high-throughput functional screens that surpasses the scale and specificity of CRISPR-Cas methods. We use the targeted reverse-transcription activity of retrons to produce single-stranded DNA (ssDNA) in vivo, incorporating edits at >90% efficiency and enabling multiplexed applications. RLR simultaneously introduces many genomic variants, producing pooled and barcoded variant libraries addressable by targeted deep sequencing. We use RLR for pooled phenotyping of synthesized antibiotic resistance alleles, demonstrating quantitative measurement of relative growth rates. We also perform RLR using the sheared genomic DNA of an evolved bacterium, experimentally querying millions of sequences for causal variants, demonstrating that RLR is uniquely suited to utilize large pools of natural variation. Using ssDNA produced in vivo for pooled experiments presents avenues for exploring variation across the genome.

Keywords: antibiotic resistance; functional genomics; genetic engineering; retron; synthetic biology.


Conflict of interest statement

Competing interest statement: M.G.S., T.M.W., F.F., T.K.L., S.L.S., and G.M.C. have filed patent applications based on related work. T.K.L. is a cofounder of Senti Biosciences, Synlogic, Engine Biosciences, Tango Therapeutics, Corvium, BiomX, and Eligo Biosciences, in which he has related financial interests. T.K.L. also holds financial interests in nest.bio, Ampliphi, IndieBio, MedicusTek, Quark Biosciences, and Personal Genomics. G.M.C. is a cofounder of companies in which he has related financial interests: EnEvolv and 64-x. For a complete list of G.M.C.’s financial interests, see https://arep.med.harvard.edu/gmc/tech.html.

Figures

Fig. 1.
Fig. 1.
Overview of retron recombineering. (A) The retron msr/msd region undergoes transcription, then targeted reverse transcription catalyzed by retron reverse transciptase (RT), producing multicopy satellite DNA. When a sequence (red) containing homology upstream (US) and downstream (DS) of a sequence alteration (black) is introduced, this DNA functions as a recombineering donor. Dashed lines depict RNA, and solid lines depict DNA. (B) In oligonucleotide recombineering, synthetic oligonucleotide donors introduced into bacteria anneal to replicating DNA, directed by a single-stranded annealing protein (SSAP). This introduces desired sequence alterations (black) into the genome. (C) Retron recombineering uses RT-derived DNA as a donor, rather than transformed oligonucleotides, but similarly incorporates these into replicating DNA using an SSAP. (D) Libraries of synthetic or natural DNA variants can be incorporated into retrons to perform recombineering. This produces mutant cells bearing a retron plasmid, available for targeted amplicon sequencing using complementary primers (green) to measure mutant abundance in multiplex.
Fig. 2.
Fig. 2.
Characterization and optimization of retron recombineering. (A) A retron plasmid creates multicopy ssDNA via a retron RT. This DNA is incorporated into the genome via a coexpressed SSAP. Editing is observed by amplicon NGS, facilitated by primers targeting the locus (green). (B) Optimization of RLR. Colors differentiate gyrA and rpoB edits. Biological replicates are indicated with dots. Two-sided, unpaired parametric t tests were performed between genotypes indicated with brackets, and P values are displayed. (C) Editing of cultures in a turbidostat, with continuous growth and induction. ΔmutS ΔsbcB ΔrecJ genotype was used, transformed with gyrA-editing plasmid, expressing Redβ as an SSAP. These data are shown alongside a simulated editing trajectory of an allele with neutral fitness effect, editing at 5% per generation. (D) Edited fraction observed across alleles, after approximately 20 generations of induction and batch growth. A retron plasmid containing CspRecT as an SSAP was expressed in ΔmutS ΔrecJ ΔsbcB in all cases. Results of individual replicates are shown as dots. Results for gyrA and rpoB missense alleles (in B) are shown again for comparison alongside TAG > TAA stop codon editing for 10 essential genes. The mean edited fraction achieved across the 12 loci, 76.4%, is indicated by the dashed line. (E) The effect of retron length on editing. Six replicates for each experiment are indicated with dots colored by locus. (F) Integration of a cluster of mismatched bases in a retron donor. Editing of each position across eight replicates is shown for gyrA and rpoB alleles. Observations having all mutations are reported as fully edited.
Fig. 3.
Fig. 3.
Pooled measurement of phenotypes using RLR. (A) The rpoB mutations, including known rifampicin resistance alleles, were specified, as well as resistance alleles for unrelated drugs, and control alleles expected to be neutral, lethal, or deleterious (SI Appendix, Table S3). (B) A pool of Retron plasmids conferring these alleles are transformed into cells. Transformants are induced, and editing produces a pooled, barcoded mutant library. A selection is performed, and frequencies of retron donors are compared before and after treatment for each allele. (C) RLR enrichment values observed with rifampicin treatment. The median of three replicates is indicated with a dot, and error bars are the SE of the mean. Pseudocounts of one are given to alleles not detected after treatment, such that frequencies are a lower limit of detection in these cases. Unfilled points indicate alleles not detected among any replicates after rifampicin treatment, and half-filled points indicate alleles detected in a subset of replicates. An enrichment value of zero is marked with a horizontal dashed line, indicating identical relative abundance before and after selection. (D) For rpoB mutation, allelic enrichment across concentration of rifampicin is displayed. The median of three independent experiments is indicated with a dot, and lines connect an allele across concentrations of rifampicin.
Fig. 4.
Fig. 4.
Quantitative measurements using RLR. (A) Graphical representation of quantitative RLR during a time course. The relative abundance of pooled, barcoded mutants is measured over time by NGS. (B) Relative abundance of donors during an experiment. Frequencies of each allele are normalized to the median of neutral controls within each time point, and to their starting abundance in the plasmid pool. Measurements within the gray rectangle occur during construction, transformation, and induction of the library, whereas those in the white area occur during growth in subinhibitory rifampicin (5 μg/mL). The mean of three replicates is indicated with a dot; error bars are the standard error of the mean. Horizontal dashed lines indicate no change in frequency. (C) Growth rate of all mutants in the pool can be determined from the observed trajectories (RLR enrichment rate). Growth rate was measured individually for 11 resistance mutants using classical methods, and plotted against the log10 of RLR enrichment rate. Error bars depict standard error of these measurements; r is the Pearson’s correlation coefficient between these two measures, and the P is the probability of these results given the null hypothesis of no correlation.
Fig. 5.
Fig. 5.
Detecting causal variants in genomic DNA using retron libraries. (A) Graphical summary of an RLR experiment using genomic DNA (gDNA) as input. Adapters ligated to randomly fragmented gDNA enable pooled cloning, creating a multimillion member library of retron plasmids. Induction results in editing, and selection enriches for relevant mutants, whose retrons are sequenced as a pool via amplicon NGS. (B) Results of genomic DNA screen. Deduplicated genomic coverage contained in the retron library is displayed, showing the mean coverage across 1-kb base pair windows, normalizing to maximum coverage (gray; see SI Appendix, Fig. S9B for additional detail). After induction and selection of TMP, coverage depth of variants is depicted for two replicates of the library, again normalized to maximum coverage (blue, light blue). (C) The folA locus is displayed, with genomic position on the x axis. Sequence coverage observed for each base is plotted on the y axis for the input library and two replicates postselection, normalized to maximum coverage. Below, retron donor sequences observed more than 1,000 times in replicate A are depicted as a “pileup” aligned to the genome, and are colored by their abundance in postselection sequencing. Detected SNPs are indicated by vertical dashed lines. (D) Optionally, mutants surviving selection can be transformed by the pool again, screening for additional mutations and combinatorial effects. Transforming the library into a strain already bearing detected folA mutations (folA*) exposes additional candidate variants adaptive in additional TMP. Z scores for each allele describe their deviation from mean allele coverage depth. Variants with Z scores over two have been labeled by the gene in which they occur, colored by their relationship to coding sequences.

Similar articles

Cited by

References

    1. Baba T., et al. , Construction of Escherichia coli K-12 in-frame, single-gene knockout mutants: The Keio collection. Mol. Syst. Biol. 2, 2006.0008 (2006). - PMC - PubMed
    1. Richardson S. M., et al. , Design of a synthetic yeast genome. Science 355, 1040–1044 (2017). - PubMed
    1. C. A. Hutchison, 3rd, et al. , Design and synthesis of a minimal bacterial genome. Science 351, aad6253 (2016). - PubMed
    1. van Opijnen T., Camilli A., Transposon insertion sequencing: A new tool for systems-level analysis of microorganisms. Nat. Rev. Microbiol. 11, 435–442 (2013). - PMC - PubMed
    1. Warner J. R., Reeder P. J., Karimpour-Fard A., Woodruff L. B. A., Gill R. T., Rapid profiling of a microbial genome using mixtures of barcoded oligonucleotides. Nat. Biotechnol. 28, 856–862 (2010). - PubMed

Publication types

Substances