

Individual and social determinants of SARS-CoV-2 testing and positivity in Ontario, Canada: a population-wide study
- PMID: 33906966
- PMCID: PMC8177943
- DOI: 10.1503/cmaj.202608
Individual and social determinants of SARS-CoV-2 testing and positivity in Ontario, Canada: a population-wide study
Abstract
Background: Optimizing the public health response to reduce the burden of COVID-19 necessitates characterizing population-level heterogeneity of risks for the disease. However, heterogeneity in SARS-CoV-2 testing may introduce biased estimates depending on analytic design. We aimed to explore the potential for collider bias in a large study of disease determinants, and evaluate individual, environmental and social determinants associated with SARS-CoV-2 testing and diagnosis among residents of Ontario, Canada.
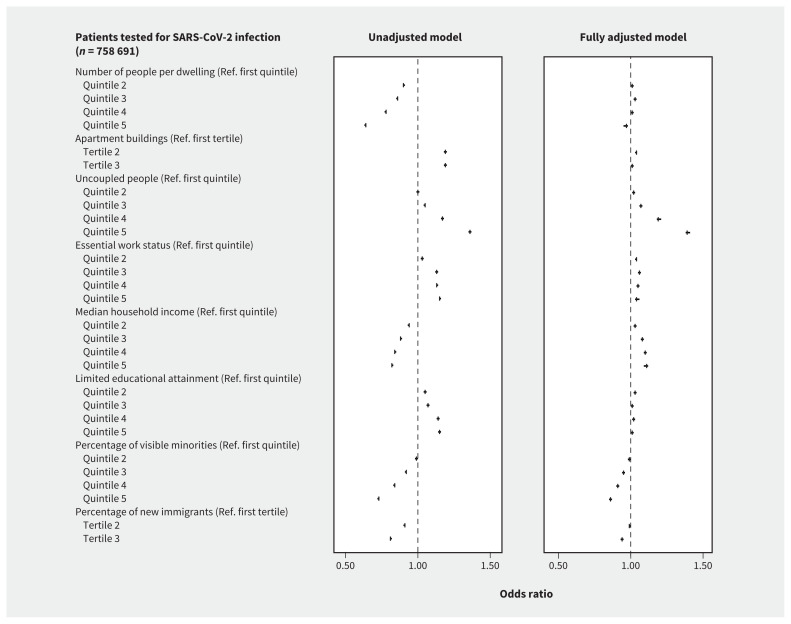
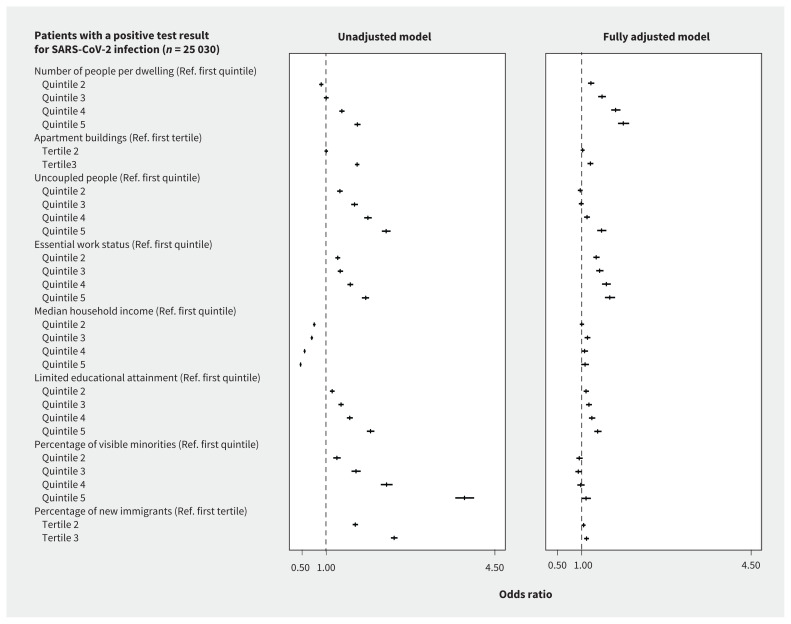
Methods: We explored the potential for collider bias and characterized individual, environmental and social determinants of being tested and testing positive for SARS-CoV-2 infection using cross-sectional analyses among 14.7 million community-dwelling people in Ontario, Canada. Among those with a diagnosis, we used separate analytic designs to compare predictors of people testing positive versus negative; symptomatic people testing positive versus testing negative; and people testing positive versus people not testing positive (i.e., testing negative or not being tested). Our analyses included tests conducted between Mar. 1 and June 20, 2020.
Results: Of 14 695 579 people, we found that 758 691 were tested for SARS-CoV-2, of whom 25 030 (3.3%) had a positive test result. The further the odds of testing from the null, the more variability we generally observed in the odds of diagnosis across analytic design, particularly among individual factors. We found that there was less variability in testing by social determinants across analytic designs. Residing in areas with the highest household density (adjusted odds ratio [OR] 1.86, 95% confidence interval [CI] 1.75-1.98), highest proportion of essential workers (adjusted OR 1.58, 95% CI 1.48-1.69), lowest educational attainment (adjusted OR 1.33, 95% CI 1.26-1.41) and highest proportion of recent immigrants (adjusted OR 1.10, 95% CI 1.05-1.15) were consistently related to increased odds of SARS-CoV-2 diagnosis regardless of analytic design.
Interpretation: Where testing is limited, our results suggest that risk factors may be better estimated using population comparators rather than test-negative comparators. Optimizing COVID-19 responses necessitates investment in and sufficient coverage of structural interventions tailored to heterogeneity in social determinants of risk, including household crowding, occupation and structural racism.
© 2021 CMA Joule Inc. or its licensors.
Conflict of interest statement
Competing interests: Adrienne Chan is a member of the board of Partners in Health Canada. Mackenzie Hamilton is currently serving an internship at AstraZeneca Canada in support of health research initiatives in lupus and severe asthma. No other competing interests were declared.
Figures

References
-
- Report of the WHO–China joint mission on coronavirus disease 2019 (COVID-19). Geneva: World Health Organization; 2020.
Publication types
MeSH terms
Substances
LinkOut - more resources
Full Text Sources
Other Literature Sources
Medical
Miscellaneous