. 2021 May 28;372(6545):eabg5298.
doi: 10.1126/science.abg5298. Epub 2021 Apr 27.

Socioeconomic status determines COVID-19 incidence and related mortality in Santiago, Chile

Affiliations

Socioeconomic status determines COVID-19 incidence and related mortality in Santiago, Chile

Gonzalo E Mena et al. Science. .

Abstract

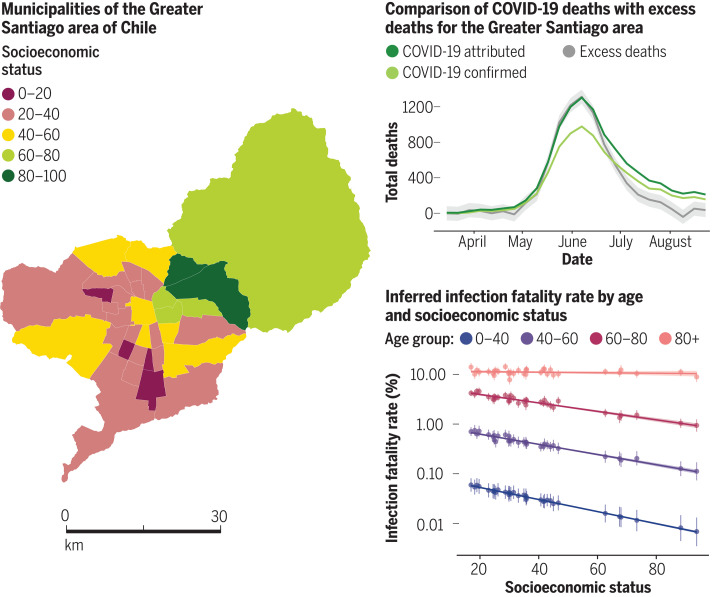
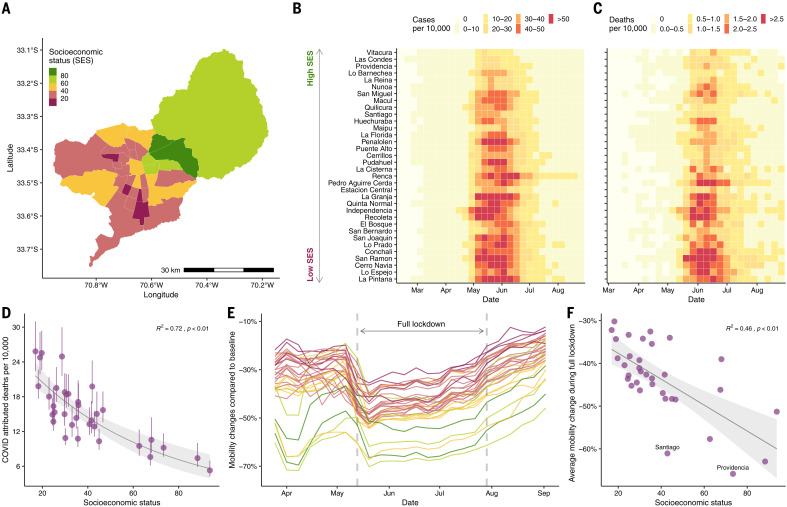
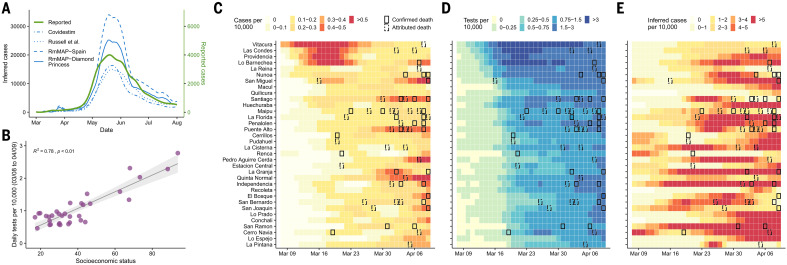
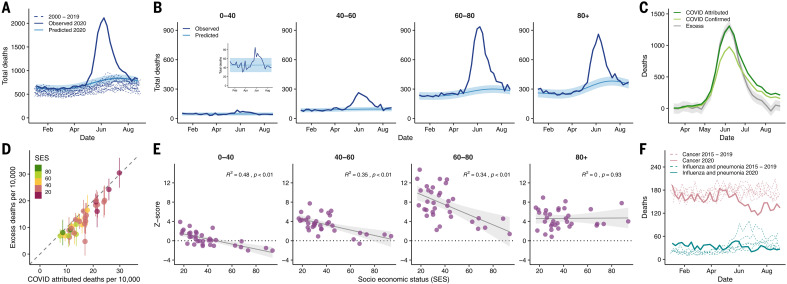
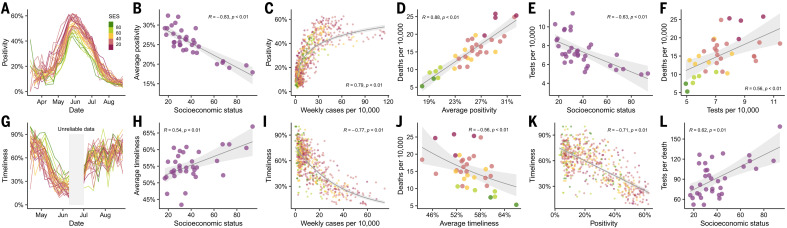
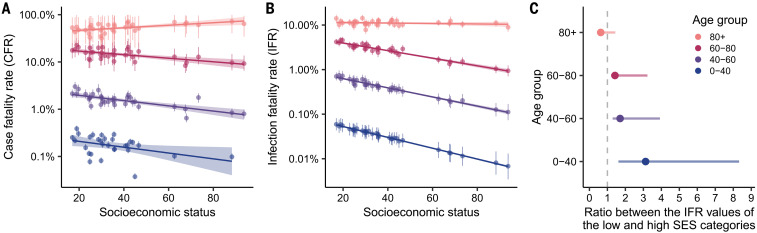
The COVID-19 pandemic has affected cities particularly hard. Here, we provide an in-depth characterization of disease incidence and mortality and their dependence on demographic and socioeconomic strata in Santiago, a highly segregated city and the capital of Chile. Our analyses show a strong association between socioeconomic status and both COVID-19 outcomes and public health capacity. People living in municipalities with low socioeconomic status did not reduce their mobility during lockdowns as much as those in more affluent municipalities. Testing volumes may have been insufficient early in the pandemic in those places, and both test positivity rates and testing delays were much higher. We find a strong association between socioeconomic status and mortality, measured by either COVID-19-attributed deaths or excess deaths. Finally, we show that infection fatality rates in young people are higher in low-income municipalities. Together, these results highlight the critical consequences of socioeconomic inequalities on health outcomes.


Figures

None
Effect of socioeconomic inequalities on COVID-19 outcomes.
The map on the left shows the municipalities that were included in this study, colored by their socioeconomic status score. For the comparison between COVID-19 deaths and excess deaths (top right), COVID-19–confirmed deaths are shown in light green and COVID-19–attributed deaths in dark green. Excess deaths, shown in gray, correspond to the difference between observed and predicted deaths. Predicted deaths were estimated using a Gaussian process model. The shading indicates 95% credible intervals for the excess deaths. The infection fatality rates (bottom right) were inferred by implementing a hierarchical Bayesian model, with vertical lines representing credible intervals by age and socioeconomic status.
Fig. 1
Fig. 1. SES, COVID-19 cases and deaths, and mobility data in Greater Santiago.
(A) Municipalities that are part of Greater Santiago are colored according to their SES, where a lower score is indicative of a lower SES. (B) COVID-19 cases normalized by population size per municipality. Municipalities are sorted by SES, starting with the one that has the highest SES at the top. (C) COVID-19–attributed deaths normalized by population size per municipality. (D) Age-adjusted COVID-19–attributed death rate and its association with SES. The dots and the whiskers represent the median and the 95% confidence intervals, respectively, reflecting uncertainty on the standard population used for weighting. R2, coefficient of determination. (E) Daily reduction in mobility by municipality colored by its SES value. (F) Average reduction in mobility during the full lockdown period and its association with SES. The urban and the business centers, Santiago and Providencia, respectively, experienced a greater reduction in mobility than expected based just on their socioeconomic profile. In (D) and (F), the shaded area indicates 95% regression confidence interval.
Fig. 2
Fig. 2. Inferred cases and reported tests conducted for the Greater Santiago area.
(A) Inferred and reported cases over time. For our RmMAP reconstructions, we considered the log-normal onset-to-death distribution described in (38) and two age-stratified IFR estimates, one from the Diamond Princess cruise ship (39) and another from a seroprevalence study in Spain (40). For comparison, we also present reconstructions based on the Covidestim method (41) and by the rescaling of case counts by the underreporting of estimates obtained with the method of Russell et al. (42). (B) Association between average daily tests and SES during the early peak. The early peak is defined as those cases reported between 8 March and 4 April. The shaded area indicates 95% regression confidence interval. (C) Reported cases per 10,000 by municipality during the early peak. (D) Tests per 10,000 by municipality during the early peak. (E) Inferred cases obtained from the RmMAP-Spain model per 10,000 by municipality during the early peak. For (C) to (E), the record of at least one COVID-19–confirmed or COVID-19–attributed death for that particular week is highlighted with solid or dashed boxes, respectively.
Fig. 3
Fig. 3. Excess deaths and its association with demographic and socioeconomic factors.
(A) Observed deaths (solid dark blue line) in Greater Santiago compared with predicted deaths for 2020 (solid light blue line and its confidence intervals shaded in lighter color), using a Gaussian process regression model built with historical mortality data from 2000 to 2019 (dashed blue lines). The values contain all the possible causes of deaths. (B) Age-specific trends of the observed deaths compared with the predicted deaths for 2020. (C) COVID-19 deaths versus excess deaths. COVID-19–confirmed deaths are shown in light green, whereas COVID-19–attributed deaths are shown in dark green. Excess deaths correspond to the difference between observed and predicted deaths. (D) Comparison of excess deaths and COVID-19–attributed deaths per municipality colored by SES and normalized by population size. (E) Monthly average of z scores of observed deaths between April and July by age group. The z scores correspond to the standard deviations over expected values. (F) Historical deaths due to influenza and pneumonia (teal dashed lines) and cancer (pink dashed lines) compared with the observed deaths during 2020 (solid lines). In (B), (C), and (E), the shaded region indicates 95% regression confidence interval.
Fig. 4
Fig. 4. Testing capacity and waiting times.
(A) Positivity over time. Positivity is defined as the proportion of PCR tests that are positive in a given week. (B) Association between average positivity and SES. (C) Association between positivity and weekly number of cases per 10,000. (D) Association between the overall age-adjusted number of deaths per 10,000 and the average positivity over the same period. (E) Association between average daily tests per 10,000 and SES. (F) Association between tests per 10,000 and deaths per 10,000. (G) Timeliness over time. Timeliness is defined as the proportion of PCR tests that appear in the public records within 1 week from the onset of symptoms. Two weeks in June (shaded in gray) were excluded from the analysis because of inconsistencies in data, leading to unreliable delay estimates. (H) Association between average timeliness and SES. (I) Association between timeliness and weekly number of cases per 10,000. (J) Association between the overall age-adjusted number of deaths per 10,000 and the average timeliness. (K) Association between timeliness and positivity. Dots are representative of weekly data per municipality. (L) Association between tests per death (age-adjusted) and SES. Figures with different dot colors illustrate the SES value according to the reference presented in (A). In (B) to (F) and (H) to (L), the shaded region indicates 95% regression confidence interval.
Fig. 5
Fig. 5. Inference of CFRs and IFRs by age and SES.
(A) Estimates of CFR by age and SES based on a simple assignment of cases to age groups. Our estimates of CFR have been validated by the official ICOVID platform (www.icovidchile.cl/), which confirmed that 119 out of the 136 observed CFRs fall within our confidence intervals. Confidence intervals are derived from a bootstrap procedure described in the supplementary materials. (B) Inferred IFR by age and SES using our ensemble of hierarchical Bayesian models, along with associated credible intervals. (C) IFR ratio between the low- and high-SES categories by age group. Four socioeconomic categories were defined based on SES quantiles: low, mid-low, mid-high, and high.

Update of

Comment in

Similar articles

Cited by

References

    1. Chang S., Pierson E., Koh P. W., Gerardin J., Redbird B., Grusky D., Leskovec J., Mobility network models of COVID-19 explain inequities and inform reopening. Nature 589, 82–87 (2021). 10.1038/s41586-020-2923-3 - DOI - PubMed
    1. Kraemer M. U. G., Yang C.-H., Gutierrez B., Wu C.-H., Klein B., Pigott D. M., du Plessis L., Faria N. R., Li R., Hanage W. P., Brownstein J. S., Layan M., Vespignani A., Tian H., Dye C., Pybus O. G., Scarpino S. V., Open COVID-19 Data Working Group , The effect of human mobility and control measures on the COVID-19 epidemic in China. Science 368, 493–497 (2020). 10.1126/science.abb4218 - DOI - PMC - PubMed
    1. Pullano G., Valdano E., Scarpa N., Rubrichi S., Colizza V., Evaluating the effect of demographic factors, socioeconomic factors, and risk aversion on mobility during the COVID-19 epidemic in France under lockdown: A population-based study. The Lancet Digital Health 2, e638–e649 (2020). 10.1016/S2589-7500(20)30243-0 - DOI - PMC - PubMed
    1. Chinazzi M., Davis J. T., Ajelli M., Gioannini C., Litvinova M., Merler S., Pastore Y Piontti A., Mu K., Rossi L., Sun K., Viboud C., Xiong X., Yu H., Halloran M. E., Longini I. M. Jr.., Vespignani A., The effect of travel restrictions on the spread of the 2019 novel coronavirus (COVID-19) outbreak. Science 368, 395–400 (2020). 10.1126/science.aba9757 - DOI - PMC - PubMed
    1. Lai S., Ruktanonchai N. W., Zhou L., Prosper O., Luo W., Floyd J. R., Wesolowski A., Santillana M., Zhang C., Du X., Yu H., Tatem A. J., Effect of non-pharmaceutical interventions to contain COVID-19 in China. Nature 585, 410–413 (2020). 10.1038/s41586-020-2293-x - DOI - PMC - PubMed

Publication types