. 2021 May 19;8(3):ENEURO.0168-21.2021.
doi: 10.1523/ENEURO.0168-21.2021. Print 2021 May-Jun.

Insulin-Dependent Maturation of Newly Generated Olfactory Sensory Neurons after Injury

Affiliations

Insulin-Dependent Maturation of Newly Generated Olfactory Sensory Neurons after Injury

Akihito Kuboki et al. eNeuro. .

Abstract

Loss of olfactory sensory neurons (OSNs) after injury to the olfactory epithelium (OE) triggers the generation of OSNs that are incorporated into olfactory circuits to restore olfactory sensory perception. This study addresses how insulin receptor-mediated signaling affects the functional recovery of OSNs after OE injury. Insulin levels were reduced in mice by ablating the pancreatic β cells via streptozotocin (STZ) injections. These STZ-induced diabetic and control mice were then intraperitoneally injected with the olfactotoxic drug methimazole to selectively ablate OSNs. The OE of diabetic and control mice regenerated similarly until day 14 after injury. Thereafter, the OE of diabetic mice contained fewer mature and more apoptotic OSNs than control mice. Functionally, diabetic mice showed reduced electro-olfactogram (EOG) responses and their olfactory bulbs (OBs) had fewer c-Fos-active cells following odor stimulation, as well as performed worse in an odor-guided task compared with control mice. Insulin administered intranasally during days 8-13 after injury was sufficient to rescue recovery of OSNs in diabetic mice compared with control levels, while insulin administration between days 1 and 6 did not. During this critical time window on days 8-13 after injury, insulin receptors are highly expressed and intranasal application of an insulin receptor antagonist inhibits regeneration. Furthermore, an insulin-enriched environment could facilitate regeneration even in non-diabetic mice. These results indicate that insulin facilitates the regeneration of OSNs after injury and suggest a critical stage during recovery (8-13 d after injury) during which the maturation of newly generated OSNs is highly dependent on and promoted by insulin.

Keywords: diabetes mellitus; electro-olfactogram; insulin; olfactory sensory neurons; regeneration; streptozotocin.


Figures

None
Graphical abstract
Figure 1.
Figure 1.
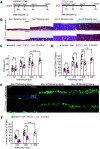
Decreased insulin for 90 d does not induce histologic changes in OE. A, B, Insr mRNA of uninjured OEs detected by in situ hybridization using digoxigenin-labeled antisense RNA and RNAscope probes. Representative image for an in situ hybridization using digoxigenin-labeled antisense RNA of Insr of an uninjured OE in a three-week-old mouse (n =2 mice; A) and image for an RNAscope assay against Insr shown as small brown dots on an uninjured OE of a 10-week-old mouse (n =2 mice; B). Signals were detected especially in the apical and bottom layers of the OE, where supporting cells and immature OSNs, respectively, are located (A, middle panel). Arrowheads indicate the non-homogeneous staining with higher level of Insr expression (A, B). Scale bars: 250 μm (low magnification) and 50 μm (higher magnification). C, Protocol of STZ treatment. STZ was intraperitoneally injected on days 0, 1, and 2. Mice with a fasting blood glucose (FBS) ≥250 mg/dl were considered diabetic. D, Fasted and fed blood glucose levels before and after STZ administration. Both fasted and fed blood glucose levels after STZ administration (post-STZ) were much higher than those before STZ administration (pre-STZ; Steel–Dwass test). E, Body weights before and after STZ administration. There was no significant difference (n.s.) in body weights between pre-STZ and post-STZ (Mann–Whitney U test). F, Experiment timelines for STZ mice obtained at 28 and 90 d, and saline-injected (intraperitoneally) control mice for comparison at 28 d. G, H, Representative coronal sections of nasal septa showing the OEs stained with hematoxylin and anti-OMP antibody (green) from STZ mice on day 28 (G) or day 90 (H) after saline injection. Left images, lower magnification; right upper (hematoxylin) and lower (OMP) images, higher magnifications of the OE depicted in the left photographs indicated by squares. Scale bars: 100 μm (lower magnification) and 50 μm (higher magnification). I, J, Thicknesses of the OEs (I) and density of OSNs (J) in STZ-d28, STZ-d90, and saline-d28 mice. There were no significant differences between STZ-d28 and STZ-d90 or STZ-d90 and saline-d28 mice (thickness: two-way RM ANOVA, day: F(1,15) = 0.17, p =0.682, treatment: F(1,15) = 4.21, p =0.058; interaction: F(1,15), p =0.800; number of OSNs: two-way RM ANOVA, day: F(1,15), p =0.725; treatment: F(1,15), p =0.913; interaction: F(1,15), p =0.595). Data points represent the value in the analyzed areas of OE [8 areas/mouse; saline-d28 (n =3 mice), STZ-d28 (n =3 mice), saline-d90 (n =3), STZ-d90 (n =2 mice)]. K, Odorant-evoked EOG responses to pentyl acetate at different concentrations in control and STZ mice on day 90 without injury. Similar response kinetics of the EOG were observed in control and STZ mice. L, Comparison of peak amplitudes in EOG recordings between control and STZ mice (n =6 mice/group) on day 90 without injury. Relative to control mice, the EOG amplitudes in response to each of all concentrations of pentyl acetate were not significantly different in STZ mice (two-way RM ANOVA, odor concentration: F(1,5) = 181.32, p <0.001; STZ treatment: F(1,5) = 1.16, p =0.330; interaction: F(1,5) = 0.950, p =0.374). Error bars, SD.
Figure 2.
Figure 2.
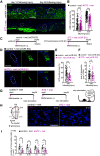
Decreased insulin disrupts OE recovery following methimazole-induced injury. A, Time course of the experimental design in both control and STZ mice. Methimazole was injected (intraperitoneally), and the tissues were fixed (fix.) after 3, 7, 14, and 28 d. B, Representative coronal sections of the nasal septa stained with hematoxylin 3, 7, 14, and 28 d after methimazole-induced injury in both control and STZ mice. Scale bars: 50 μm. C, D, The OE thicknesses (C; two-way RM ANOVA with Bonferroni’s post hoc correction, day: F(2,44) = 79.92, p <0.001; treatment: F(1,22) = 28.51, p <0.001; interaction: F(2,44) = 5.16, p =0.014) and the density of OSNs (D; two-way RM ANOVA with Bonferroni’s post hoc correction, day: F(1,22) = 131.27, p <0.001; treatment: F(1,22) = 40.89, p <0.001; interaction: F(1,22) = 4.38, p =0.048) for control, STZ, and saline-administered mice on days 7 (d7), 14 (d14), and 28 (d28) after methimazole-induced injury. On days 14 and 28, the OE thickness and density of OSNs in STZ mice were reduced significantly compared with those in control mice (**p <0.01, ***p <0.001; Bonferroni’s post hoc test). On day 28 following methimazole-induced injury, the thickness of the OEs and the density of OSNs in the control mice were restored to levels similar to those in saline-administered mice (n.s., not significant; Mann–Whitney U test). Data points represent the value in the analyzed areas of OE [8 areas/mouse; control (n =3 mice/time point), STZ (n =3 mice/time point)]. E, Representative coronal sections stained with anti-OMP antibody (green) 7, 14, and 28 d after methimazole-induced injury in control and STZ mice. Scale bar: 50 μm. F, Density of OMP-positive cells in control and STZ mice. Two-way RM ANOVA with Bonferroni’s post hoc correction, day: F(1,23) = 113.60, p <0.001; treatment: F(1,23) = 216.69, p <0.001; interaction: F(1,23) = 0.95, p =0.338. On days 14 and 28 following methimazole-induced injury, the density of OMP-positive cells was significantly lower in STZ mice than in control mice (***p <0.001; Bonferroni’s post hoc test). The density of OMP-positive cells in control mice 28 d after injury was restored to levels observed in saline-administered mice (n.s., not significant; Mann–Whitney U test). Data points represent the value in the analyzed areas of OE [8 areas/mouse; control (n =3 mice/time point), STZ (n =3 mice/time point), saline-d28 (n =2 mice)].
Figure 3.
Figure 3.
OSNs in STZ mice display reduced odorant-evoked responses. A, Odorant-evoked EOG responses to pentyl acetate at different concentrations in control and STZ mice on day 14 following injury. Similar response kinetics of the EOG were observed in control and STZ mice. B, Comparison of peak amplitudes in EOG recordings between control and STZ mice on day 14 following injury. Two-way RM ANOVA with Bonferroni’s post hoc correction, odor concentration: F(1,5) = 89.65, p <0.001; STZ treatment: F(1,5) = 13.51, p =0.014; interaction: F(1,5) = 12.84, p =0.016. Relative to control mice, STZ mice showed significantly lower EOG amplitudes in response to high concentrations of pentyl acetate (10−1 m, p <0.001; 10−2 m, p <0.001, ***p <0.001; n =6 mice/group; Bonferroni’s post hoc test). Error bars, SD. C, Odorant-evoked EOG responses to pentyl acetate at different concentrations in control and STZ mice on day 28 following injury. Similar response kinetics of the EOG were observed in control and STZ mice. D, Comparison of peak amplitudes in EOG recordings between control and STZ mice on day 28 following injury. Two-way RM ANOVA with Bonferroni’s post hoc correction, odor concentration: F(1,5) = 83.27, p <0.001; STZ treatment: F(1,5) = 14.14, p =0.013; interaction: F(1,5) = 9.94, p =0.025. Relative to control mice, STZ mice showed significantly lower EOG amplitudes in response to high concentrations of pentyl acetate (10−1 m, p <0.001; 10−2 m, p <0.001; 10−3 m, p =0.047, *p <0.05, ***p <0.001; n =6 mice/group; Bonferroni’s post hoc test). Error bars, SD.
Figure 4.
Figure 4.
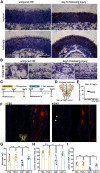
Decreased insulin impairs axonal targeting to glomeruli in the OB. A, Representative coronal sections stained with anti-OMP antibody 14 and 28 d after methimazole-induced injury in control and STZ mice. Each circled area corresponds to a glomerulus. Scale bar: 100 μm. B, Percentages of OMP-stained areas in the medial glomeruli of the OB. The percentages were significantly reduced in STZ mice 14 and 28 d after methimazole-induced injury [d14: n =123 glomeruli in 3 mice (control), n =190 glomeruli in 4 mice (STZ); d28: n =207 glomeruli in 5 mice (control), n =118 glomeruli in 4 mice (STZ), ***p <0.001, Friedman test followed by Mann–Whitney U test with Bonferroni correction]. C, Time course and experiment design used to test control and STZ mOR-EG-GFP mice. Methimazole was injected intraperitoneally, and the tissue was fixed 45 d later. D, Representative sections of GFP-expressing glomeruli in control and STZ mOR-EG-GFP mice 45 d after injury. Axonal targeting was disturbed with different patterns in STZ mOR-EG-GFP mice (#1 and #2 in lower panel). Dashed circles, glomeruli. Scale bar: 100 μm. E, Percentages of GFP-positive areas within glomeruli. The GFP-labeled area was significantly reduced in STZ-administered mOR-EG-GFP mice [n =81 glomeruli in 6 mice (control), n =39 glomeruli in 4 mice (STZ), ***p <0.001, Mann–Whitney U test)]. F, Sizes of glomeruli. The mean glomerular sizes were not significantly different between control and STZ mOR-EG-GFP mice [n =81 glomeruli in 6 mice (control), n =39 glomeruli in 4 mice (STZ), n.s., not significant, Mann–Whitney U test)]. G, Timeline for odorant-induced c-Fos expression experiment. The fixation and the immunostaining were performed for control and STZ mice 28 d after methimazole-induced injury. Odorants in three categories (aldehydes, lactones, and esters) were applied by placing the odor-containing dish in a cage twice for 1 h with a 10-min interval between placements (right). H, Representative coronal sections of the OB stained with anti-c-Fos antibody. Left, Schematic of a coronal OB displaying four quadrants. Right, c-Fos expression of the d-m areas in control and STZ mice. Scale bar: 100 μm. I, Density of c-Fos-positive cells in the glomerular layers in each quadrant of the OB. The densities were significantly smaller in STZ mice than in control mice 28 d after methimazole-induced injury (**p <0.01; Mann–Whitney U test). Data points represent the value in the analyzed areas of OB [2–3 areas/region/mouse; n =4 mice (control), n =5 mice (STZ)].
Figure 5.
Figure 5.
Decreased insulin elicits behavioral deficits in STZ mice 28 d after methimazole-induced injury. A, Time course of the experimental design for the odor-guided food-seeking test. B, Diagram displaying the experimental design of the buried food test. On trial days 1–3, a piece of cookie was buried under the bedding in a randomly selected corner of the mouse cage. On trial day 4, a piece of cookie was placed on top of the bedding to be visible to the mice. C, Latencies to find the cookie on each trial day in control and STZ mice 28 d after methimazole-induced injury. Two-way RM ANOVA with Tukey’s post hoc test, day: F(1,6) = 23.26, p <0.001, STZ treatment: F(1,6) = 28.82, p =0.002, interaction: F(1,6) = 2.93, p <0.138. The latency in STZ mice was significantly longer than that in control mice on trial days 1, 2, and 3 (n = 7 mice/group; error bars, SD; **p <0.01, n.s., not significant; Tukey’s post hoc test).
Figure 6.
Figure 6.
Decreased insulin does not alter OSN proliferation but increases apoptotic cell death in immature neurons. A, Representative coronal sections of nasal septa stained with anti-Ki67 antibody for control and STZ mice 3, 7, 14, and 28 d after methimazole-induced injury. Arrowheads indicate Ki67-positive cells. Scale bar: 50 μm. B, Density of Ki67-positive cells in the nasal septa of control and STZ mice 3, 7, 14, and 28 d after methimazole-induced injury. Two-way RM ANOVA with Bonferroni’s post hoc correction, day: F(1,15) = 33.87, p <0.001; STZ treatment: F(1,15) = 14.25, p =0.002; interaction: F(1,15) = 0.15, p =0.858. No significant differences in the numbers of Ki67-positive cells were observed between control and STZ mice [d3: p =1.000, 3 mice (control) vs 3 mice (STZ); d7: p =1.000, 2 mice (control) vs 3 mice (STZ); d14: p =1.000, 3 mice (control) vs 3 mice (STZ); d28: p =1.000, 3 mice (control) vs 3 mice (STZ); n.s., not significant; Bonferroni’s post hoc test]. Data points represent the value in the analyzed areas of OE (8 areas/mouse). C, Representative coronal sections of nasal septa stained with anti-activated caspase-3 antibody for control and STZ mice 7, 14, and 28 d after methimazole-induced injury. Arrowheads indicate activated caspase-3-positive cells. Scale bars: 50 μm. D, Density of activated caspase-3-positive cells in the nasal septa of control and STZ mice 7, 14, and 28 d after methimazole-induced injury. Two-way RM ANOVA with Bonferroni’s post hoc correction, day: F(2,34) = 154.62, p <0.001; STZ treatment: F(1,17) = 316.92, p <0.001; interaction: F(1,17) = 148.56, p <0.001. The susceptibility to apoptosis of new OSNs in STZ mice was greatest on day 14 (n =3 mice; ***p <0.001; Bonferroni’s post hoc test). On days 14 and 28, the total numbers of caspase-3-positive cells in STZ mice were significantly higher than those in control mice (n =3 mice; ***p <0.001; Bonferroni’s post hoc test). Data points represent the value in the analyzed areas of OE (8 areas/mouse). E, Representative coronal sections of nasal septa stained with anti-activated caspase-3 (red) and anti-OMP (green) or anti-GAP43 (green) antibodies 14 d after methimazole-induced injury in STZ mice. The majority of activated caspase-3-positive cells (white arrowheads) were costained not by the anti-OMP but by the anti-GAP43 antibody. Scale bar: 20 μm.
Figure 7.
Figure 7.
Newly generated OSNs require insulin during their maturation after day 7 postinjury. A, Time course of the experimental design. Mice in three experimental groups were administered insulin intraperitoneally at different times following methimazole-induced injury. B, Representative coronal sections of the nasal septa stained with hematoxylin (upper) or anti-OMP antibody (lower) for mice administered insulin on d1–d13, d1–d6, or d8–d13. Scale bars: 50 μm. C–E, OE thicknesses (C; Kruskal–Wallis test followed by Mann–Whitney U test with Bonferroni correction, χ2 = 29.62, p <0.001), density of OSNs (D; Kruskal–Wallis test followed by Mann–Whitney U test with Bonferroni correction, χ2 = 28.02, p <0.001), and density of OMP-positive cells (E; Kruskal–Wallis test followed by Mann–Whitney U test with Bonferroni correction, χ2 = 22.52, p <0.001) in the three groups [OE thickness: 3 mice (d1–d13), 3 mice (d1–d6), 3 mice (d8–d13); number of OSNs: 3 mice (d1–d13), 3 mice (d1–d6), 3 mice (d8–d13); number of OMPs: 4 mice (d1–d13), 3 mice (d1–d6), 3 mice (d8–d13); ***p <0.001 for d1–d13 vs d1–d6 and for d1–d6 vs d8–d13; Mann–Whitney U test with Bonferroni correction]. Data points represent the value in the analyzed areas of OE (thickness: 5–6 areas/mouse; OSNs: 5–6 areas/mouse; OMPs: 4 areas/mouse). F, Diagram of intranasal insulin administration. Insulin was applied to the nasal cavities of STZ mice after methimazole-induced injury. These applications were performed according to the protocol used for the intraperitoneal insulin administration shown in A. G, Effects of the intranasal insulin application on blood glucose levels. Shown are blood glucose levels before (pre-ad) and 60 and 120 min after intranasal administration (after ad) of insulin at three concentrations (*p <0.05, **p <0.01; Steel test). H, Representative coronal sections of nasal septa stained with anti-OMP antibody (green) 14 d after methimazole-induced injury in STZ mice. Scale bar: 50 μm. I, Density of OMP-positive cells 14 d after methimazole-induced injury in the three intranasal insulin administration groups. Kruskal–Wallis test followed by Mann–Whitney U test with Bonferroni correction, χ2 = 37.47, p <0.001 (n =3 mice/group; ***p <0.001 for d1–d13 vs d1–d6 and for d1–d6 vs d8–d13; Mann–Whitney U test with Bonferroni correction). Data points represent the value in the analyzed areas of OE (6 areas/mouse). n.s., not significant.
Figure 8.
Figure 8.
Upregulation of insulin receptor-mediated during days 8–13 is required for maturation of OSNs. A, B, In situ hybridization by RNAscope assay of Insr from septal and turbinate coronal sections of the uninjured OE and the OE on day 14 following injury (A) and medial part of sections of the uninjured OB and the OB on day 14 following injury (B) in non-diabetic 10-week-old mice. Signals were sparsely detected especially in the layer of supporting cells and OSNs of the uninjured OE (n =3 mice; A, left panels). Strong signals, suggesting upregulation of Insr expression were detected in the OE on day 14 following injury (n =3 mice; A, right panels). In the OB, signals were detected in the glomerular layer (GL), external plexiform layer (EPL), and mitral cell layer (MCL; B). Signal intensity appears similar between the uninjured OB (n =3 mice; B, left panels) and the OB at day 14 following injury (n =3 mice; B, right panels). Scale bars: 50 μm. C, Time course of the experimental design. Mice in two experimental groups were administered PBS or S961, an insulin receptor antagonist during days 8–13 following methimazole-induced injury. D, Diagram of unilateral intranasal application. PBS or S961 was applied to a side of the nasal cavities of non-diabetic control mice after methimazole-induced injury according to the protocol shown in C. E, Effects of the intranasal S961 application (0.5 μg/μl, 10 μl) on blood glucose levels before (pre-S961) and 120 min after intranasal administration (after S961) of insulin. F, Representative coronal sections of the nasal septa stained with DAPI and anti-OMP antibody (red) for control mice intranasally administered PBS or S961 on d8–d13. Scale bars: 50 μm. G–I, OE thicknesses (G; Kruskal–Wallis test followed by Mann–Whitney U test with Bonferroni correction, χ2 = 16.67, p <0.001), density of OSNs (H; Kruskal–Wallis test followed by Mann–Whitney U test with Bonferroni correction, χ2 = 17.63, p <0.001), and density of OMP-positive cells (I; Kruskal–Wallis test followed by Mann–Whitney U test with Bonferroni correction, χ2 = 22.48, p <0.001) in the three groups [OE thickness: 3 mice (PBS), 3 mice (S961); number of OSNs: 3 mice (PBS), 3 mice (S961); number of OMPs: 3 mice (PBS), 3 mice (S961); *p <0.05, **p <0.01; Mann–Whitney U test with Bonferroni correction]. PBS-C, PBS-control; S961-C, S961-control. Data points represent the value in the analyzed areas of OE (3 areas/side/mouse).
Figure 9.
Figure 9.
Insulin enhances the replacement of newly generated OSNs in control mice. A, Time course of the experimental design following methimazole and insulin application. Mice in two experimental groups received unilateral intranasal insulin application at different periods after methimazole-induced injury. Both groups received methimazole intraperitoneally on day 0 and intranasal insulin starting on day 1. Mice were perfused with fixative on day 7 (d1–d6 insulin, left) or day 14 (d1–d13 insulin, right) after the methimazole-induced injury. B, Representative images of the nasal septum stained with anti-OMP (green) antibody in the two groups. Scale bar: 50 μm. C, Number of OMP-positive cells in mice subjected to insulin administration 1–13 d after the injury. The number of OMP-positive cells were significantly increased on the insulin application side compared with the contralateral side (n = 4 mice/group; ***p <0.001; Mann–Whitney test). Data points represent the value in the analyzed areas of OE (6 areas/mouse). D, Time course of the experimental design of methimazole and insulin application. Mice in two experimental groups received unilateral insulin application at different times after methimazole-induced injury. Both groups received methimazole intraperitoneally on day 0. Insulin was unilaterally applied on days 1–6 (left, d1–d6 insulin) and days 8–13 (right, d8–d13 insulin) postinjury three times daily. Mice were perfused with fixative on day 14 after the methimazole-induced injury. E, Representative images of the olfactory nasal septum and concha bullosa stained with anti-OMP (green) antibody in the two groups. App, application side; contra, contralateral side. Scale bars: 50 μm. F, Number of OMP-positive cells in mice subjected to insulin application 1–6 and 8–13 d after injury. Two-way RM ANOVA with Bonferroni’s post hoc correction, day: F(1,23) = 10.87, p =0.003; application side: F(1,23) = 4.60, p =0.043; interaction: F(1,23) = 13.67, p =0.001. The number of OMP-positive cells on the application side was significantly higher during the insulin application 8–13 d postinjury than that on the contralateral side (n =4 mice/group; **p <0.01; Bonferroni’s post hoc test), whereas no significant difference was observed between the application and contralateral sides 1–6 d postinjury (n.s., not significant; Bonferroni’s post hoc test). Data points represent the value in the analyzed areas of OE (6 areas/mouse).
Figure 10.
Figure 10.
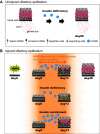
Diagram for insulin-dependent replacement of newly generated OSNs following injury. A, Time course of tissue structure in uninjured OE. Even under insulin-deficient situations, no structural changes in the uninjured OE occur during the 90-d period. B, Time course of the repair process following injury. The dependence of the newly generated OSNs on insulin increased between 8 and 13 d following injury. Under normal insulin levels, newly generated OSNs regenerate and mature during days 8–13 following injury. The number of mature OSNs gradually increases, and tissue repair is completed 28 d following injury. However, under insulin-deficient situations during days 8–13 following injury, newly generated OSNs are highly susceptible to apoptosis, resulting in incomplete recovery of the OE with fewer mature OSNs. Under insulin-enriched situations during the same period, facilitation of the OE repair could occur.

Similar articles

Cited by

References

    1. Aberg MA, Aberg ND, Hedbäcker H, Oscarsson J, Eriksson PS (2000) Peripheral infusion of IGF-I selectively induces neurogenesis in the adult rat hippocampus. J Neurosci 20:2896–2903. 10.1523/JNEUROSCI.20-08-02896.2000 - DOI - PMC - PubMed
    1. Balázs R, Jørgensen OS, Hack N (1988) N-methyl-D-aspartate promotes the survival of cerebellar granule cells in culture. Neuroscience 27:437–451. 10.1016/0306-4522(88)90279-5 - DOI - PubMed
    1. Banks WA (2004) The source of cerebral insulin. Eur J Pharmacol 490:5–12. 10.1016/j.ejphar.2004.02.040 - DOI - PubMed
    1. Barger SW (1999) Complex influence of the L-type calcium-channel agonist BayK8644(+/-) on N-methyl-D-aspartate responses and neuronal survival. Neuroscience 89:101–108. 10.1016/S0306-4522(98)00312-1 - DOI - PubMed
    1. Barrios AW, Núñez G, Sánchez Quinteiro P, Salazar I (2014) Anatomy, histochemistry, and immunohistochemistry of the olfactory subsystems in mice. Front Neuroanat 8:63. 10.3389/fnana.2014.00063 - DOI - PMC - PubMed

LinkOut - more resources