. 2021 Apr 27;12(1):2448.
doi: 10.1038/s41467-021-22526-0.

FtsZ treadmilling is essential for Z-ring condensation and septal constriction initiation in Bacillus subtilis cell division

Affiliations

FtsZ treadmilling is essential for Z-ring condensation and septal constriction initiation in Bacillus subtilis cell division

Kevin D Whitley et al. Nat Commun. .

Abstract

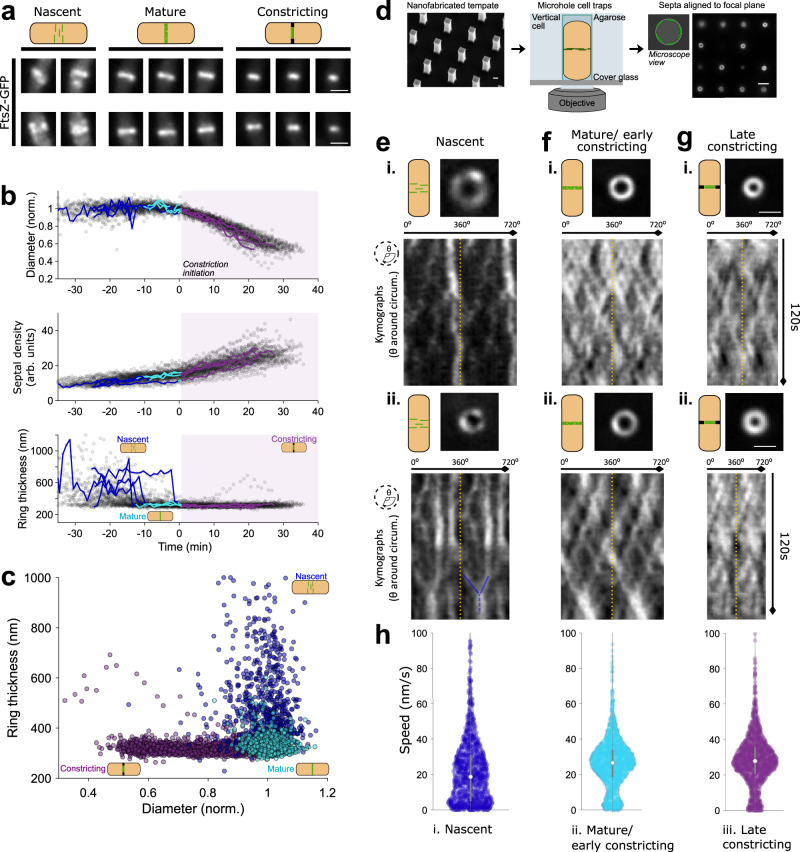
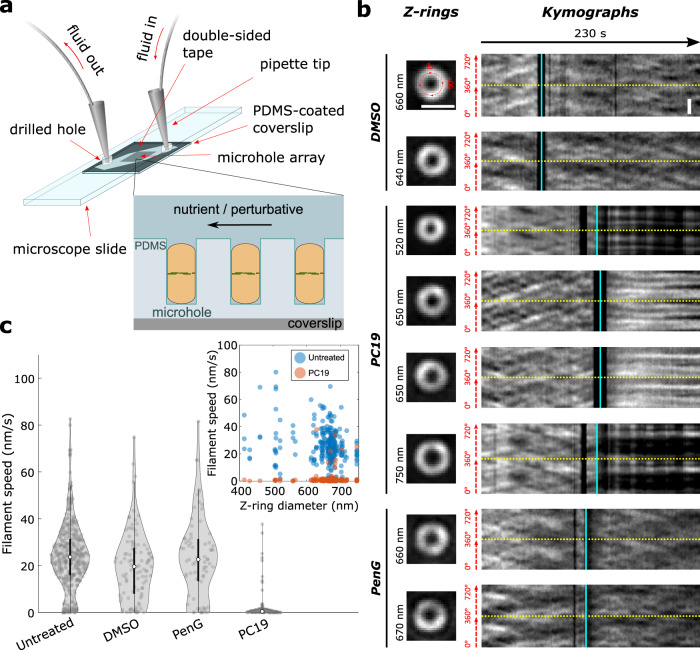
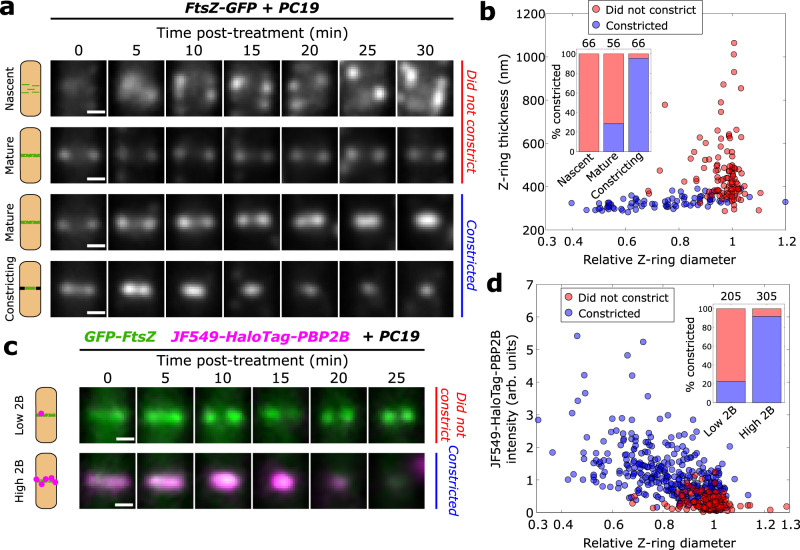
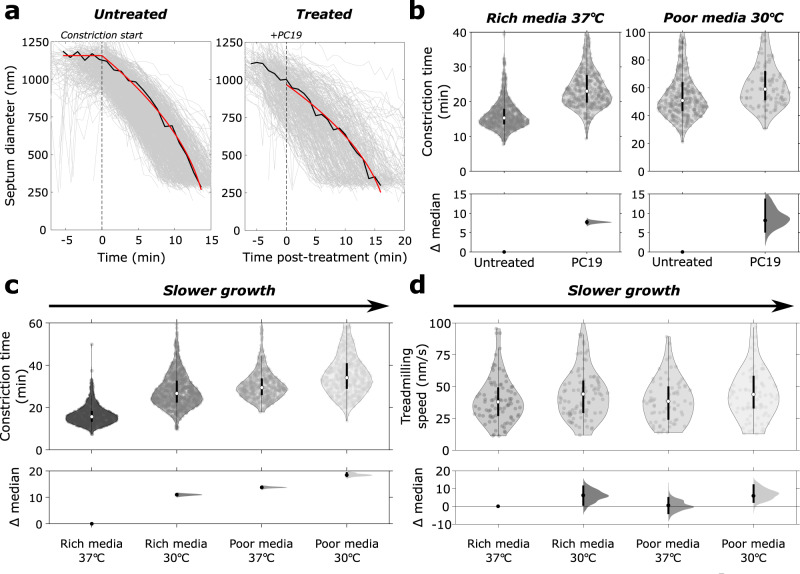
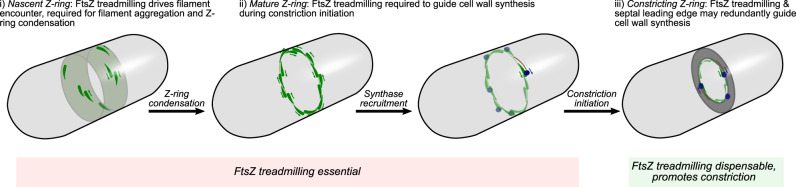
Despite the central role of division in bacterial physiology, how division proteins work together as a nanoscale machine to divide the cell remains poorly understood. Cell division by cell wall synthesis proteins is guided by the cytoskeleton protein FtsZ, which assembles at mid-cell as a dense Z-ring formed of treadmilling filaments. However, although FtsZ treadmilling is essential for cell division, the function of FtsZ treadmilling remains unclear. Here, we systematically resolve the function of FtsZ treadmilling across each stage of division in the Gram-positive model organism Bacillus subtilis using a combination of nanofabrication, advanced microscopy, and microfluidics to measure the division-protein dynamics in live cells with ultrahigh sensitivity. We find that FtsZ treadmilling has two essential functions: mediating condensation of diffuse FtsZ filaments into a dense Z-ring, and initiating constriction by guiding septal cell wall synthesis. After constriction initiation, FtsZ treadmilling has a dispensable function in accelerating septal constriction rate. Our results show that FtsZ treadmilling is critical for assembling and initiating the bacterial cell division machine.


Conflict of interest statement

The authors declare no competing interests.

Figures

Fig. 1
Fig. 1. FtsZ filament organisation and dynamics throughout the division process.
a Exemplar images of FtsZ-GFP (SH130) filament organisation throughout division, classified by division phase. Scale bars: 1 μm. All images same magnification. b Quantification of FtsZ-ring diameter, septal density (septal intensity divided by ring circumference) and ring thickness throughout division from time-lapse microscopy data. Nascent Z-rings have large axial width (ring thickness) due to the diffuse distribution of filaments, which condense into a thin mature Z-ring, followed by constriction initiation. Traces are temporally aligned relative to the start time of constriction (Methods). Grey scatter points represent all data points. Lines show individual, representative traces, which are split into coloured segments indicating cell division state: nascent (blue), mature (cyan) and constricting (purple). Purple shading shows all time after constriction initiation. c FtsZ-ring thickness and relative septal diameter. Colour indicates cell division state as per (b). Cell division state of FtsZ-rings in (b, c) determined by automated classification of Z-ring diameter and axial thickness time lapse data (Methods, Supplementary Note 3). d VerCINI schematic. Nanofabricated silicon micropillars (left panel) are used as a mould to make agarose microholes. Rod-shaped bacteria are trapped in agarose microholes (middle panel), rotating the division septum into the microscope imaging plane (right panel). Scale bars: 1 μm (left panel), 2.5 μm (right panel). eg VerCINI microscopy of FtsZ filament dynamics for each Z-ring phase, two representative examples per phase (i–ii). Nascent Z-rings are composed of sparse filaments diffusely distributed around the circumference of the cell, and a large fraction of immobile FtsZ filaments. Mature and constricting Z-rings possess a more uniform distribution of FtsZ filaments around the division site, with most filaments treadmilling. Images of septa show the first frame in kymographs (t = 0 s). Kymographs were obtained by fitting septal images to circles and plotting intensity values around the circumference of the cell for each frame of the time-lapse (1 frame/s). Two full revolutions around the cell (0–720o) are plotted side-by-side in each kymograph to resolve filament trajectories that pass 0o/360o, separated by yellow dotted lines. Blue lines highlight example of motile FtsZ filament aggregation. Scale bars: 1 μm. All images same magnification. h Violin plots of FtsZ filament speed for each division stage. White circles, median; thick grey lines, interquartile range; thin grey lines, 1.5x interquartile range. Source data for this figure are provided as a source data file.
Fig. 2
Fig. 2. PC190723 arrests cellular FtsZ treadmilling within seconds across all stages of constriction.
a Schematic of microfluidic VerCINI. Rod-shaped cells are confined in open-topped microholes in a thin layer of PDMS atop a microscope coverslip as solutions flow over them. The flow channel is formed from a cut piece of double-sided tape sandwiched between the PDMS layer and a microscope cover slide with drilled holes to allow inlet and outlet tubes. b Representative images of septa and associated kymographs of FtsZ-GFP (SH130) dynamics in vertically-immobilised cells during rapid treatment with either DMSO (top), PC19 (middle) or PenG (bottom) at multiple septal diameters. Images of septa show the first frame in kymographs (t = 0 s). Kymographs were obtained by fitting septal images to circles and plotting intensity values around the circumference of the cell for each frame of the time-lapse (1 frame/s). Two full revolutions around the cell (0–720o) are plotted side-by-side in each kymograph to resolve filament trajectories that pass 0o/360o, separated by yellow dotted lines. Cyan lines show arrival time of media containing DMSO, PC19 or PenG. Black bands around time of treatment resulted from a loss of focus during fluid exchange. Fluctuations in intensity for two septa post-PC19 treatment (750 and 520 nm diameter septa) resulted from manual refocusing during imaging. Scale bars: 1000 nm. All images same magnification. c Violin plots of FtsZ treadmilling speeds pre- and post-treatment measured from kymographs. White circles, median; thick black lines, interquartile range; thin black lines, 1.5x interquartile range. DABEST plots of effect size can be found in Supplementary Fig. 12. Inset: FtsZ treadmilling speed distributions for untreated (blue circles) and PC19-treated (red circles) cells from violin plots separated by septal diameter. Source data for this figure are provided as a source data file.
Fig. 3
Fig. 3. FtsZ treadmilling is required until the arrival of PG synthesis machinery.
a Representative time-lapses of Z-rings for FtsZ-GFP cells (SH130) after arrival of 10 μM PC19-laced media. Nascent rings and many mature rings do not constrict for tens of minutes after PC19 treatment, whereas constricting rings and many mature rings continue constricting after treatment. b Scatter plot of Z-ring diameters and thicknesses for all FtsZ-GFP cells at t = 0 min showing whether they continued constricting (blue) or not (red). Inset: Percentage of cells that continued constricting classified by division stage. Nascent: thickness >400 nm, mature: thickness <400 nm, relative diameter >0.9, constricting: thickness <400 nm, relative diameter <0.9. c Representative time-lapses of rings from two-colour strain SH212 (Green: GFP-FtsZ, magenta: JF549-HaloTag-PBP2B) after the arrival of PC19-laced media. Z-rings with low JF549-HaloTag-PBP2B signal typically do not continue constricting while those with high signal typically do. d Scatter plot of Z-ring diameters and normalised JF549-HaloTag-PBP2B intensities at t = 0 min showing whether they continued constricting (blue) or not (red). Inset: Percentage of cells that continued constricting classified by JF549-HaloTag-PBP2B signal. Low 2B: intensity <0.5, High 2B: intensity >0.5. Scale bars: 500 nm. Numbers above stacked bars indicate number of cells. Source data for this figure are provided as a source data file.
Fig. 4
Fig. 4. Constriction rate is accelerated by FtsZ treadmilling and fast cell growth rate.
a Time traces of ring diameters from mNeonGreen-PBP2B strain (ME7) for untreated (left) and PC19-treated (right) cells with constant PG synthesis model (red) fitted to representative traces (black). Untreated cell trajectories are aligned relative to fitted constriction start time (black dotted line on left panel). PC19-treated cell trajectories are aligned relative to the arrival time of PC19-laced media (black dotted line on right panel). b Constriction time before and after PC19 treatment for both fast growth (rich media 37 °C) and slow growth (poor media, 30 °C) conditions. c Constriction time of mNeonGreen-PBP2B cells in rich and poor media at two growth temperatures. d mNeonGreen-FtsZ (bWM4) treadmilling speeds in different media and temperature. Top panels, bd: violin plots; white circle, sample median; thick black lines, interquartile range; thin black lines, 1.5x interquartile range. Bottom panels, bd: Bottom panels: DABEST plots showing effect size analysis, compared to leftmost condition; black circles, median difference; error bars, 95% confidence interval of median difference. Source data for this figure are provided as a source data file.
Fig. 5
Fig. 5. Model for function of FtsZ treadmilling in Z-ring assembly and septal constriction.
Schematics depicting stages of division along with key events and roles of FtsZ treadmilling.

Similar articles

Cited by

References

    1. Yao, Q. et al. Short FtsZ filaments can drive asymmetric cell envelope constriction at the onset of bacterial cytokinesis. EMBO J. 10.15252/embj.201696235 (2017). - PMC - PubMed
    1. Strauss MP, et al. 3D-SIM super resolution microscopy reveals a bead-like arrangement for FtsZ and the division machinery: implications for triggering cytokinesis. PLoS Biol. 2012;10:e1001389. - PMC - PubMed
    1. Holden SJ, et al. High throughput 3D super-resolution microscopy reveals Caulobacter crescentus in vivo Z-ring organization. Proc. Natl Acad. Sci. USA. 2014;111:4566–4571. - PMC - PubMed
    1. Loose M, Mitchison TJ. The bacterial cell division proteins FtsA and FtsZ self-organize into dynamic cytoskeletal patterns. Nat. Cell Biol. 2014;16:38–46. - PMC - PubMed
    1. Bisson-Filho AW, et al. Treadmilling by FtsZ filaments drives peptidoglycan synthesis and bacterial cell division. Science. 2017;355:739–743. - PMC - PubMed

Publication types

MeSH terms