. 2021 Apr 27;11(1):9106.
doi: 10.1038/s41598-021-88147-1.

Early loss of Scribble affects cortical development, interhemispheric connectivity and psychomotor activity

Affiliations

Early loss of Scribble affects cortical development, interhemispheric connectivity and psychomotor activity

Jerome Ezan et al. Sci Rep. .

Abstract

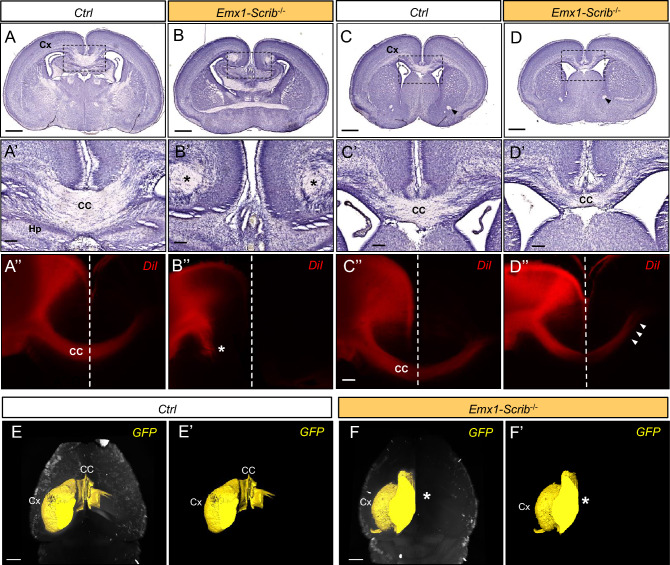
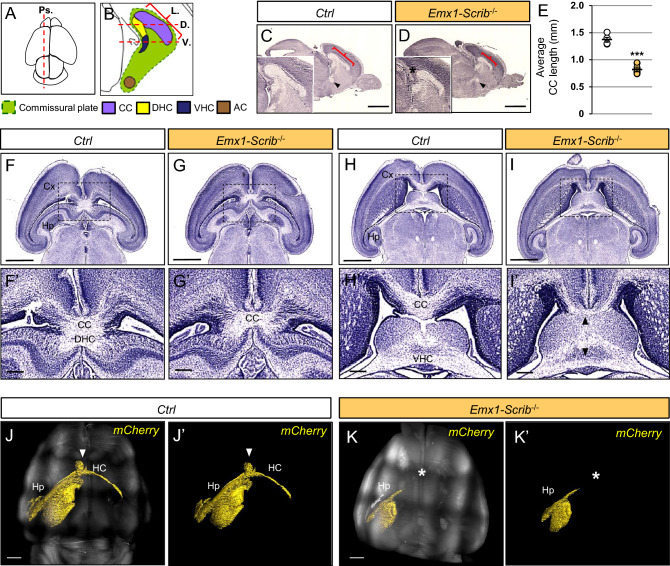
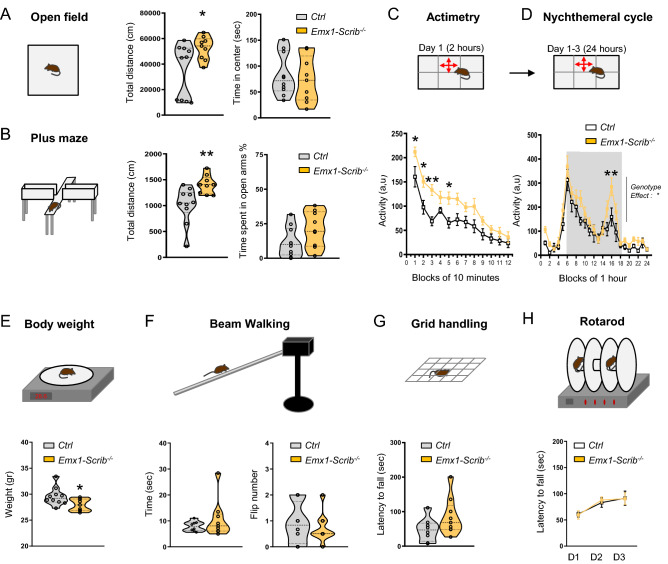
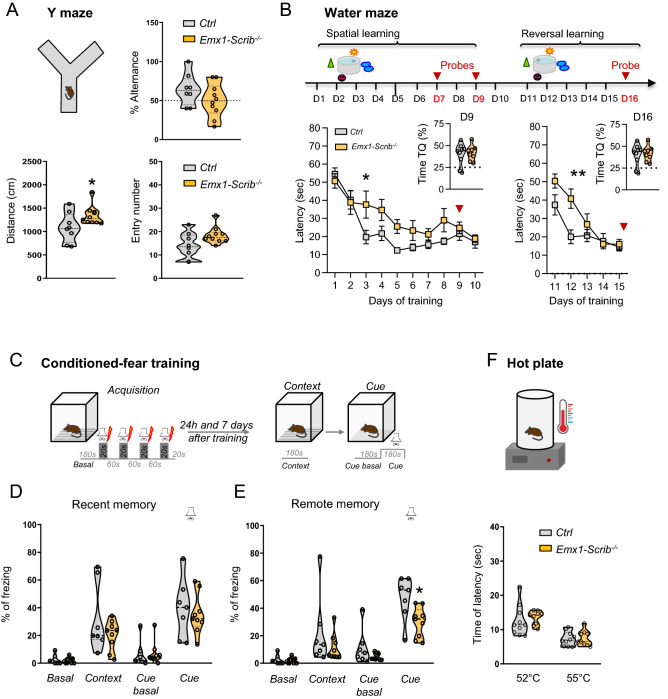
Neurodevelopmental disorders arise from combined defects in processes including cell proliferation, differentiation, migration and commissure formation. The evolutionarily conserved tumor-suppressor protein Scribble (Scrib) serves as a nexus to transduce signals for the establishment of apicobasal and planar cell polarity during these processes. Human SCRIB gene mutations are associated with neural tube defects and this gene is located in the minimal critical region deleted in the rare Verheij syndrome. In this study, we generated brain-specific conditional cKO mouse mutants and assessed the impact of the Scrib deletion on brain morphogenesis and behavior. We showed that embryonic deletion of Scrib in the telencephalon leads to cortical thickness reduction (microcephaly) and partial corpus callosum and hippocampal commissure agenesis. We correlated these phenotypes with a disruption in various developmental mechanisms of corticogenesis including neurogenesis, neuronal migration and axonal connectivity. Finally, we show that Scrib cKO mice have psychomotor deficits such as locomotor activity impairment and memory alterations. Altogether, our results show that Scrib is essential for early brain development due to its role in several developmental cellular mechanisms that could underlie some of the deficits observed in complex neurodevelopmental pathologies.


Conflict of interest statement

The authors declare no competing interests.

Figures

Figure 1
Figure 1
Scrib expression in the mouse developing forebrain. (A-A″) Representative Scrib mRNA expression pattern by ISH on E16.5 mouse embryo sections. The dashed boxes in A are magnified in (A′) and (A″). Scrib mRNA is detected on the cortical plate (CP), in the subventricular zone (SVZ), the ventricular zone (VZ) and in the indusium griseum (IG, arrows) and in ependymal cells (arrowheads) next to the choroid plexus (CPx). MZ marginal zone, IZ intermediate zone. Scale bar 0.5 mm (A) and 0.1 mm (A′–A″). (B) Representative Scrib (green) and Nestin (a general marker of neural progenitor cells, red) expression pattern by IF on E13 mouse embryo coronal sections. The dashed boxes in (B) are magnified in (B′), then within the insets. Scrib protein is detected throughout the cortical plate (CP) and is enriched in the VZ. Scale bar 0.1 mm (B), 0.05 mm (B′). (C) Representative Scrib (green) and Pals1 (an apical surface marker, red) expression pattern by IF on E16.5 mouse embryo coronal sections. The higher magnification illustrates Scrib accumulation at cell–cell contacts in the entire VZ, next to the apical marker Pals-1 (red). Scale bar 0.1 mm. (D,E) Representative Scrib (green) expression pattern by IF on P0 cortex (C), Corpus Callosum (CC) (D) and midline glia (E). Scrib labeling overlaps with Ephrin-B2 (marker of the CC, red in (D) but is also markedly enriched in GFAP-positive (red in E) structures including the indusium griseum (IG) and the midline zipper (MZ). Cg is the cingulate cortex. Higher magnification for selected insets (boxed areas) illustrates strong Scrib expression in glial midline structures (see arrowheads). Scale bar 0.1 mm (D,E).
Figure 2
Figure 2
Generation and characterization of Scrib conditional knockout mouse mutants. (A) Virtual gel of PCR genotyping to detect wild-type (437 bp), floxed (541 bp) and targeted cKO (193 bp) alleles. Cre-mediated excision was confirmed in P0 cortices by the presence of a 300 bp product (lanes 3 and 4). In absence of Cre, the wild-type and floxed alleles remain intact as determined by 437 and 541 bp fragments, respectively (lane 1 and 2). When Cre-mediated recombination occurs (lanes 3 and 4), the floxed allele is excised, resulting in a 193 bp band, suggesting efficient recombination. (B) Schematic representation of the genomic organization of mouse Scrib gene with 38 exons (solid boxes) including exons encoding for LRR (green boxes) or PDZ (purple boxes) domains of the protein. (C) Representative western blots from control and Scrib−/− cKO cerebral cortices showing full-length Scrib protein. Cortical protein extracts of P0 FoxG1-Scrib−/− and Emx1-Scrib−/− cKOs were immunoblotted with anti-Scrib antibody and anti-GAPDH as a control. cKO lysates (lanes 2 and 4) show reduced levels of Scrib when compared with control (lanes 1 and 3). (D) Scatterplots summarizing western blot quantification (densitometric intensity values normalized to the control). Statistical analysis via a two-tailed t test (P** < 0.001, P*** < 0.0001) using between 4 and 8 cortical samples per genotype from at least 3 independent experiments. Error bars indicate the SEM. (E) Scrib expression on coronal cryosection of P0 Emx1-Scrib−/− cKOs mutants and control littermates. A dramatic decrease in Scrib expression is observed specifically in cortex and hippocampus (area surrounded by yellow dashed line). Persistence of Scrib expression in the ventro-medial structures verifies the specificity of the excision (see star*). Scale bar 0.5 mm. (F) Higher magnification insets for the Hp and Cx areas from (E). Scale bar 0.1 mm. (G,H) P0 coronal sections of Emx1-Cre-Ai6 mouse brains. By crossing Emx1-Cre with an Ai6 reporter mouse strain, we confirmed the Emx1-driven expression of the Cre recombinase in the cortex (Cx), the corpus callosum (CC), the hippocampus (Hp) and the fimbria (Fi). Both rostral (G) and caudal (H) sections show robust ZSGreen1 (eGFP) expression in the dorsal forebrain assessing efficient recombination, including in GFAP-positive cells from the midline glia but also in the L1-CAM axonal tracts of the CC. On the other hand, the most ventral regions including the striatum (see star *), the mediolateral neuroepithelium (see #) or the choroid plexus (see ¤) show almost no sign of recombination. Scale bar 0.5 mm.
Figure 3
Figure 3
Early deletion of Scrib leads to microcephaly associated with cortical layering and neuronal migration defects. (A) Dorsal views of P0 Emx1-Scrib−/− cKO brains. Dorsal cortical surface areas are outlined with a yellow dashed line. Statistical analysis via a two-tailed t test (*P < 0.05) using between 5 and 7 brains per genotype from at least 3 independent experiments. Error bars indicate the SD. Scale bar 1 mm. (B) Schematic view of a P0 brain sectioned coronally at the rostral (green dotted line) or caudal (red dotted line) level. (C,D) Representative hematoxylin staining of coronal sections from newborn Emx1-Scrib−/− cKO motor cortex at the caudal (C, red labels) and rostral (D, green labels) levels and their respective controls. A marked reduction of the caudal motor cortex thickness (M) in cKOs extends to the cingulate (Cg) and somatosensory (S1, S2) cortex. No major difference was observed at the rostral level. Cortical plate thickness was measured radially from the top of the upper layer (UL) to the bottom of the lower layer (LL) of the cortex. IZ intermediate zone, SVZ sub-ventricular zone, VZ ventricular zone. Statistical analysis via a two-tailed t test (**P < 0.01, ***P < 0.001) using 8 measurements per genotype from at least 3 independent experiments. Error bars indicate the SEM. Scale bar 0.2 mm. (E–G) Representative immunofluorescence staining of CuxI (E), Satb2 (F) and Ctip2 (G) on coronal sections from newborn Emx1-Scrib−/− cKO brains in the caudal motor cortex. Quantification of CuxI-, Satb2- and Ctip2-positive neurons is shown as a percentage (see “Materials and methods”). The proportion of CuxI- and Satb2-positive neurons is decreased in Emx1-Scrib−/− cKO brains, while the Ctip2 percentage is unchanged (see insets). Several ectopic Ctip2-positive cells are mislocalized in lower bins (white arrowheads). Statistical analysis via a two-tailed t test (*P < 0.05, **P < 0.01) using between 3 and 4 measurements per genotype from at least 3 independent experiments. Error bars indicate the SD. (H) Schematic representation of cortical layering in the caudal motor cortex of Emx1-Scrib−/− cKO and its control. Early-born neurons (brown) are mislocalized, while late-born neurons (blue) are decreased in proportion suggesting both neurogenesis and migration defects after early loss of Scrib function. See also Supplementary Fig S2. (I) Cortical neurons were electroporated in utero at E14.5 with an mCherry expressing vector together with control shRNA or a previously validated Scrib shRNA. Brains were fixed at E18.5/P0. Nuclei were stained with DAPI (not shown) in order to delineate cortical subregions: dotted lines represent boundaries between the upper layers (UL) and lower layers (LL) of the cortex, the intermediary zone (IZ), the subventricular zone (SVZ) and the ventricular zone (VZ). Arrowheads indicate either neurons reaching the upper layers of the cortex in the control condition or Scrib shRNA-electroporated cells that remain in the deepest layers of the cortex. (J) Quantification of the distribution of mCherry-positive cells in distinct subregions of the cerebral cortex for each condition (shRNA control, white bar; Scrib shRNA, black bar). Analysis was performed using at least 3 independent experiments. Error bars indicate SD. Statistical analysis via a two-tailed t test (*P < 0.01) per condition from at least 3 independent experiments.
Figure 4
Figure 4
Reduction in the number of neural precursor cells in Emx1-Scrib−/− mutant cortices is associated with proliferation but not apoptosis defects. (AD) Representative immunostaining of Tbr2 (A), Pax6 (B), Ki67 (C) and activated cleaved caspase 3 (CC3) (D) on coronal sections from embryonic stage E13 Emx1-Scrib−/− cKO brains. Cells were counted in 312.35 μm-wide cortical areas from three mutants and three controls from two different litters. Quantification of Tbr2-, Pax6- and Ki67-positive cells is shown as a percentage (see “Materials and methods”). The proportion of Tbr2- and Pax6-positive progenitors as well as Ki67-positive cells is decreased in Emx1-Scrib−/− cKO embryonic brains. No variation of activated caspase3-positive apoptotic cells is observed in Emx1-Scrib−/− mutant cortices. Statistical analysis via a two-tailed t test (*P < 0.05) using 6 measurements per genotype. Error bars indicate the SD. Scale bar 50 μm.
Figure 5
Figure 5
Partial corpus callosum agenesis in Emx1-Scrib−/− cKO mutants. (AD) Representative hematoxylin staining of coronal sections from newborn Emx1-Scrib−/− cKO brains (B,D) and their respective controls (A,C) at the caudal (A,B) or rostral (C,D) levels. Dashed boxes in (A,D) are magnified in (A′D′). (A′–D′) Higher magnification for selected insets (boxed areas) from (AD) illustrating high penetrance of CC agenesis (ACC) at the caudal level. At P0, 93% of Emx1-Scrib−/− (n = 28) cKO brains displayed ACC. Instead of crossing the midline, CC axons formed whorls (Probst bundles, PB) on either side of the midline that are indicated with an asterisk. Compared with control brains, a gap between hemispheres indicates fusion defects. Despite an apparent thinning, CC fibers do cross the midline at the rostral level. (A″–D″) DiI crystals placed in the dorsomedial cortex trace CC axons in Emx1-Scrib−/− cKO brains (B″,D″) and their respective controls (A″,C″) at the caudal (A″B″) or rostral (C″D″) levels at P0. Emx1-Scrib−/− cKO brains displayed occasional stalled fibers in some mutant brains (asterisk in B″). Cx cortex, Hp hippocampus, CC corpus callosum. The midline is indicated as a white dashed line. (E–F′) 3D imaging of adult brains cleared with uDISCO from Emx1-Scrib−/− cKO brains (F,F′, orange) and their respective controls (E,E′). 3D reconstruction of the GFP expressed after viral infection in the sensory-motor cortex are represented in yellow. In Emx1-Scrib−/− cKO brains, agenesis of the corpus callosum is confirmed by the absence of cortical fibers passing through the contralateral side (asterisk in F′). See also Supplementary Fig S3.
Figure 6
Figure 6
ACC is accompanied by hippocampal commissure agenesis in Scrib−/− cKO mutants. (A,B) Schematic dorsal (A) or para-sagittal (B) views of a P0 mouse brain. Brains were sectioned either para-sagitally (Ps. in A) or horizontally (in B) as indicated by the red dashed line at the level of the Dorsal (DHC) or Ventral (VHC) Hippocampal Commissures. CC length (L.) was determined as indicated by the red bracket. (C,D) Marked reduction of CC length (see red brackets and asterisk) along the rostrocaudal axis in the brains of Emx1-Scrib−/− (D, orange, n = 5) cKO brains as compared with those of their control littermates (C, white, n = 5). The Anterior Commisure (AC) is present in the mutant (black arrowhead). (E) Quantification of average CC length (in mm). Statistical analysis via a two-tailed t test (***P < 0.0001) using between 3 and 5 brains per genotype from at least 3 independent experiments. (F–I) Representative hematoxylin staining of serial horizontal sections from newborn Emx1-Scrib−/− (G,I) cKO brains and their respective controls (F,H) at the dorsal (FG) and ventral level (HI) as defined in (B). (F′–I′) Higher magnification for selected insets (boxed areas) from (FI) illustrating agenesis of the DHC (G′) and CC hypoplasia (G′,I′). Either dorsal (F′G′) or ventral (H′I′) sections showed showed some callosal and hippocampal axon bundles still crossing through the midline. (J,K) Light-sheet microscopy imaging of Emx1-Scrib−/− cKO adult brains (K) and its control (J) cleared with uDISCO. 3D reconstruction of the mCherry expressed after viral infection in the CA3 region of the hippocampus cortex is represented in yellow. The HC (indicated by an arrowhead in control) is absent in brains from cKO mutants (asterisk in K). Scale bars 1 mm in (C,D′,FK), 0.2 mm in (F′I′). See also Supplementary Fig S5.
Figure 7
Figure 7
Increased activity without impaired motor coordination in Emx1-Scrib−/− mice. (A) Left panel, open field apparatus. Middle panel, spontaneous locomotor activity measured by the total distance in the open field test. Right panel, time spent in the center. (B) Left panel, plus maze apparatus. Middle panel, total distance moved in the plus maze. Right panel, time spent in open arms. (C) Upper panel, actimetry test apparatus. Lower panel, distance travelled measured in 10-min intervals across the 120-min test session in a novel home-cage (control: n = 6 mice; Emx1-Scrib−/−: n = 9 mice). (D) Upper panel, nychtemeral cycle test apparatus. Lower panel, distance travelled measured in 1 h intervals across the 24 h test session in a home cage. (E) Upper panel, balance apparatus. Lower panel, body weight of 10–11 week-old mice. (F) Upper panel, beam walking apparatus. Lower panel, time spent to reach the black box and total flip number. (G) Upper panel, Grid handling apparatus. Lower panel, Latency to fall the grid. (H) Upper panel, rotarod test apparatus. Lower panel, latency to fall in accelerating (4–40 rpm across 5 min) rotarod test on 3 consecutive days. Data are presented either as violin plots with single data point as a dot or as means ± s.e.m. from 6 to 10 mice per genotype.
Figure 8
Figure 8
Spatial learning and long term memory deficit in Emx1-Scrib−/− mice. (A) Upper panel, Y maze test apparatus and alternance rate percentage in the Y maze test. Lower panel, total distance travelled and total number of entries in the Y maze test (control: n = 8 mice; Emx1-Scrib−/−: n = 10 mice). (B) Upper panel, design of the Morris water maze apparatus task. Lower panel, the learning curve showing escape latency during the spatial and reversal training sessions. Time spent in target quadrant during the probe test at day 9 and day 16 are represented in the right corner of each graph (control: n = 9 mice; Emx1-Scrib−/−: n = 8 mice). (C) Upper panel, design of the fear conditioning apparatus task. (D,E) Freezing levels in context and tone fear conditioning. (D) Percentage of freezing measured before training (basal), 24 h (recent memory) after training. (E) Percentage of Freezing measured before training (basal) and 7 days (remote memory) after training (control: n = 7 mice; Emx1-Scrib−/−: n = 9 mice). (F) Lower, Hot plate apparatus. Time spent to paw withdrawal in the hot plate test at 52 °C and 55 °C (control: n = 10 mice; Emx1-Scrib−/−: n = 9 mice). Data were represented either as violin plots with single data point as a dot or as mean ± SEM.

Similar articles

Cited by

References

    1. Lancaster MA, Knoblich JA. Spindle orientation in mammalian cerebral cortical development. Curr. Opin. Neurobiol. 2012;22:737–746. doi: 10.1016/j.conb.2012.04.003. - DOI - PMC - PubMed
    1. Evsyukova I, Plestant C, Anton ES. Integrative mechanisms of oriented neuronal migration in the developing brain. Annu. Rev. Cell Dev. Biol. 2013;29:299–353. doi: 10.1146/annurev-cellbio-101512-122400. - DOI - PMC - PubMed
    1. Edwards TJ, Sherr EH, Barkovich AJ, Richards LJ. Clinical, genetic and imaging findings identify new causes for corpus callosum development syndromes. Brain. 2014;137:1579–1613. doi: 10.1093/brain/awt358. - DOI - PMC - PubMed
    1. Iyer J, Girirajan S. Gene discovery and functional assessment of rare copy-number variants in neurodevelopmental disorders. Brief Funct Genom. 2015;14:315–328. doi: 10.1093/bfgp/elv018. - DOI - PubMed
    1. Hu WF, Chahrour MH, Walsh CA. The diverse genetic landscape of neurodevelopmental disorders. Annu. Rev. Genom. Hum. Genet. 2014;15:195–213. doi: 10.1146/annurev-genom-090413-025600. - DOI - PMC - PubMed

Publication types

MeSH terms

Substances

LinkOut - more resources