. 2021 Apr 27;11(1):9031.
doi: 10.1038/s41598-021-88428-9.

Altered neural oscillations and behavior in a genetic mouse model of NMDA receptor hypofunction

Affiliations

Altered neural oscillations and behavior in a genetic mouse model of NMDA receptor hypofunction

David D Aguilar et al. Sci Rep. .

Abstract

Abnormalities in electroencephalographic (EEG) biomarkers occur in patients with schizophrenia and those clinically at high risk for transition to psychosis and are associated with cognitive impairment. Converging evidence suggests N-methyl-D-aspartate receptor (NMDAR) hypofunction plays a central role in the pathophysiology of schizophrenia and likely contributes to biomarker impairments. Thus, characterizing these biomarkers is of significant interest for early diagnosis of schizophrenia and development of novel treatments. We utilized in vivo EEG recordings and behavioral analyses to perform a battery of electrophysiological biomarkers in an established model of chronic NMDAR hypofunction, serine racemase knockout (SRKO) mice, and their wild-type littermates. SRKO mice displayed impairments in investigation-elicited gamma power that corresponded with reduced short-term social recognition and enhanced background (pre-investigation) gamma activity. Additionally, SRKO mice exhibited sensory gating impairments in both evoked-gamma power and event-related potential amplitude. However, other biomarkers including the auditory steady-state response, sleep spindles, and state-specific power spectral density were generally neurotypical. In conclusion, SRKO mice demonstrate how chronic NMDAR hypofunction contributes to deficits in certain translationally-relevant EEG biomarkers altered in schizophrenia. Importantly, our gamma band findings suggest an aberrant signal-to-noise ratio impairing cognition that occurs with NMDAR hypofunction, potentially tied to impaired task-dependent alteration in functional connectivity.


Conflict of interest statement

All authors except JTC and DTB declare no competing financial interests in relation to the work described. JTC reports holding a patent on D-serine to treat serious mental disorder that is owned by Massachusetts General Hospital but could yield royalties, and a patent on an AI-based EEG method to predict psychotropic drug response. DTB served as a consultant for LifeSci Capital and received research support from Takeda Pharmaceuticals.

Figures
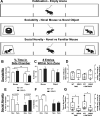
Figure 1
Figure 1
Social Novelty Recognition is Impaired in SRKO mice. (A) Freely behaving SRKO mice (n = 5) and WT littermates (n = 8) were tethered and placed in a three-chamber arena for a five minute habituation, a ten minute sociability stage (novel mouse “1” vs object), and a ten minute social novelty stage (novel mouse “2” vs familiar mouse “1”, see Materials and Methods for detail). During the sociability stage, both WT (white bars) and SRKO mice (black bars) spent a larger percent of time in the chamber containing the novel mouse than the chamber with the novel object (B) suggesting the sociability of SRKO mice is unchanged. There were no between-group differences during the sociability stage for either time spent exploring either chamber (B), number of entries within a 5 cm zone surrounding the novel mouse or object (C), or in the novel mouse/object ratio of these measurements (D), indicating WT and SRKO mice behaved similarly during this phase of the task. During the social recognition stage only WT mice spent more time investigating the novel mouse than the familiar mouse, measured by the percent time in each chamber (E, strong trend) and the number of entries within a 5 cm zone (F). There were significant between-group differences in the novel/familiar mouse ratio for both measurements (G), suggesting that WT animals spent a greater proportion of time investigating novel animals than familiar animals when compared to their SRKO littermates. This suggests SRKO mice demonstrate decreased social novelty recognition or impaired social novelty-related exploration. Stars represent a significant main effect (B) or a significant Holm–Sidak post hoc test following a significant interaction (F) in a two-way ANOVA. Stars in G represent a significant Mann–Whitney U test. In all figures, bar graphs represent mean values ± standard error of the mean (see Supplementary Materials B1 for these values) while boxplots represent the median and 25th–75th percentiles with whiskers that represent minimum and maximum values. Individual values are represented in D and G by hollow squares and triangles. For all experiments the number of stars represents the level of significance (*p < 0.05, **p < 0.01, ***p < 0.001, ****p < 0.0001).
Figure 2
Figure 2
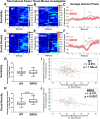
Social Investigation-Elicited Gamma Power Is Impaired in SRKO mice. Frontal cortex social investigation-elicited gamma power (25–58 Hz) was recorded during the behavioral task described in Fig. 1. Grand average spectrograms appear in (A,B) and (D,E) (% of baseline power), while the investigation-elicited gamma power normalized to background gamma is graphed in (C) and (F). The dotted line represents the start of the novel mouse investigation (time 0) and the white boxes outline the data that was analyzed in 0.5 s bins. WT mice (n = 8) had a significantly larger increase in gamma power than SRKO animals (n = 5) during 0.5–1 s for the sociability task (C), and 0–1 s for the social novelty task (F). Greater background gamma power (0–4 s prior to novel mouse investigation, percent of total power) was evident in SRKO mice compared to WT littermates during the social novelty task (H) but not the sociability task (G), suggesting an improper signal-to-noise ratio may contribute to the difference in elicited gamma. Furthermore, there were significant inverse correlations such that greater background gamma power was associated with reduced investigation-elicited gamma power for all novel mouse investigations across both trials for WT (I, n = 232 investigations) and SRKO (J, n = 127 investigations) animals. In the repeated measures correlations, each dot represents a single investigation of a novel mouse, and each individual mouse is represented by a unique color. The data in Fig. 1 and 2 suggest SRKO mice have a deficit in social-elicited gamma in response to a novel mouse investigation. Enhanced background gamma in SRKO mice may be a contributing factor to this deficit. Stars represent significance from multiple t-tests with Holm–Sidak correction (C,F) or a Mann–Whitney U test (H).
Figure 3
Figure 3
Sensory Gating is Impaired in SRKO mice. Sensory gating was measured in the frontal cortex EEG of SRKO mice (n = 10) and WT littermates (n = 9) by averaging the evoked response potential (ERP) of 100 repetitions of two identical 5 kHz 50 ms tones (S1 and S2) separated by 500 ms. Frontal cortex grand average ERP’s are superimposed in (A) for WT (left) and SRKO (right) animals. Although N40 was larger in S1 than S2 for all animals, only WT animals had significantly larger P20 and P20–N40 amplitudes in S1 than in S2 (B,C). The P20–N40 amplitude was normalized as a ratio between ERP1 (from S1) and ERP2 (from S2) before comparing between groups. Compared to WT littermates, SRKO mice had a reduced gating response of P20–N40 amplitude in the frontal cortex as evidenced by a larger S2/S1 ratio (D) and an attenuated difference between S1 and S2 P20–N40 amplitudes (E). Stars in (B) and (C) represent a main effect of stimulus in a two-way RM ANOVA (N40) or significance in a Holm–Sidak post hoc test following a significant interaction in a two-way RM ANOVA (P20, P20–N40). Stars in (D) and (E) represent significance in an unpaired two-tailed Welch’s t-test.
Figure 4
Figure 4
Power Spectral Density Abnormalities Occur in SRKO mice During Sensory Gating. We examined whether there was a sensory gating deficit in evoked gamma power (30–80 Hz). The frontal cortex grand average spectrogram (A) demonstrates the change in evoked power during S1 (1–1.05 s) and S2 (1.5–1.55 s) for WT (left) and SRKO (right) mice. The frequency comparisons in parts (B–D) were calculated using these stimulus times. Similar to ERP amplitude, SRKO mice also demonstrated impaired sensory gating of gamma power (41.7% reduced from S1 to S2) compared to WT littermates (74.8% reduced, B). To examine task-evoked power spectral density differences between genotypes during each stimulus, the log-transformed normalized power for 0.5–100.5 Hz was analyzed using 1 Hz bins. Compared to WT littermates, SRKO animals had decreased power across the frequency spectrum during ERP1 (C) but not during ERP2 (D). Stars represent a significant unpaired two-tailed Welch’s t-test. (C) had a main effect of genotype in a two-way RM ANOVA, represented by a blue bar under the significantly different frequencies.

Similar articles

Cited by

References

    1. McNally JM, McCarley RW. Gamma band oscillations: A key to understanding schizophrenia symptoms and neural circuit abnormalities. Curr. Opin. Psychiatry. 2016;29:202–210. doi: 10.1097/YCO.0000000000000244. - DOI - PMC - PubMed
    1. Gonzalez-Burgos G, Cho RY, Lewis DA. Alterations in cortical network oscillations and parvalbumin neurons in schizophrenia. Biol. Psychiatry. 2015;77:1031–1040. doi: 10.1016/j.biopsych.2015.03.010. - DOI - PMC - PubMed
    1. Cho KK, et al. Gamma rhythms link prefrontal interneuron dysfunction with cognitive inflexibility in Dlx5/6(+/−) mice. Neuron. 2015;85:1332–1343. doi: 10.1016/j.neuron.2015.02.019. - DOI - PMC - PubMed
    1. Toyomaki A, et al. Different P50 sensory gating measures reflect different cognitive dysfunctions in schizophrenia. Schizophr. Res. Cogn. 2015;2:166–169. doi: 10.1016/j.scog.2015.07.002. - DOI - PMC - PubMed
    1. Mikanmaa E, et al. Towards a neurodynamical understanding of the prodrome in schizophrenia. Neuroimage. 2017 doi: 10.1016/j.neuroimage.2017.11.026. - DOI - PubMed

Publication types