. 2021 Apr 27;11(1):9012.
doi: 10.1038/s41598-021-88588-8.

Evidence for magnesium-phosphorus synergism and co-limitation of grain yield in wheat agriculture

Affiliations

Evidence for magnesium-phosphorus synergism and co-limitation of grain yield in wheat agriculture

Martin Weih et al. Sci Rep. .

Abstract

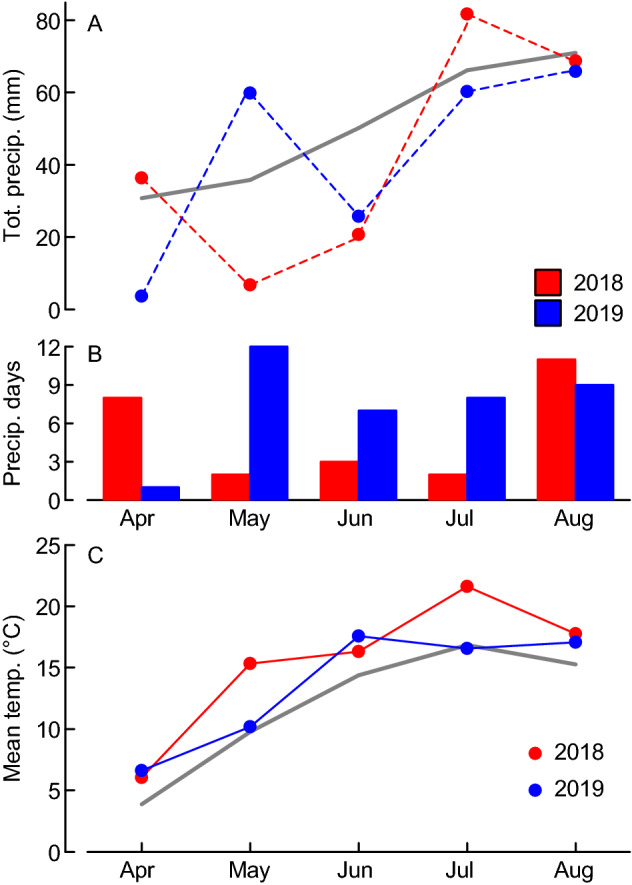
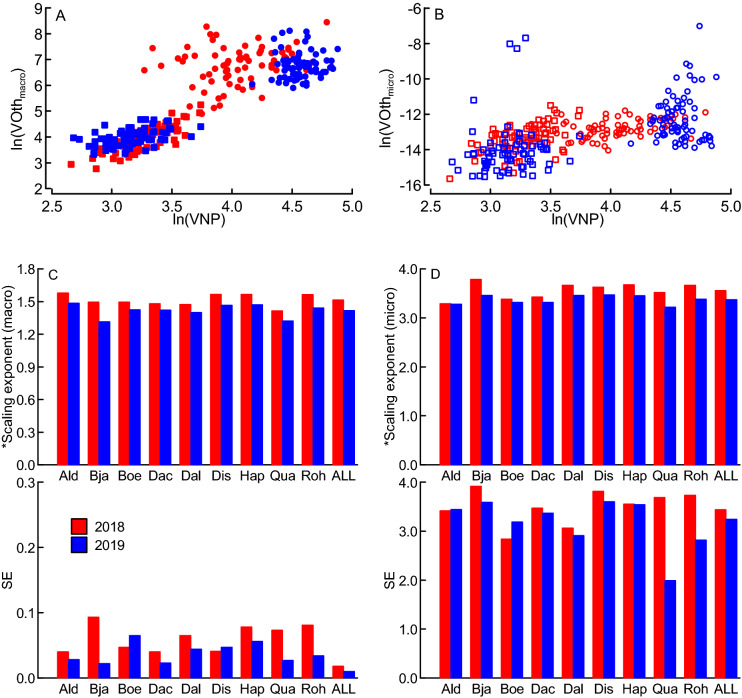
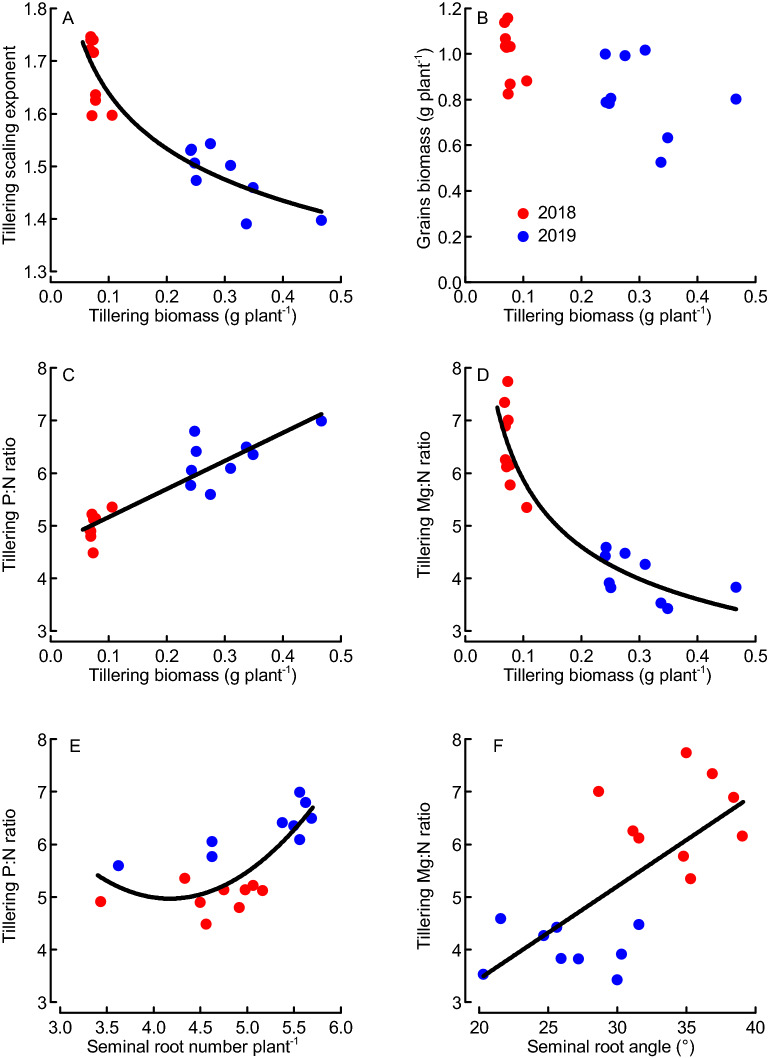
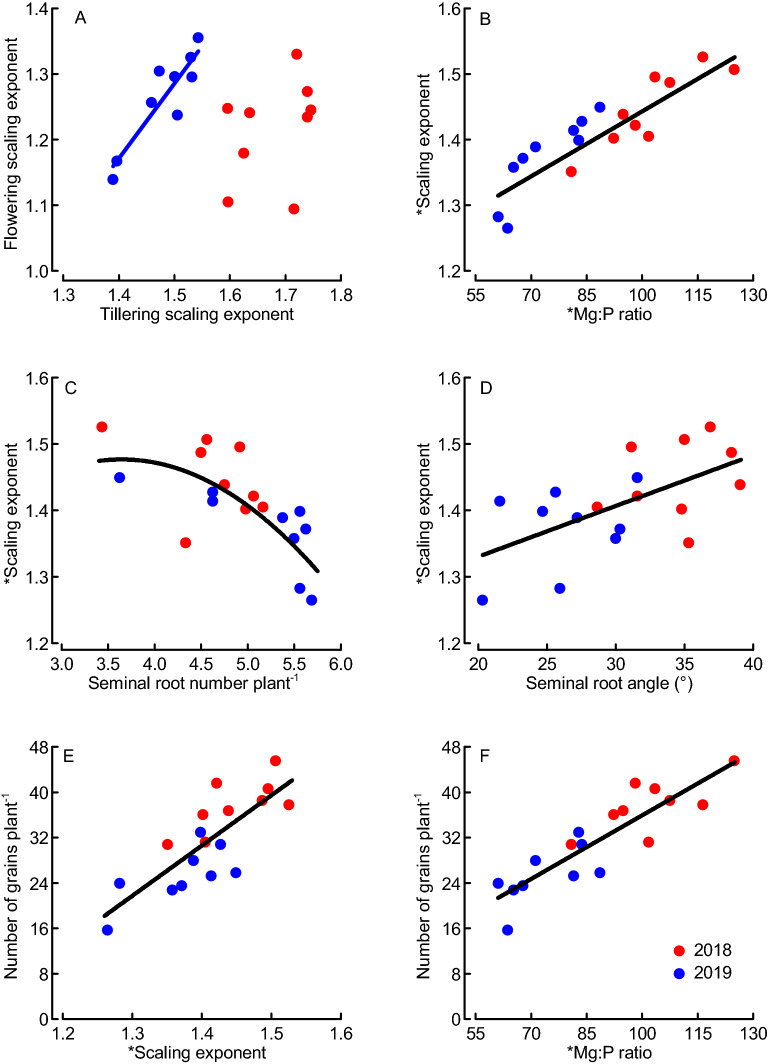
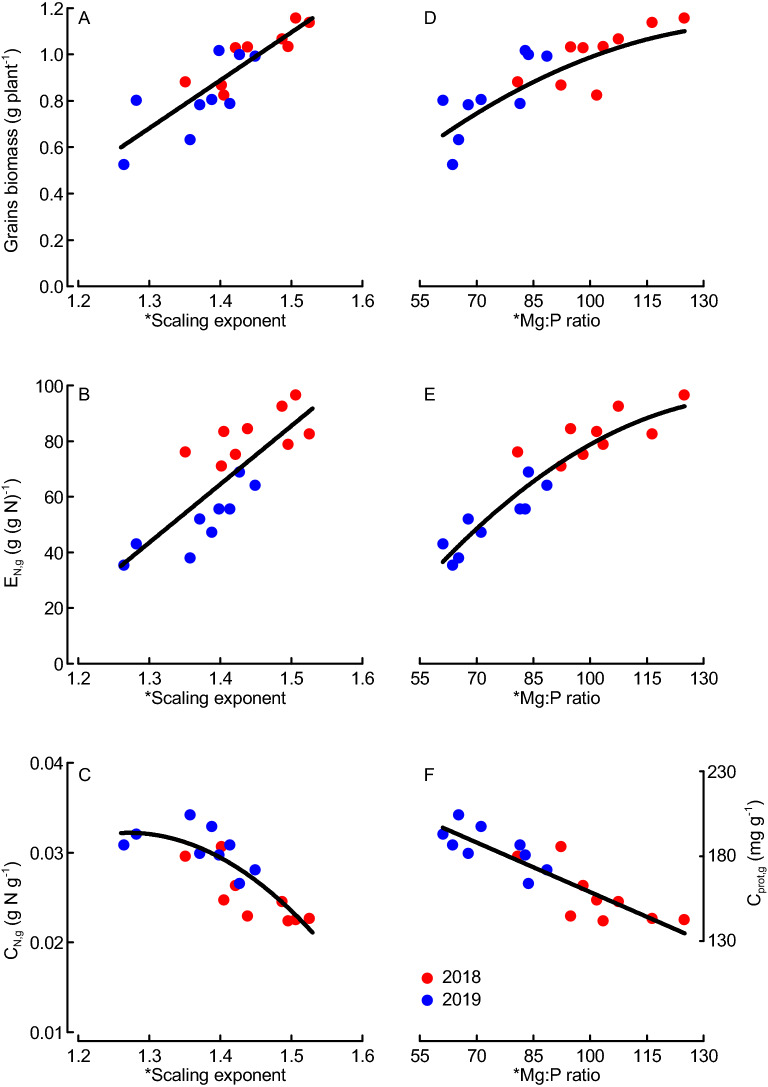
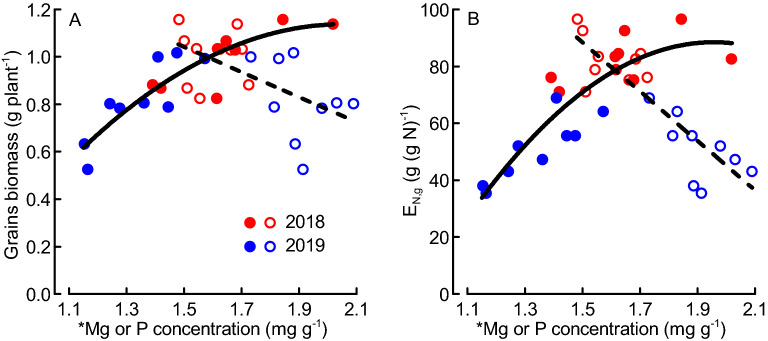
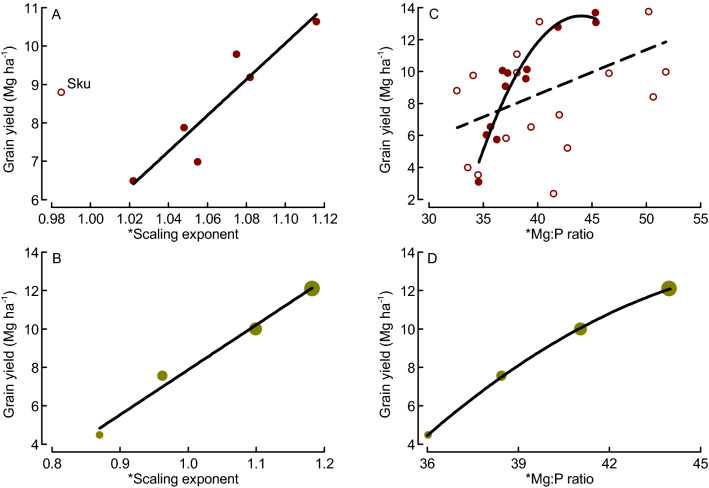
Modern crop production is characterized by high nitrogen (N) application rates, which can influence the co-limitation of harvested yield by other nutrients. Using a multidimensional niche volume concept and scaling exponents frequently applied in plant ecological research, we report that increased N and phosphorus (P) uptake in a growing wheat crop along with enhanced grain biomass is associated with more than proportional increase of other nutrients. Furthermore, N conversion efficiency and grain yield are strongly affected by the magnesium (Mg) to P ratio in the growing crop. We analyzed a field trial in Central Sweden including nine wheat varieties grown during two years with contrasting weather, and found evidence for Mg co-limitation at lower grain yields and P co-limitation at higher yields. We argue that critical concentrations of single nutrients, which are often applied in agronomy, should be replaced by nutrient ratios. In addition, links between plant P and Mg contents and root traits were found; high root number enhanced the P:N ratio, whilst steep root angle, indicating deep roots, increased the Mg:N ratio. The results have significant implications on the management and breeding targets of agriculturally grown wheat, which is one of the most important food crops worldwide.


Conflict of interest statement

The authors declare no competing interests.

Figures

Figure 1
Figure 1
Weather conditions during the experimental periods of the years 2018 and 2019. (A) Total monthly precipitation, (B) number of days with precipitation ≥ 1 mm, and (C) mean air temperature. Long-term (1896–2019) means (solid gray lines) are plotted for comparison. All data were collected at the Ultuna climate station near Uppsala, situated 3 km south-west from the experimental site.
Figure 2
Figure 2
Scatter plots of the volumes (natural logarithm) of plant N and P concentrations (VNP) versus the volumes of other elements (VOth) at tillering (circles) and flowering (squares) (A macroelements, closed symbols; B microelements, open symbols); and the corresponding scaling exponents (means and standard errors, SE, from 4 replicates; C, D) for nine wheat varieties field-grown in Sweden during two years (2018 red, 2019 blue). Data from two soil compaction treatments were included, but not separately presented as no significant differences were found between them. (A, C) VOth = macroelements (Ca, K, Mg, S) and (B, D) VOth = microelements (Cu, Fe, Mn, Zn). For the macroelements, the scaling exponents differed significantly between varieties (ANOVA, N = 16, F = 13.87, P < 0.001) and years (N = 144, F = 23.12, P < 0.001) but not compaction treatments (N = 144, F = 3.14, P = 0.077); for the microelements, scaling exponents did not significantly differ between varieties, years or treatments (ANOVA, P > 0.05). Varieties Ald ‘Alderon’, Bja ‘Bjarne’, Boe ‘Boett’, Dac ‘Dacke’, Dal ‘Dala landrace’, Dis ‘Diskett’, Hap ‘Happy’, Qua ‘Quarna’, Roh ‘Rohan’; ALL indicates the means and SE across all varieties. * indicates scaling exponents based on data from tillering (BBCH29) and flowering (BBCH65). N = 288 in (A) and (B), where the data represent individual replicates.
Figure 3
Figure 3
Scaling exponent (macroelements), nutrient ratios and harvested grains biomass as functions of early vigor biomass and root traits (tillering, BBCH29) across nine wheat varieties field-grown in Sweden during two years (2018, 2019). Regressions: y = 1.314x−0.096, N = 18, R2 = 0.86, P < 0.001 (A); y = 5.340x + 4.630, N = 18, R2 = 0.82, P < 0.001 (C); y = 2.611x−0.352, N = 18, R2 = 0.89, P < 0.001 (D); y = 0.744x2 − 6.210x + 17.927, N = 18, R2 = 0.61, P = 0.001 (E); y = 0.176x − 0.078, N = 18, R2 = 0.47, P = 0.002 (F). Dots represent means from 4 replicates.
Figure 4
Figure 4
Relationships between scaling exponents (macroelements) and/or nutrient ratios at tillering (BBCH29) and flowering (BBCH65), root traits at tillering and number of grains per plant at maturity across nine wheat varieties field-grown in Sweden during two years (2018, 2019). *Indicates that scaling exponents were based on data from tillering and flowering. Regressions: y = 0.426x + 0.501, N = 9, R2 = 0.13, P = 0.345 n.s. (A, 2018); y = 1.148x − 0.436, N = 9, R2 = 0.82, P = 0.001 (A, 2019); y = 0.003x + 1.113, N = 18, R2 = 0.78, P < 0.001 (B); y = − 0.038x2 + 0.277x + 0.972, N = 18, R2 = 0.47, P = 0.002 (C); y = 0.008x + 1.178, N = 18, R2 = 0.36, P = 0.009 (D); y = 88.66x − 93.55, N = 18, R2 = 0.63, P < 0.001 (E); y = 0.374x − 1.48, N = 18, R2 = 0.77, P < 0.001 (F). Dots represent means from 4 replicates.
Figure 5
Figure 5
Grains biomass, grain-specific nitrogen (N) efficiency (EN,g) and grain N concentration (CN,g) or grain protein concentration (Cprot,g) as functions of the scaling exponent for macroelements (A to C) and Mg:P ratio (D to F) for nine wheat varieties field-grown in Sweden during two years (2018, 2019). *Indicates that scaling exponents were based on data from tillering (BBCH29) and flowering (BBCH65). Regressions: y = 2.069x − 2.008, N = 18, R2 = 0.73, P < 0.001 (A); y = 209.9x − 229.34, N = 18, R2 = 0.63, P < 0.001 (B); y = − 0.166x2 + 0.422x − 0.236, N = 18, R2 = 0.68, P < 0.001 (C); y = − 6.434E − 5x2 + 0.019x − 0.269, N = 18, R2 = 0.70, P < 0.001 (D); y = − 0.008x2 + 2.419x − 80.15, N = 18, R2 = 0.88, P < 0.001 (E); y = − 0.000184x + 0.044, N = 18, R2 = 0.77, P < 0.001 (F); the y2 axes applied for (C) and (F) were adjusted according to the linear regression Cprot,g = 5288.5 * CN,g + 23.5, R2 = 0.97, P < 0.001, N = 36. Dots represent means from 4 replicates.
Figure 6
Figure 6
Grains biomass (A) and grain-specific nitrogen efficiency (EN,g) (B) as functions of the shoot magnesium (Mg, closed symbols) or phosphorus (P, open symbols) concentrations for nine wheat varieties field-grown in Sweden during two years (2018, 2019). * indicates that Mg or P concentrations were based on data from tillering (BBCH29) and flowering (BBCH65). Regressions: y = − 0.637x2 + 2.617x − 1.55, N = 18, R2 = 0.80, P < 0.001 (A, solid line for Mg); y = − 0.528x + 1.834, N = 18, R2 = 0.34, P = 0.011 (A, broken line for P); y = − 84.08x2 + 329.08x − 233.51, N = 18, R2 = 0.79, P < 0.001 (B, solid line for Mg); y = − 86.41x + 218.03, N = 18, R2 = 0.76, P < 0.001 (B, broken line for P). Dots represent means from 4 replicates.
Figure 7
Figure 7
Mean winter wheat grain yields as function of scaling exponent for macroelements (A, B) and Mg:P ratio (C, D) plotted for various locations in Southern and Central Sweden (A, C) or across different fertilization levels at the same locations (B, D; increasing symbol size indicates increasing fertilizer level i.e. 0, 80, 160 and 240 kg N ha−1) based on the original data by Hamnér et al. (2017). * indicates that scaling exponents were based on data from stem elongation (BBCH37) and flowering (BBCH65). Regressions: y = 46.92x − 41.55, N = 6, R2 = 0.86, P = 0.007; the data point for the location “Skultuna” (Sku) was not considered in the regression (A); y = 23.404x − 15.530, N = 4, R2 = 0.98, P < 0.001 (B); y1 = 0.28x − 2.64, N = 28, R2 = 0.21, P = 0.015 (all data, C, broken line) and y2 = − 0.103 × 2 + 0.777x − 20.87, N = 12, R2 = 0.90, P < 0.001 (only data from the locations Grillby, Nybble and Strömsholm, C, solid line) (C); y = − 0.052x2 + 5.126x − 112.51, N = 4, R2 = 1.00, P = 0.016 (D). Dots represent means of 4 fertilization treatments and 4 replicates (A), 7 locations and 4 replicates (B, D) or 4 replicates (C).

References

    1. Elser JJ, et al. Global analysis of nitrogen and phosphorus limitation of primary producers in freshwater, marine and terrestrial ecosystems. Ecol. Lett. 2007;10:1135–1142. doi: 10.1111/j.1461-0248.2007.01113.x. - DOI - PubMed
    1. Mengel K, Kirkby EA. Principles of Plant Nutrition. Kluwer Academic Publishers; 2001.
    1. Reich M, Aghajanzadeh T, De Kok LJ. Physiological basis of plant nutrient use efficiency—Concepts, opportunities and challenges for its improvement. In: Hawkesford MJ, Kopriva S, De Kok LJ, editors. Nutrient Use Efficiency in Plants: Concepts and Approaches. Springer; 2014.
    1. Agren GI. Ideal nutrient productivities and nutrient proportions in plant growth. Plant Cell Environ. 1988;11:613–620. doi: 10.1111/j.1365-3040.1988.tb01803.x. - DOI
    1. Weih M, Hamner K, Pourazari F. Analyzing plant nutrient uptake and utilization efficiencies: Comparison between crops and approaches. Plant Soil. 2018;430:7–21. doi: 10.1007/s11104-018-3738-y. - DOI

Publication types