. 2021 Apr 27;4(1):506.
doi: 10.1038/s42003-021-02024-1.

Targeted transcriptome analysis using synthetic long read sequencing uncovers isoform reprograming in the progression of colon cancer

Affiliations

Targeted transcriptome analysis using synthetic long read sequencing uncovers isoform reprograming in the progression of colon cancer

Silvia Liu et al. Commun Biol. .

Abstract

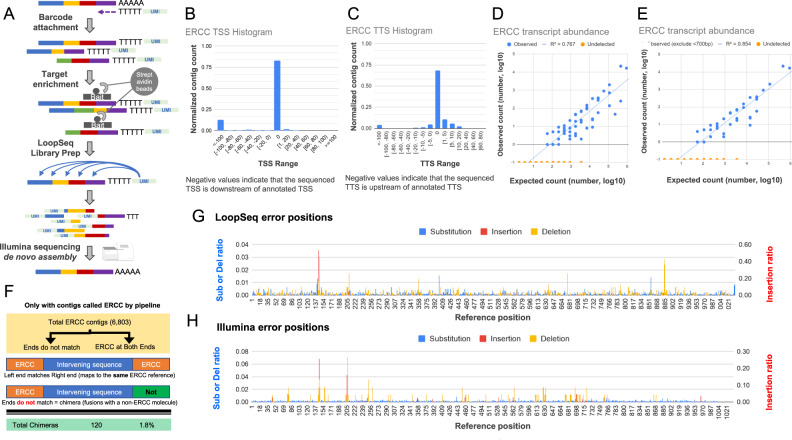
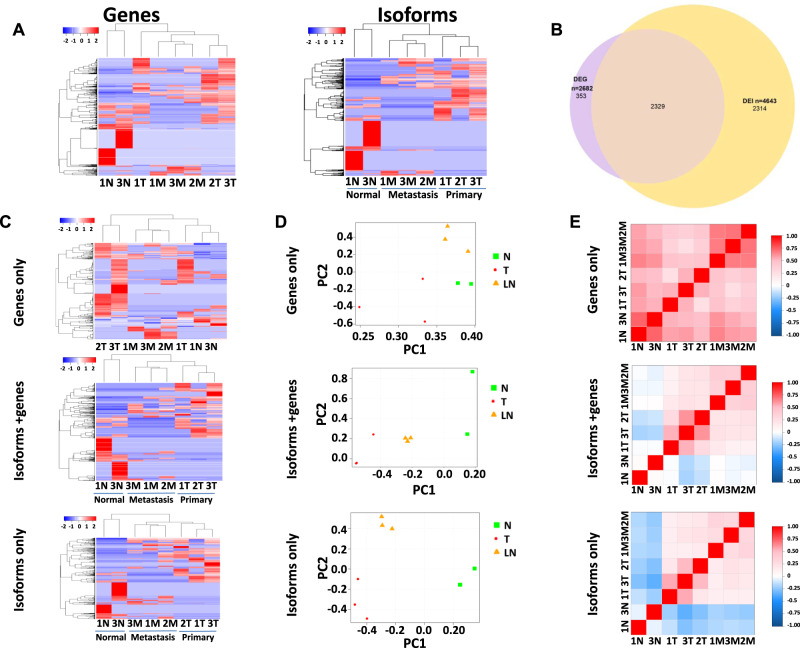
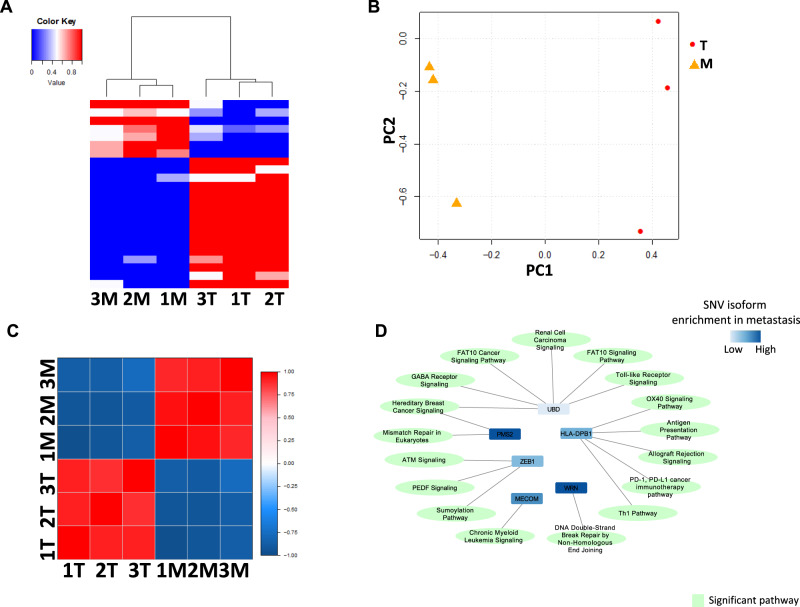
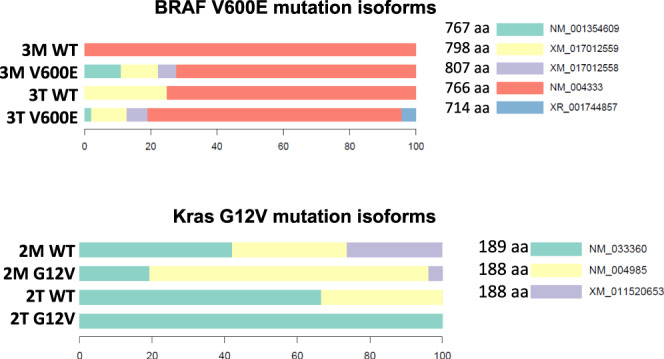
The characterization of human gene expression is limited by short read lengths, high error rates and large input requirements. Here, we used a synthetic long read (SLR) sequencing approach, LoopSeq, to generate accurate sequencing reads that span full length transcripts using standard short read data. LoopSeq identified isoforms from control samples with 99.4% accuracy and a 0.01% per-base error rate, exceeding the accuracy reported for other long-read technologies. Applied to targeted transcriptome sequencing from colon cancers and their metastatic counterparts, LoopSeq revealed large scale isoform redistributions from benign colon mucosa to primary colon cancer and metastatic cancer and identified several previously unknown fusion isoforms. Strikingly, single nucleotide variants (SNVs) occurred dominantly in specific isoforms and some SNVs underwent isoform switching in cancer progression. The ability to use short reads to generate accurate long-read data as the raw unit of information holds promise as a widely accessible approach in transcriptome sequencing.


Conflict of interest statement

The authors declare the following competing interests: I.W., M.B., and T.B.Y. are employees of Loop Genomics, Inc. S.L., Y.P.Y., B.R., and J.H.L. declare no competing interests.

Figures

Fig. 1
Fig. 1. Schematics and validation of LoopSeq long-read transcriptome sequencing.
A Overview of the library preparation for isoform sequencing using LoopSeq, including an optional target enrichment step to focus the sequencing depth on genes or isoforms of interest. B The transcription start site (TSS) of reconstructed ERCC contigs as compared to the reference annotation. C The transcription termination site (TTS) of reconstructed ERCC contigs as compared to the reference annotation. D Comparison of ERCC transcript counts between the observed abundance as determined by reconstructed contigs and the expected abundance given the input into the library preparation. E Comparison of ERCC transcript counts between the observed and the expected abundance, excluding references <700 bp. F Overview of the chimera contig detection. Demonstration of: G the positional bias of LoopSeq errors along an ERCC reference and H the positional bias of Illumina short-read errors along the same ERCC reference. The ratio of substitution (left axis), deletion (left axis), and insertion errors (right axis) against the position on ERCC-0002 reference are shown. The plotted values are the ratio of each error at a given reference position normalized by the overall error rate of a given error type. The Illumina short-reads used for error analysis are obtained from previously published data.
Fig. 2
Fig. 2. Tissue segregation by cancer progression stage using isoform-level versus gene-level expression data.
A Hierarchical clustering of benign colon samples adjacent to cancer (1 N and 3 N), primary colon cancer samples (1–3 T) and metastatic colon cancer samples (1–3 M) based on differentially expressed genes (left) or isoforms (right). The color reflects the indicated-row Z score. B Venn diagram of overlapping differentially expressed genes and isoforms in colon cancers, metastases, and benign colon tissues adjacent to cancer. C Hierarchical clustering of colon samples based on differential expressed genes but not isoforms (top), or differential expressed genes accompanied with concomitant isoform differential expression (middle), or different isoform expressions without alteration of gene expression (bottom). The color reflects the indicated-row Z score. D Principal component analyses of benign colon tissues adjacent to cancer, primary colon cancers, and metastatic colon cancers based on differential gene expression without isoform expression alteration (top), or differential gene expression with concomitant isoform alteration (middle), or differential isoform expression without the alteration of gene expression (bottom). E Pearson’s correlation of benign colon tissues adjacent to cancer, primary colon cancers, and metastatic colon cancers based on differential gene expression without isoform expression alteration (top), or differential gene expression with concomitant isoform alteration (middle), or differential isoform expression without the alteration of gene expression (bottom). The color reflects Pearson’s correlation coefficient for the pairing samples.
Fig. 3
Fig. 3. Isoform switches of single-nucleotide variant between primary colon cancers and metastatic colon cancers.
A Hierarchical clustering between primary colon cancers and metastatic colon cancers based on the quantities of non-synonymous SNVs of 23 isoforms in each sample. The color reflects SNV rate by fraction. B Principal component analyses of primary colon cancers and metastatic colon cancers based on the quantities of non-synonymous SNVs of (A). C Pearson’s correlation of primary colon cancers and metastatic colon cancers based on the quantities of non-synonymous SNVs of (A). The color reflects Pearson’s correlation coefficient for the pairing samples. D Pathway analysis of 23 single-nucleotide-variant isoforms showed enrichment in genes involved in HLA/CD74 antigen presentation pathways.
Fig. 4
Fig. 4. Mutant isoform switching of BRAF V600E and K-ras G12V in colon cancers.
Top panel: Isoform distribution of V600E of BRAF in colon cancer. Bottom panel: Isoform distribution of G12V of KRAS in colon cancer.
Fig. 5
Fig. 5. Validation of previously unknown fusion gene isoforms identified in colon cancers through LoopSeq sequencing.
A STAMBPL1-FAS fusion. Top: diagram of mini genomes of STAMBPL1 and FAS. Direction of transcription and distance between the two genes are indicated. Middle: mRNA represented by exons from each gene. Bottom: diagram of functional protein domains of STAMBPL1 and FAS. B ZNF124-SMYD3 fusion. Top: diagram of minigenomes of ZNF124 and SMYD3. Direction of transcription and distance between the two genes are indicated. Middle: mRNA represented by exons from each gene. Bottom: diagram of functional protein domains of ZNF124 and SMYD3. C PTPRK-ECHCD1 fusion. Top: diagram of minigenomes of PTPRK and ECHCD1. Direction of transcription and distance between the two genes are indicated. Middle: mRNA represented by exons from each gene. Bottom: diagram of functional protein domains of PTPRK and ECHCD1. D VAPB-GNAS fusion. Top: diagram of minigenomes of VAPB and GNAS. Direction of transcription and distance between the two genes are indicated. Middle: mRNA represented by exons from each gene. Bottom: diagram of functional protein domains of VAPB and GNAS.

Similar articles

Cited by

References

    1. Ronaghi M, Karamohamed S, Pettersson B, Uhlen M, Nyren P. Real-time DNA sequencing using detection of pyrophosphate release. Anal. Biochem. 1996;242:84–89. doi: 10.1006/abio.1996.0432. - DOI - PubMed
    1. Schneider TD, Stephens RM. Sequence logos: a new way to display consensus sequences. Nucleic Acids Res. 1990;18:6097–6100. doi: 10.1093/nar/18.20.6097. - DOI - PMC - PubMed
    1. Moorthie S, Mattocks CJ, Wright CF. Review of massively parallel DNA sequencing technologies. HUGO J. 2011;5:1–12. doi: 10.1007/s11568-011-9156-3. - DOI - PMC - PubMed
    1. Black DL. Mechanisms of alternative pre-messenger RNA splicing. Annu. Rev. Biochem. 2003;72:291–336. doi: 10.1146/annurev.biochem.72.121801.161720. - DOI - PubMed
    1. Leff SE, Rosenfeld MG, Evans RM. Complex transcriptional units: diversity in gene expression by alternative RNA processing. Annu. Rev. Biochem. 1986;55:1091–1117. doi: 10.1146/annurev.bi.55.070186.005303. - DOI - PubMed

Publication types

Substances