. 2021 Apr 27;11(1):9079.
doi: 10.1038/s41598-021-88640-7.

Spectroscopic evaluation of carcinogenesis in endometrial cancer

Affiliations

Spectroscopic evaluation of carcinogenesis in endometrial cancer

Joanna Depciuch et al. Sci Rep. .

Abstract

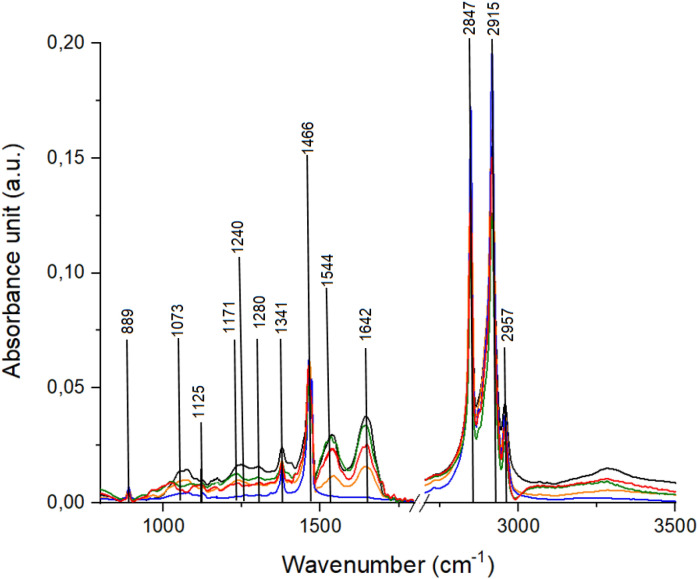
Carcinogenesis is a multifaceted process of cancer formation. The transformation of normal cells into cancerous ones may be difficult to determine at a very early stage. Therefore, methods enabling identification of initial changes caused by cancer require novel approaches. Although physical spectroscopic methods such as FT-Raman and Fourier Transform InfraRed (FTIR) are used to detect chemical changes in cancer tissues, their potential has not been investigated with respect to carcinogenesis. The study aimed to evaluate the usefulness of FT-Raman and FTIR spectroscopy as diagnostic methods of endometrial cancer carcinogenesis. The results indicated development of endometrial cancer was accompanied with chemical changes in nucleic acid, amide I and lipids in Raman spectra. FTIR spectra showed that tissues with development of carcinogenesis were characterized by changes in carbohydrates and amides vibrations. Principal component analysis and hierarchical cluster analysis of Raman spectra demonstrated similarity of tissues with cancer cells and lesions considered precursor of cancer (complex atypical hyperplasia), however they differed from the control samples. Pearson correlation test showed correlation between cancer and complex atypical hyperplasia tissues and between non-cancerous tissue samples. The results of the study indicate that Raman spectroscopy is more effective in assessing the development of carcinogenesis in endometrial cancer than FTIR.


Conflict of interest statement

The authors declare no competing interests.

Figures

Figure 1
Figure 1
Raman spectra of samples: control (black spectrum); atrophic endometrium (orange spectrum); complex atypical hyperplasia (red spectrum); endometrial polyp (green spectrum); endometrioid adenocarcinoma (blue spectrum).
Figure 2
Figure 2
FTIR spectra of samples: control (black spectrum); atrophic endometrium (orange spectrum); complex atypical hyperplasia (red spectrum); endometrial polyp (green spectrum); endometrioid adenocarcinoma (blue spectrum).
Figure 3
Figure 3
Mean ± standard error of the mean (SEM) intensity values of the individual peaks measured with Raman (a) and FTIR (b) for all groups of tissue samples, where color bars stand for: control (black spectrum); atrophic endometrium (orange spectrum); complex atypical hyperplasia (red spectrum); endometrial polyp (green spectrum); endometrioid adenocarcinoma (blue spectrum). Data was analyzed using one-way ANOVA followed by Tukey's post hoc test. Statistical significance was adopted at *p < 0.05 versus Control; ^ p < 0.05 versus atrophic endometrium; & p < 0.05 versus complex atypical hyperplasia; # p < 0.05 versus endometrial polyp; + p < 0.05 versus endometrioid adenocarcinoma.
Figure 4
Figure 4
PCA (a, c, e, f) and HCA (b, d) analysis of: control (black dot); atrophic endometrium (orange dot); complex atypical hyperplasia (red dot); endometrial polyp (green dot); endometrioid adenocarcinoma (blue dot) Raman (a, b, e) and FTIR (c, d, f) spectra. Two-dimensional (2D) scores plot of samples with differences in chemical compositions presented through the selected spectral regions: all spectral region for Raman spectra and points corresponding to C–O stretching mode of C–OH groups of serine, threonine, and tyrosine of protein and νC–O vibration from carbohydrates for FTIR data. The results for average spectra were shown in Figure (ad) and for all analyzed samples—e, f with marker with vectors of least-squared lines representing the various groups.
Figure 5
Figure 5
Plots of predicted for Raman (a) and FTIR (d) region, which could be used to separate endometrial tissues with different carcinogenesis stages. Normal Probability Plot of residual collected from predicted plots for Raman (b) and FTIR (e) spectra. VIP values plot for the all analyzed Raman (c) and FTIR (f) range with 0.8 VIP thresholds, where colors stands for the following samples: control (black); atrophic endometrium (orange); complex atypical hyperplasia (red); endometrial polyp (green); endometrioid adenocarcinoma (blue).

References

    1. Rodriguez AC, Blanchard Z, Maurer KA, Gertz J. Estrogen signaling in endometrial cancer: a key oncogenic pathway with several open questions. Horm. Cancer. 2019;10:51–63. doi: 10.1007/s12672-019-0358-9. - DOI - PMC - PubMed
    1. Cornel KMC, et al. Gene promoter methylation in endometrial carcinogenesis. Pathol. Oncol. Res. 2019;25:659–667. doi: 10.1007/s12253-018-0489-2. - DOI - PMC - PubMed
    1. Reed SD, et al. Complex hyperplasia with and without atypia: clinical outcomes and implications of progestin therapy. Obstet. Gynecol. 2010;116:365–373. doi: 10.1097/AOG.0b013e3181e93330. - DOI - PMC - PubMed
    1. Barnas E, et al. Simultaneous FTIR and Raman spectroscopy in endometrial atypical hyperplasia and cancer. Int. J. Mol. Sci. 2020;21:4828. doi: 10.3390/ijms21144828. - DOI - PMC - PubMed
    1. Epstein JB, Zhang L, Rosin M. Advances in the diagnosis of oral premalignant and malignant lesions. J. Can. Dent. Assoc. 2002;68:617–621. - PubMed