. 2021 May;22(5):639-653.
doi: 10.1038/s41590-021-00922-4. Epub 2021 Apr 27.

Single-cell sequencing of human white adipose tissue identifies new cell states in health and obesity

Affiliations

Single-cell sequencing of human white adipose tissue identifies new cell states in health and obesity

Andrew D Hildreth et al. Nat Immunol. 2021 May.

Abstract

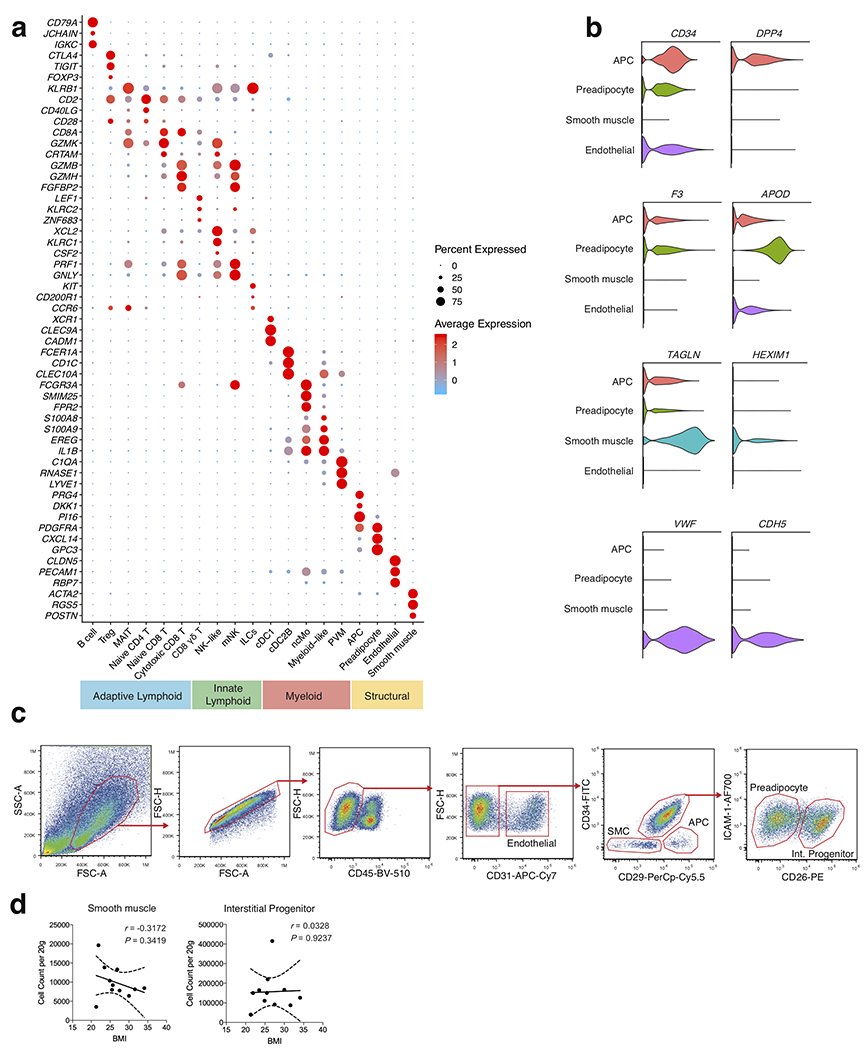
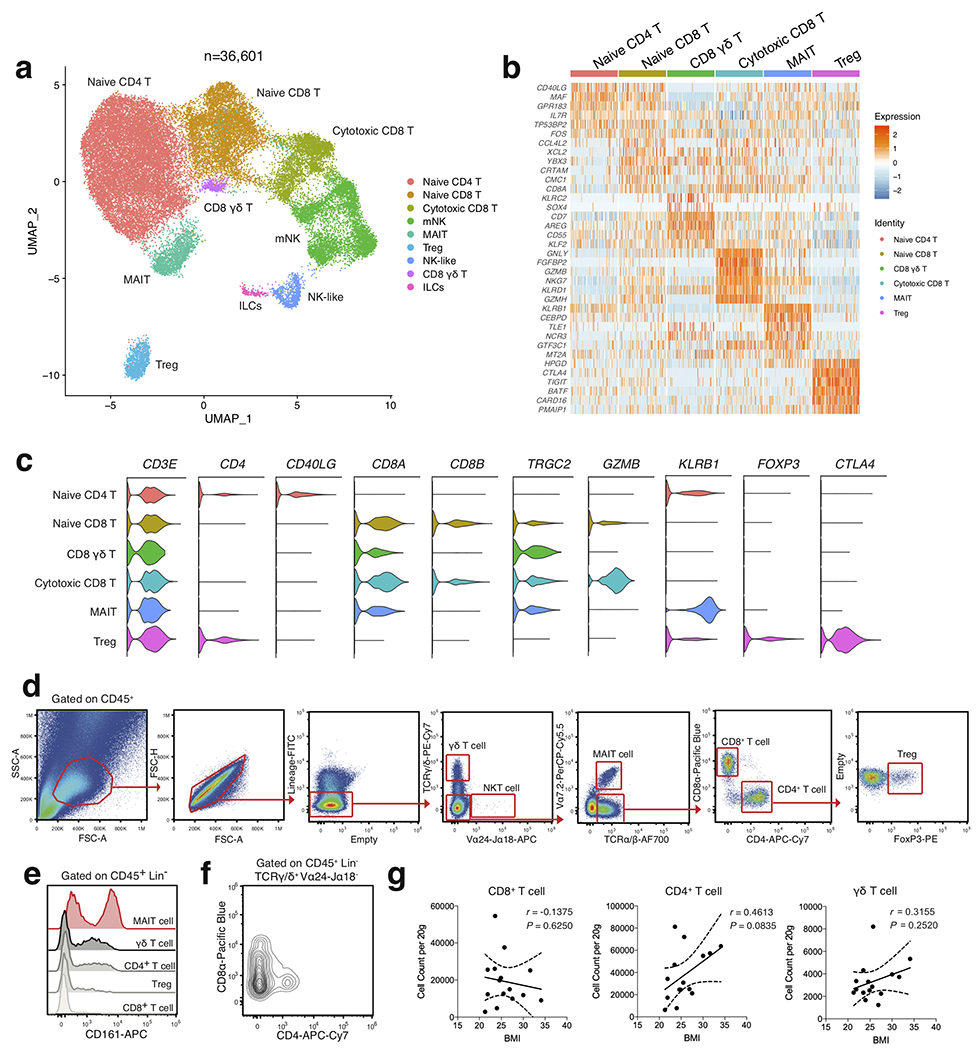
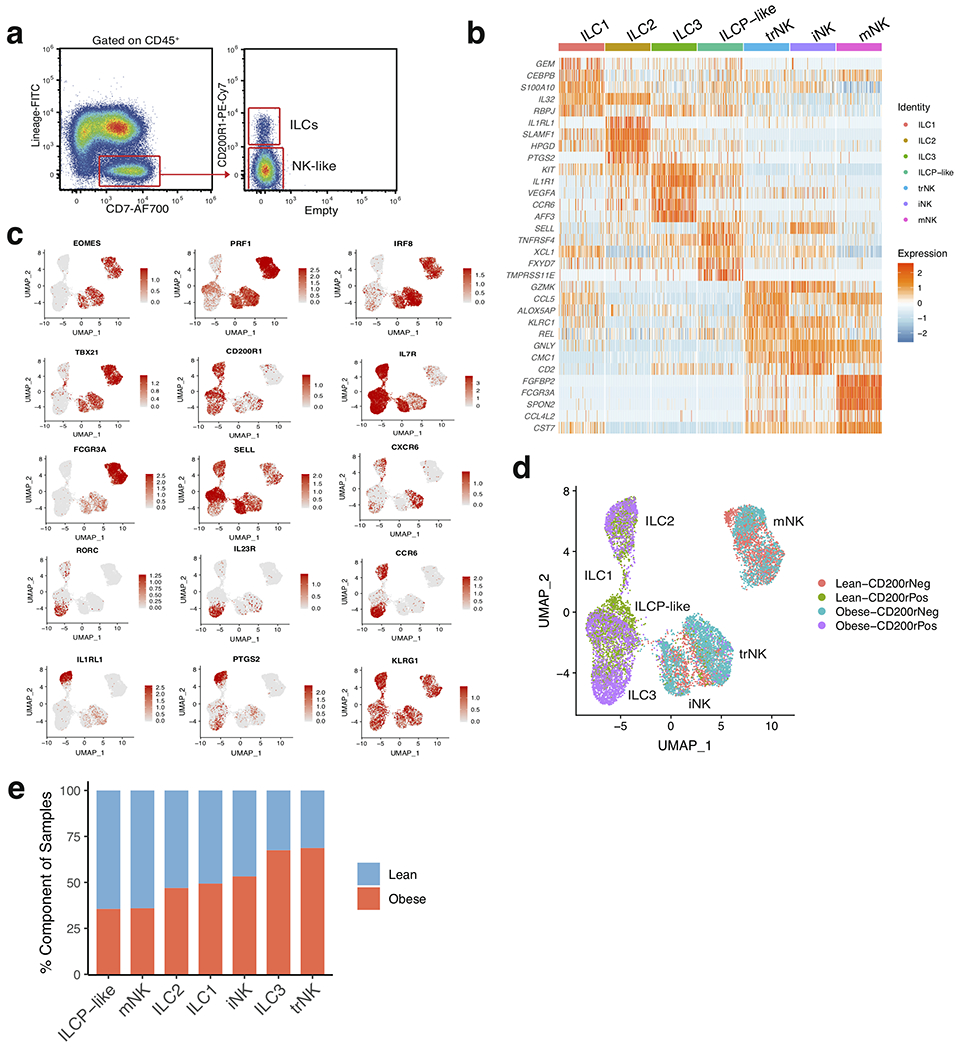
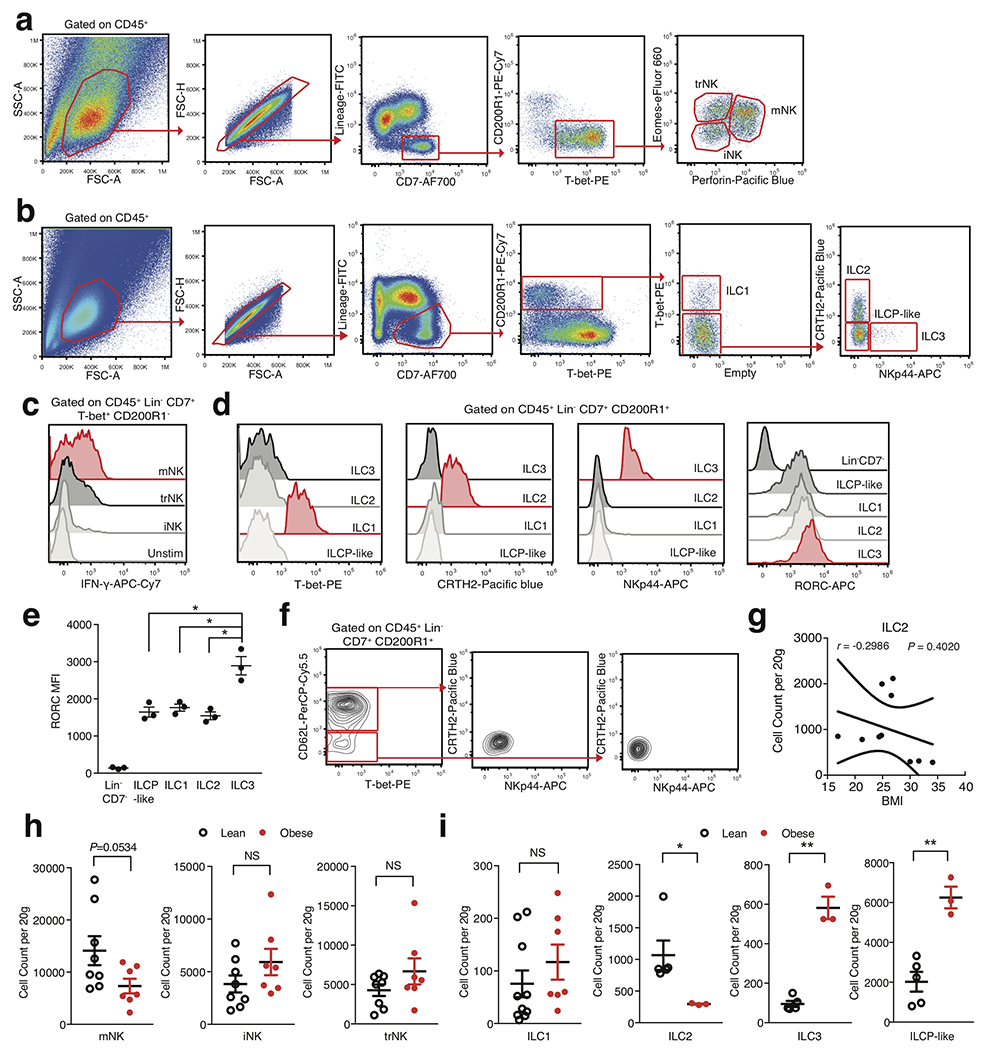
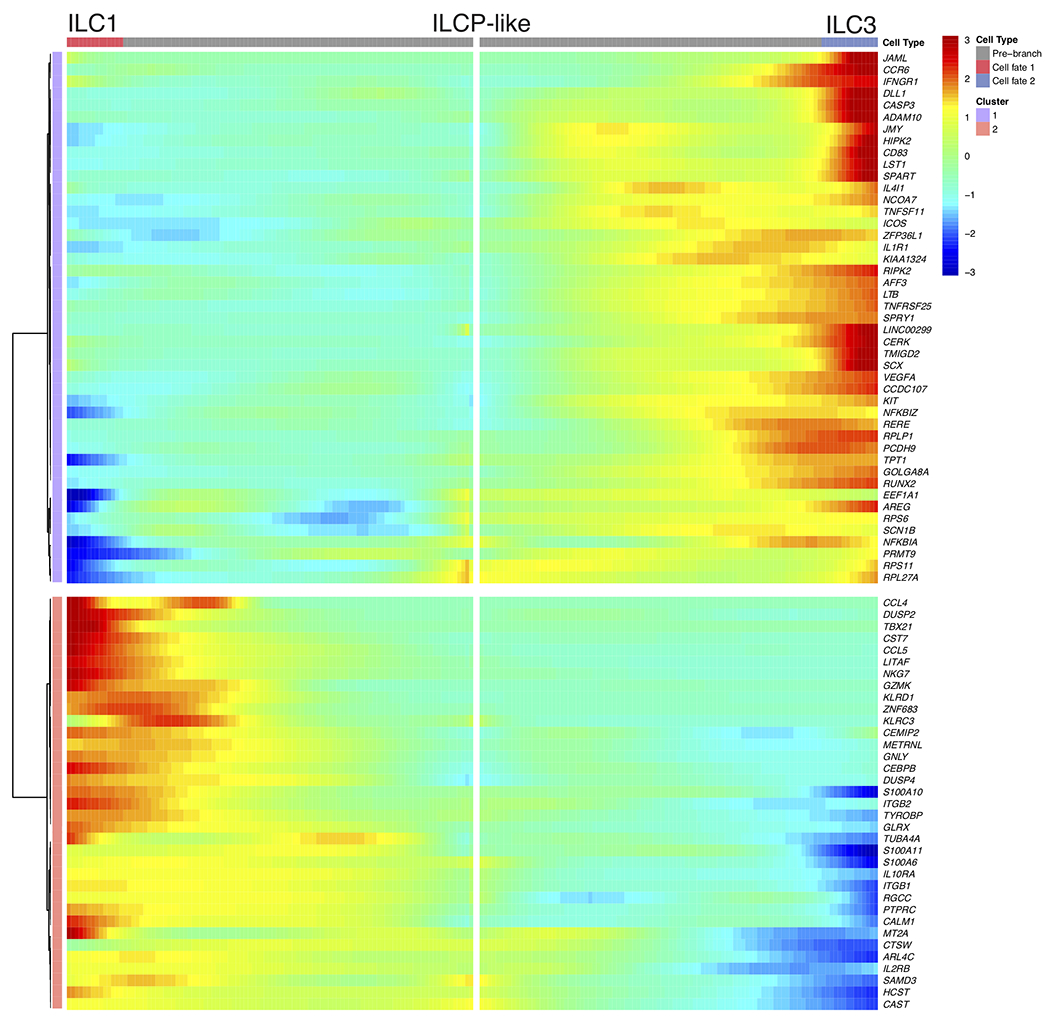
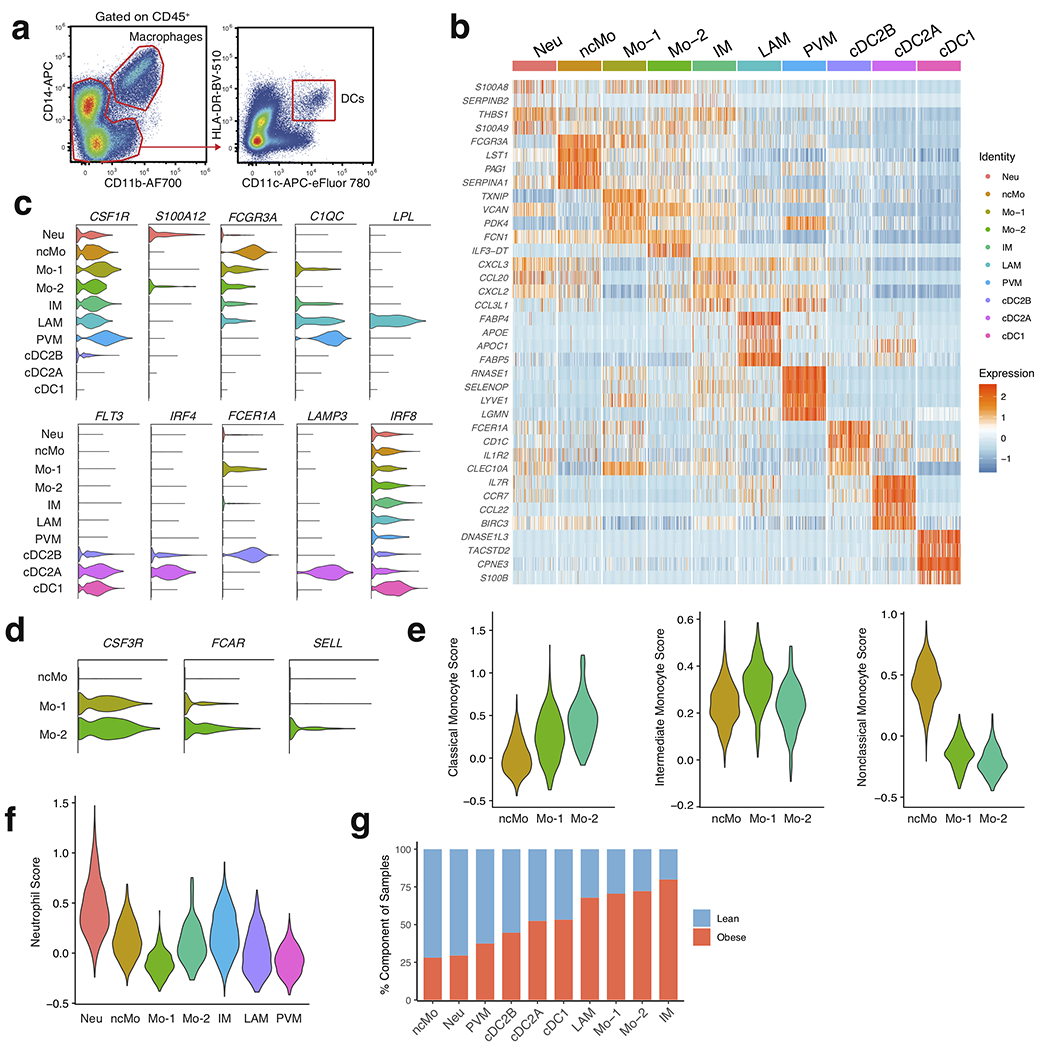
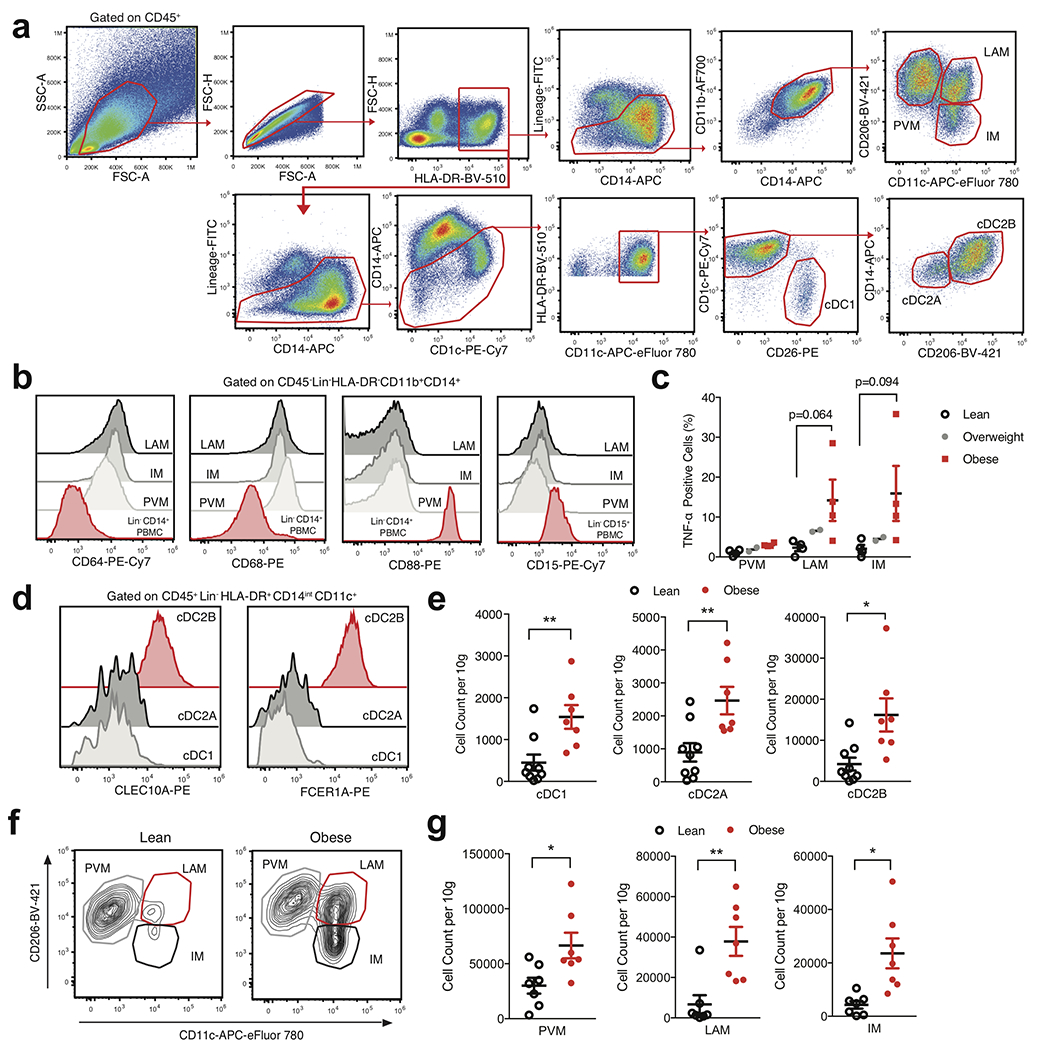
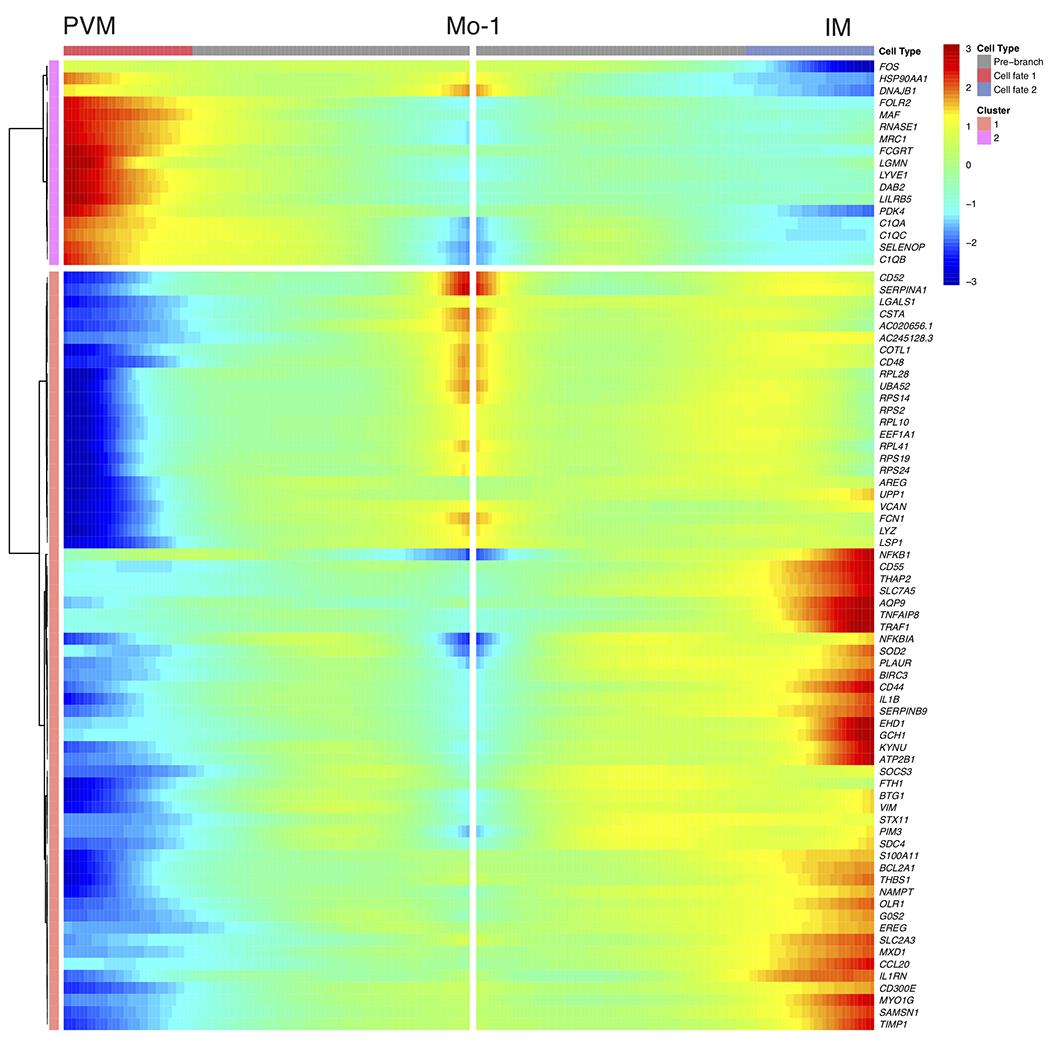
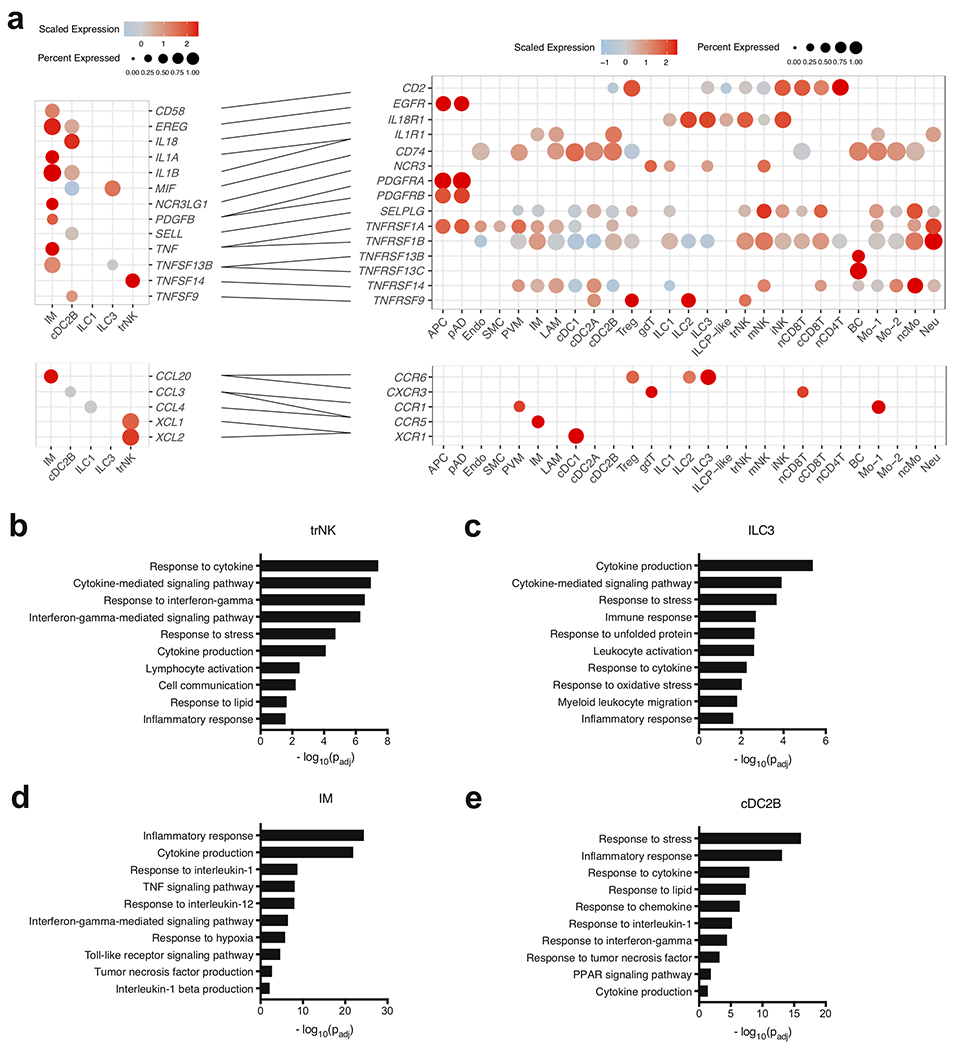
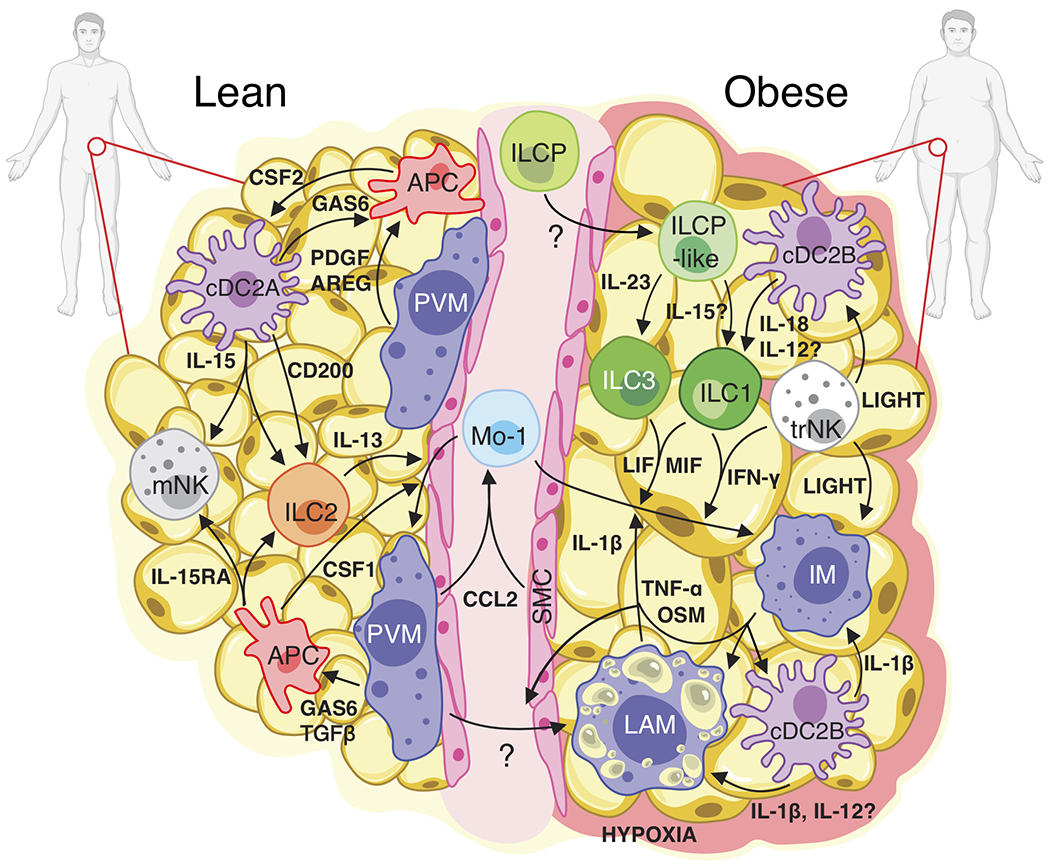
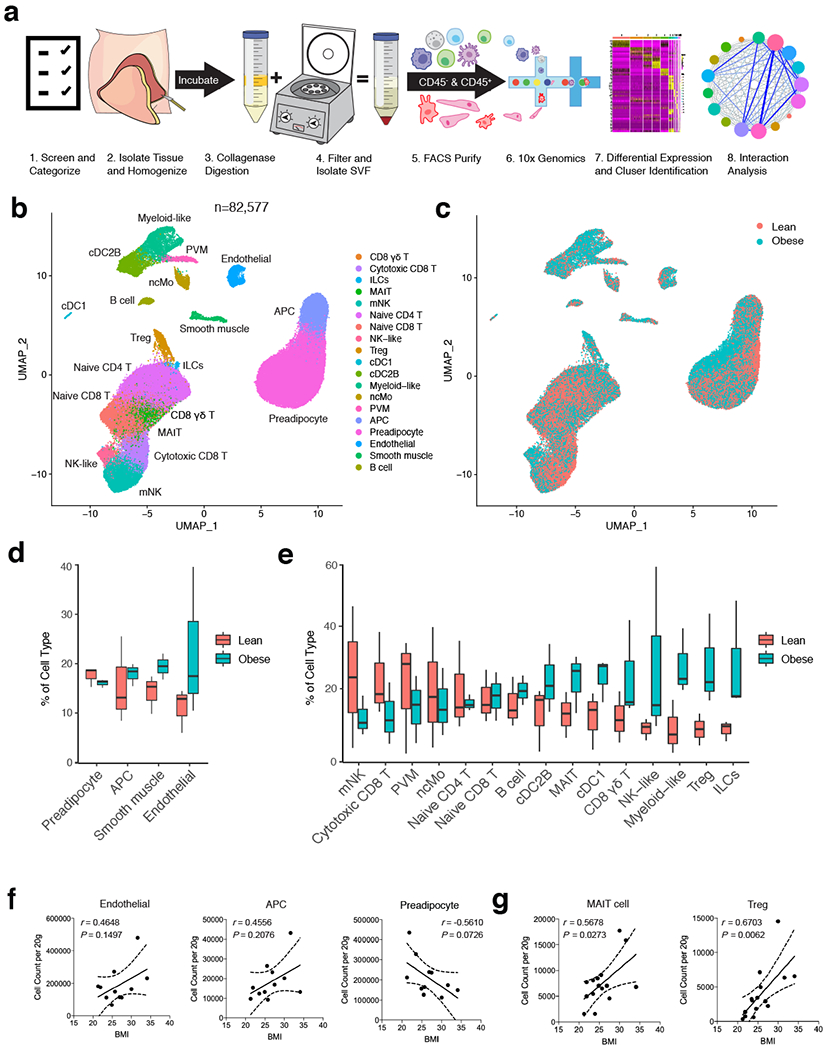
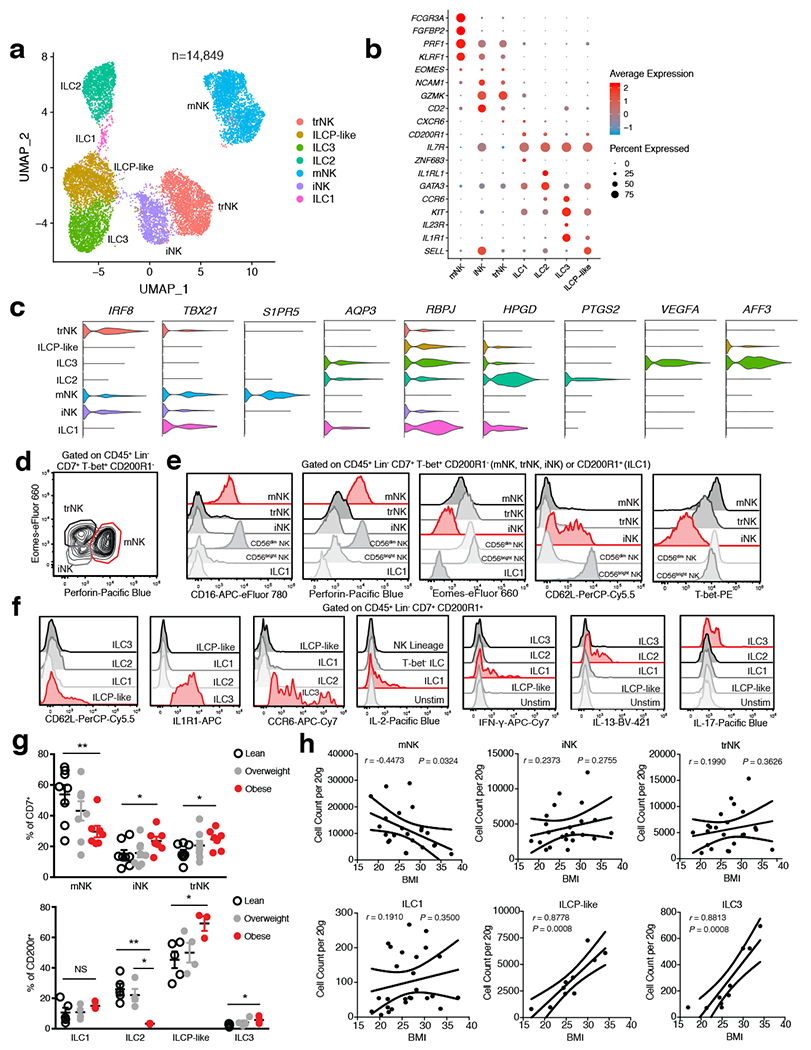
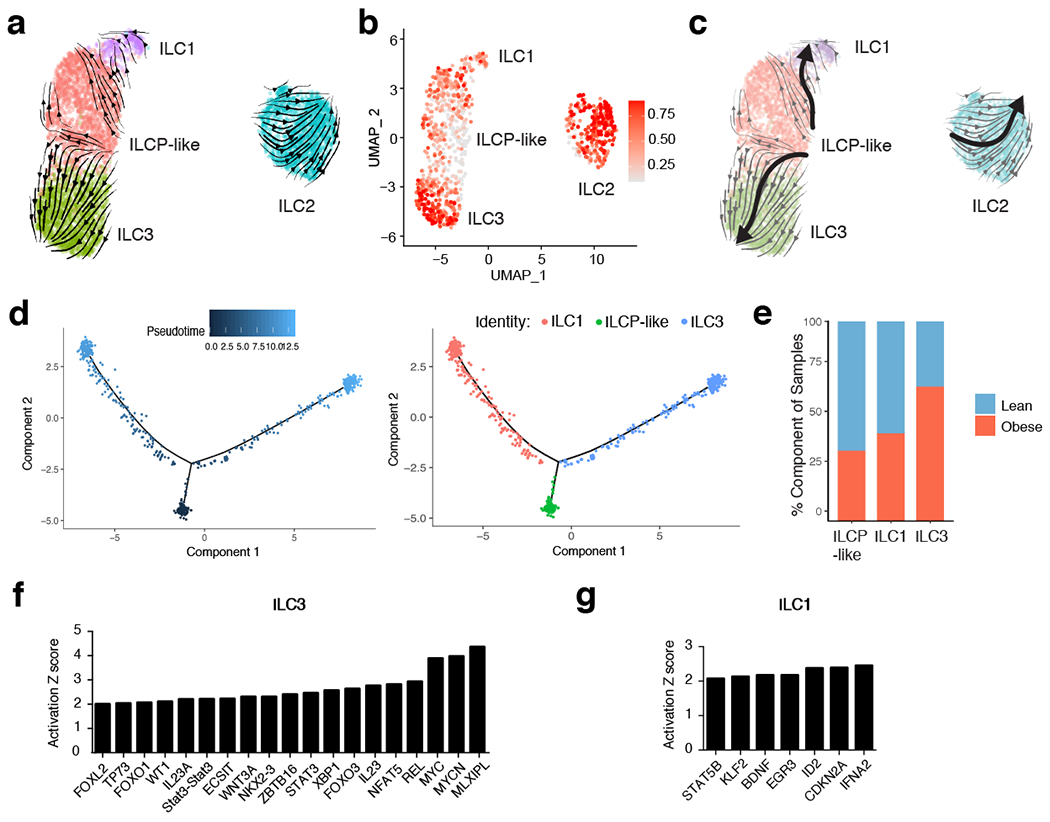
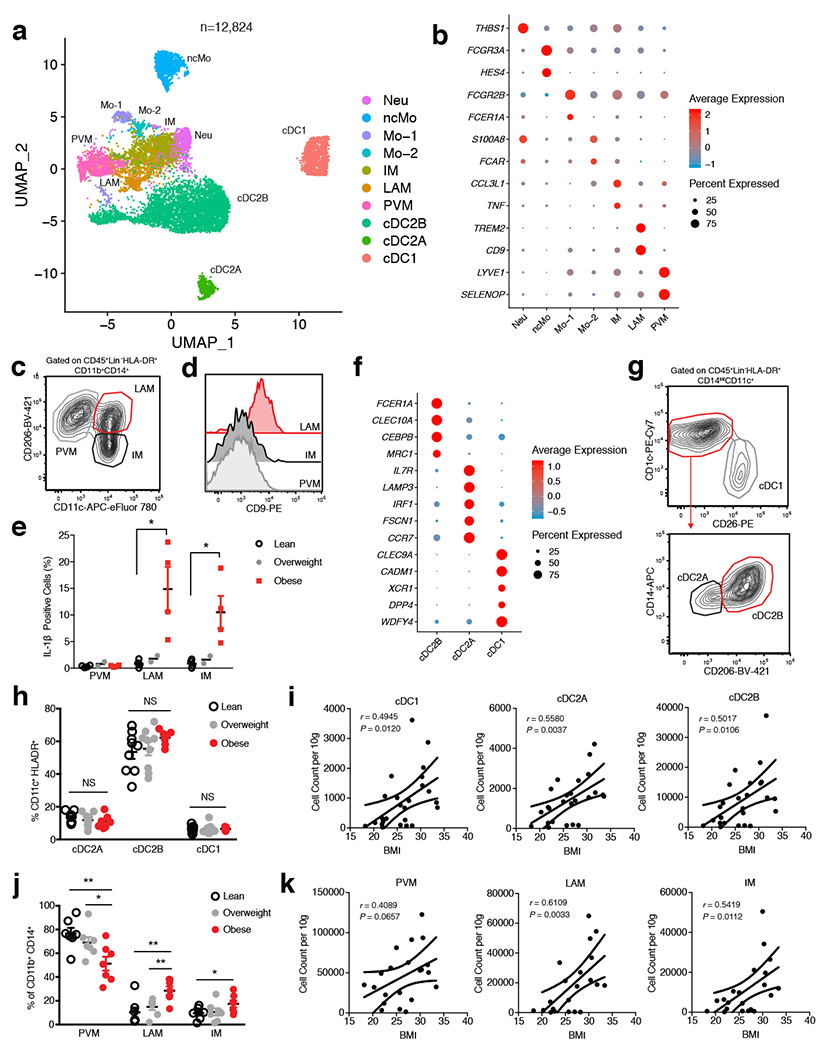
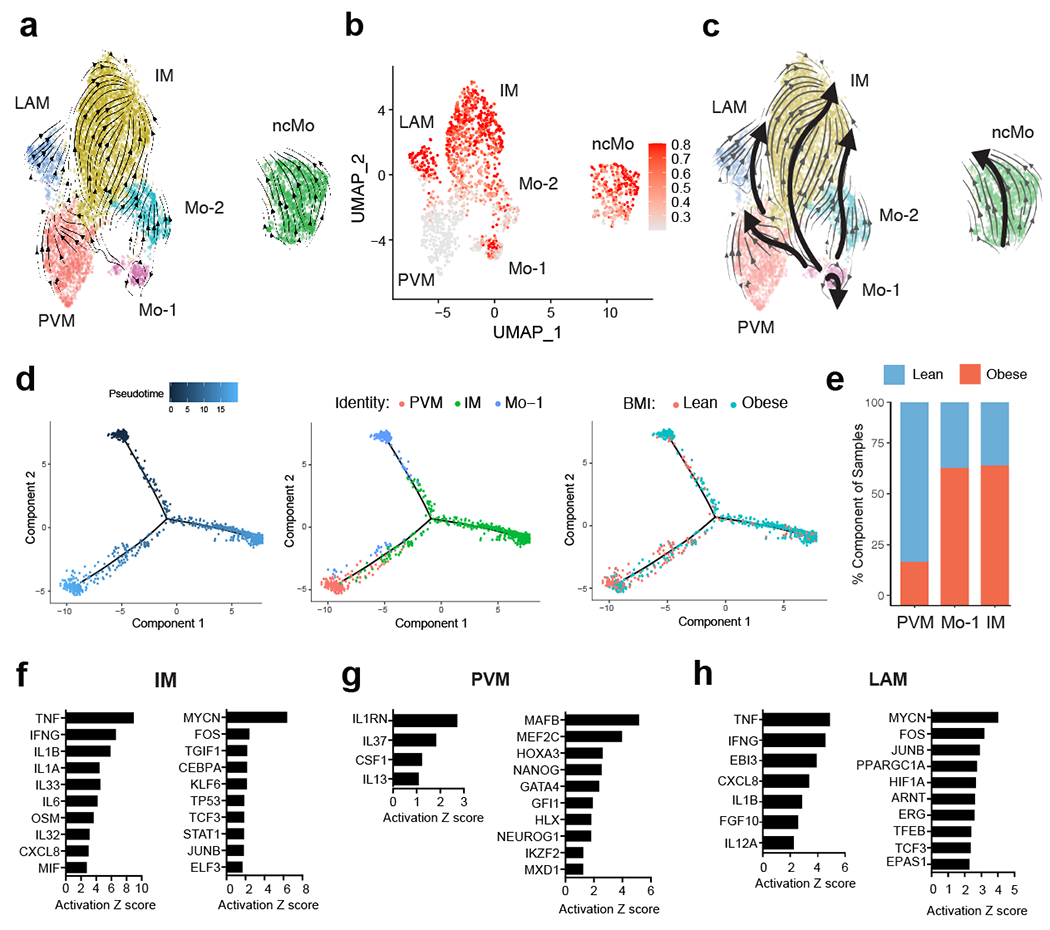
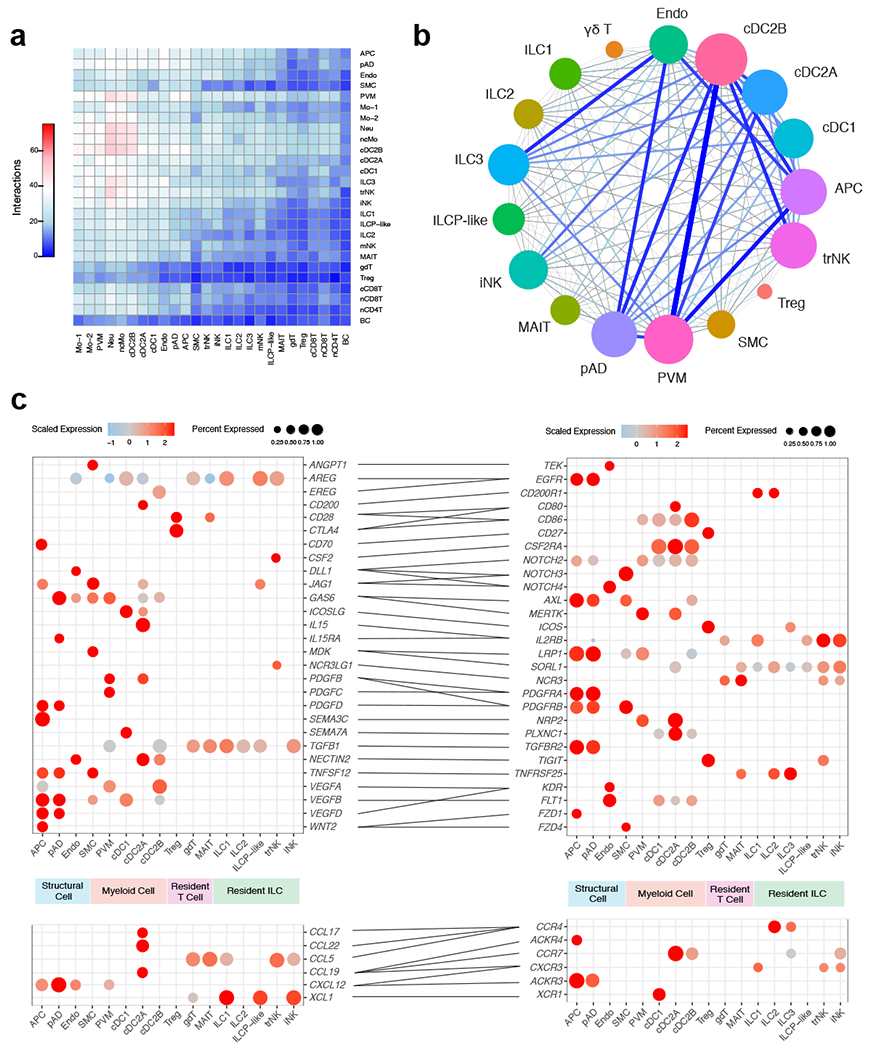
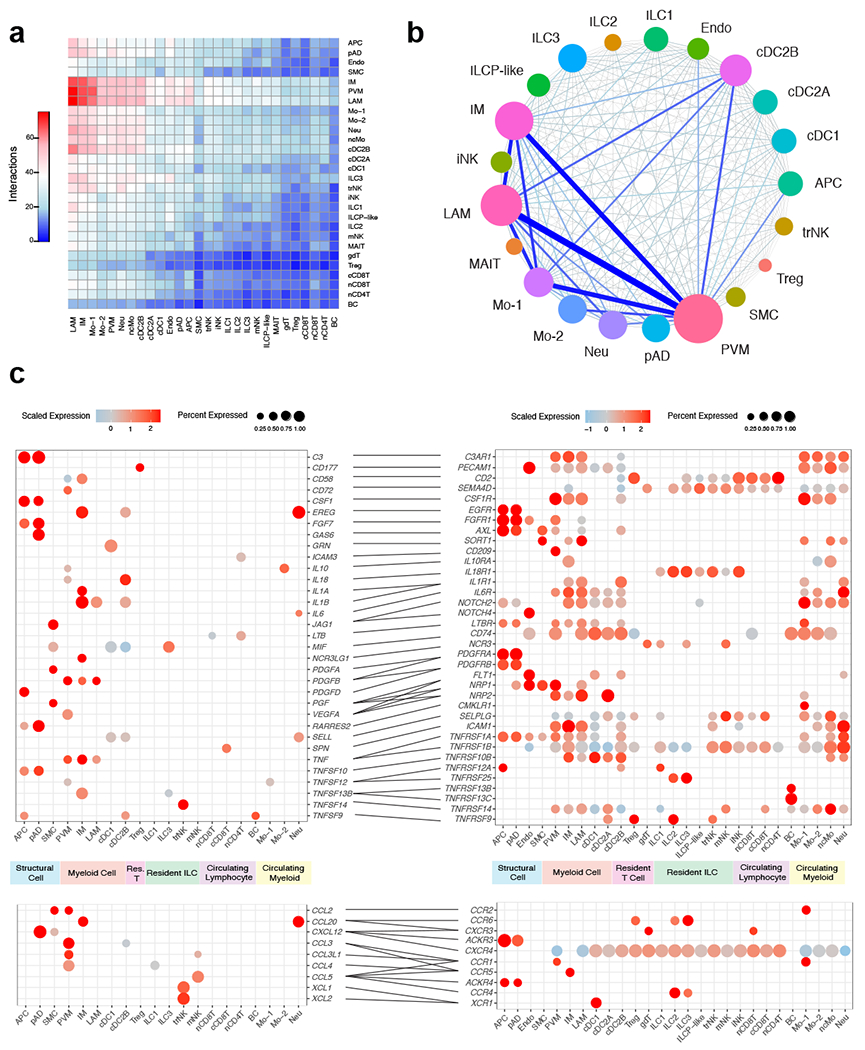
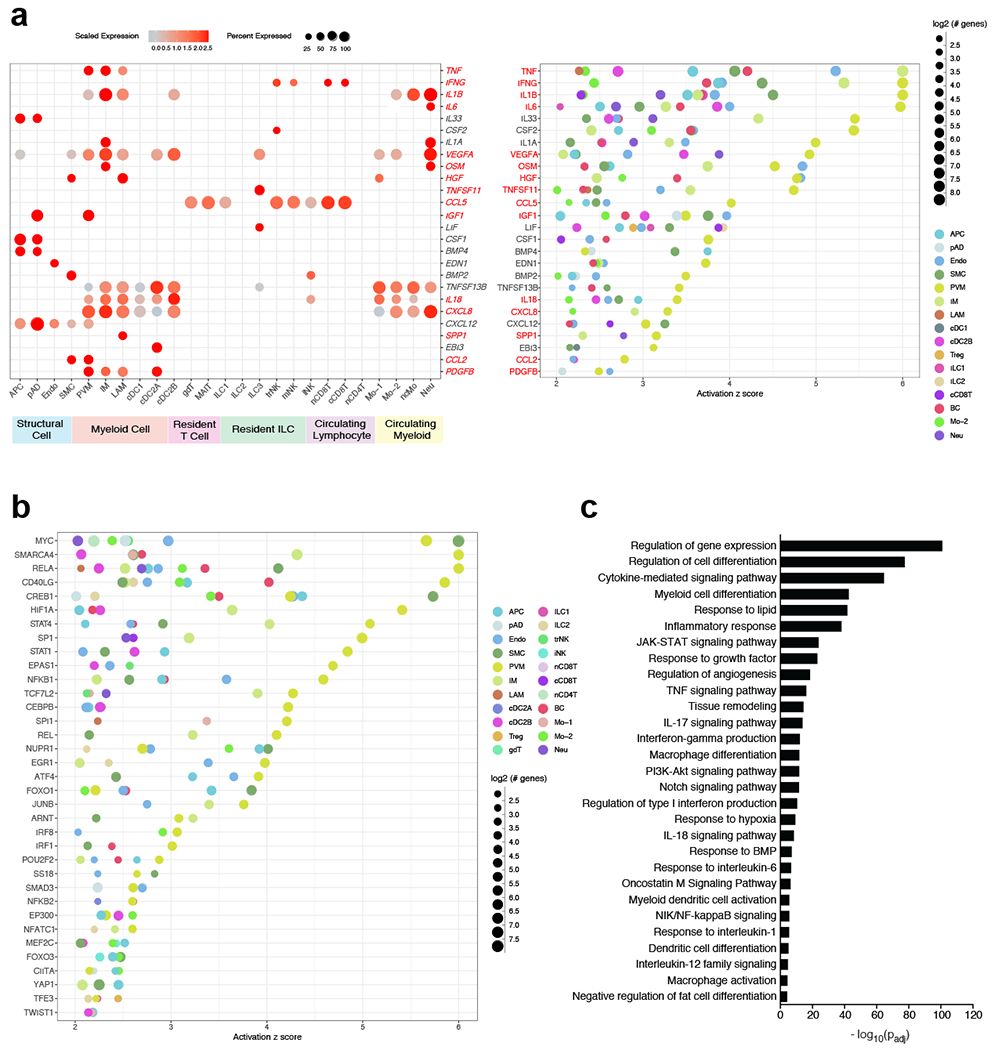
White adipose tissue (WAT) is an essential regulator of energy storage and systemic metabolic homeostasis. Regulatory networks consisting of immune and structural cells are necessary to maintain WAT metabolism, which can become impaired during obesity in mammals. Using single-cell transcriptomics and flow cytometry, we unveil a large-scale comprehensive cellular census of the stromal vascular fraction of healthy lean and obese human WAT. We report new subsets and developmental trajectories of adipose-resident innate lymphoid cells, dendritic cells and monocyte-derived macrophage populations that accumulate in obese WAT. Analysis of cell-cell ligand-receptor interactions and obesity-enriched signaling pathways revealed a switch from immunoregulatory mechanisms in lean WAT to inflammatory networks in obese WAT. These results provide a detailed and unbiased cellular landscape of homeostatic and inflammatory circuits in healthy human WAT.


Conflict of interest statement

Competing Interests Statement

The authors do not have any competing interests to declare.

Figures

Extended Data Fig. 1
Extended Data Fig. 1. Lineage-associated gene signatures of CD45+ and CD45 SVF cells from healthy human WAT.
(a) Dot plot showing selected top differentially expressed marker genes for each cluster, supporting assignment of clusters to compartments shown in Figure 1b. Color saturation indicates the strength of expression in positive cells, while dot size reflects the percentage of each cell cluster expressing the gene. (b) Violin plots showing expression levels of additional cluster markers for the indicated structural cell populations. (c) Representative gating strategy for scRNAseq-defined human WAT non-immune cell populations (CD45): Endothelial cell: CD31+, Smooth muscle cell (SMC): CD31CD34CD29, Adipocyte precursor cell (APC): CD31CD34CD29+, Preadipocyte: CD31CD34+CD29intICAM-1+CD26, Interstitial progenitor cell: CD31CD34+CD29intICAM-1+CD26+. (d) Density correlation analysis of the indicated non-immune subsets with patient BMI. Line of best fit and 95% confidence intervals are shown for each plot. Each point represents an individual patient. Linear regression and two-tailed Pearson Correlation analysis with 95% confidence intervals were conducted. p < 0.05 was considered significant.
Extended Data Fig. 2
Extended Data Fig. 2. Single cell analysis reveals heterogeneous adaptive lymphocyte populations in healthy human WAT.
(a) UMAP plot of 36,601 subclustered human adipose effector lymphocytes from Figure 1. Cluster analysis yields 9 distinct clusters comprising of T cell subsets, ILCs and NK cells. (b) Unbiased heatmap of gene expression of the top 6 unique cluster marker genes for each T cell cluster. Cluster identities are shown above the heatmap. Color saturation indicates the strength of expression. (c) Violin plots showing RNA expression of additional cluster markers for the indicated T cell populations. (d) Representative gating strategy for scRNAseq-defined human WAT T cell populations (CD45+Lin(CD34+CD19+CD14+): γδT cell (γδ T): TCRγδ+Vα24-Jα18Vα7.2, NKT cell (NKT): TCRγδVα24-Jα18+Vα7.2, MAIT cell (MAIT): TCRγδVα24-Jα18Vα7.2+TCRαβ+, CD8+ T cell (CD8 T): TCRγδVα24-Jα18Vα7.2TCRαβ+CD8α+CD4, CD4+ T cell (CD4 T): TCRγδVα24-Jα18Vα7.2TCRαβ+CD8αCD4+, Regulatory T cell (Treg): TCRγδVα24-Jα18Vα7.2TCRαβ+CD8αCD4+FoxP3+. (e) Representative histogram of KLRB1 (CD161) expression on human WAT T cell subsets. (f) Representative flow cytometry plot of CD8α and CD4 expression on human WAT γδ T cells. (e,f). Data is representative of 4 individual patient samples. (g) Density correlation analysis of the indicated T cell subsets with patient BMI. Line of best fit and 95% confidence intervals are shown for each plot. Each point represents an individual patient. Linear regression and two-tailed Pearson Correlation analysis with 95% confidence intervals were conducted. p < 0.05 was considered significant.
Extended Data Fig. 3
Extended Data Fig. 3. Single cell analysis identifies unique human WAT-resident ILCs.
(a) Representative sorting strategy for LinCD7+ cell populations based on expression of CD200R1; used in Figure 2. (b) Unsupervised heatmap of the top 5 differentially expressed cluster marker genes for each indicated innate lymphoid cell cluster. Cluster identities are shown above the heatmap. Color saturation indicates the strength of expression. (c) Selected UMAP feature plots showing RNA expression of additional cluster markers, based on the UMAP shown in Figure 2a. (d) UMAP of sorted innate lymphoid cell populations denoted by the source of the sorted sample (CD200R1+ vs CD200R1) and patient source classification as lean (red, green) or obese (blue, purple); based on the UMAP shown in Figure 2a. (e) Bar plots showing the proportion of innate lymphoid cells derived from 7 lean (blue) and 5 obese (red) patients.
Extended Data Fig. 4
Extended Data Fig. 4. Flow cytometry analysis of scRNAseq-identified human WAT ILCs.
(a,b) Representative gating strategies for the scRNAseq-defined human WAT (a) NK cell and (b) ILC populations identified in Figure 2. Human WAT ILC populations are defined as CD45+Lin(CD3+TCRαβ+CD19+CD34+CD14+CD5+TCRγδ+EOMES+)CD7+CD200R1+); ILC1: TBET+, ILC2: TBETCRTH2+NKp44, ILC3: TBETCRTH2NKp44+, ILCP-like: TBETCRTH2NKp44CD62L+/−. (c) Representative histogram of IFN-γ by human WAT NK cell subsets. Unstim refers to CD200R1 cells cultured without PMA and Ionomycin. (d) Representative histograms of T-bet, CRTH2, NKp44, and RORC expression on human WAT ILC subsets. (e) Analysis of RORC MFI values from human WAT ILC subsets. Each point represents an individual patient (n=3). ILCP-like: p=0.0198, ILC1: p=0.0313, ILC2: p=0.0194. (f) Representative flow cytometry plots of CD7+CD200R1+ cells isolated from human PBMC. (g) Density correlation analysis of ILC2 with patient BMI. Each point represents an individual patient. Line of best fit and 95% confidence intervals are shown for the plot. (h,i) Density of indicated ILCs by BMI classification. Each point represents an individual patient; (h) n=8 lean and n=7 obese patients. (i) ILC1: n=10 lean and n=7 obese patients; ILC2, ILC3, ILCP-like: n=5 lean and n=3 obese patients. ILC2: p=0.0293, ILC3: p=0.0094, ILCP-like: p=0.022. (c,d,f) Data is representative of 3 individual patient samples. Samples were compared using two-tailed Student’s t test with Welch’s correction, assuming unequal SD, and data are presented as individual points with the mean ± SEM (*p<0.05, **p<0.01). Linear regression and two-tailed Pearson Correlation analysis with 95% confidence intervals were conducted. p < 0.05 was considered significant.
Extended Data Fig. 5
Extended Data Fig. 5. Analysis of ILC1 and ILC3 fate DEGs suggests a clear developmental bifurcation.
Bifurcation heatmap of enriched genes for ILC1 (left), ILCP-like (middle) and ILC3 (right). Color indicates increased (red) or decreased (blue) expression.
Extended Data Fig. 6
Extended Data Fig. 6. Single cell analysis identifies unique myeloid populations within healthy human WAT.
(a) Representative sorting strategies for CD11b+CD14+ macrophage and HLA-DR+CD11c+ dendritic cell populations indicated in Figure 4. (b) Heatmap shows the top 4 differentially expressed cluster marker genes for each indicated myeloid cell cluster. Cluster identities are shown above the heatmap. Color saturation indicates the strength of expression. (c,d) Violin plots showing RNA expression levels of cluster markers for (c) myeloid (d) and monocyte populations. (e) Classical, Intermediate, and Nonclassical Monocyte gene module score analysis for the indicated monocyte populations based on comparison of signature genes for each cell type from previously defined datasets to DEGs within each cluster. (f) Neutrophil gene module score analysis for the indicated myeloid populations based on comparison of signature genes for each cell type from previously defined datasets to DEGs within each cluster. (g) Bar plots showing the proportion of myeloid cells derived from 7 lean (blue) and 5 obese (red) patients.
Extended Data Fig. 7
Extended Data Fig. 7. Flow cytometry analysis of scRNAseq-identified human WAT macrophage and dendritic cell populations.
(a) Representative gating strategy for scRNAseq-defined human WAT macrophage and DC populations identified in Figure 4. (b) Representative histograms of CD64, CD68, CD88, and CD15 expression on human WAT macrophage cell subsets, CD14+ monocytes and CD15+ neutrophils isolated from human PBMC. (c) Flow cytometry analysis of endogenous TNF-α production by human WAT macrophage subsets from n=4 lean, n=2 overweight, and n=4 obese patients. Each point represents an individual patient. (d) Representative flow cytometry histograms of CLEC10A and FCER1A expression on human WAT DC subsets. (e) Density of the indicated DC populations by BMI classification, n=9 lean and n=7 obese patients. Each point represents an individual patient (f) Representative flow cytometry plots of human WAT macrophage populations from lean (left) and obese (right) patients. (g) Density of the indicated macrophage populations by BMI classification, n=7 lean and n=7 obese patients. Each point represents an individual patient. (b,d) Data is representative of 3 individual patient samples. Samples were compared using two-tailed Student’s t test with Welch’s correction, assuming unequal SD, and data are presented as individual points with the mean ± SEM (*p<0.05, **p<0.01).
Extended Data Fig. 8
Extended Data Fig. 8. Analysis of the DEGs between PVM and IM fates shows a clear bifurcation in gene expression programs.
Bifurcation heatmap of enriched genes for PVM (left), Mo-1 (middle) and IM (right). Color indicates increased (red) or decreased (blue) expression.
Extended Data Fig. 9
Extended Data Fig. 9. Novel human WAT cell types contribute to obesity-associated inflammatory networks.
(a) Dot plots showing expression of ligands (left) and receptors (right) in novel human WAT cells; only ligands and receptors from cell types with detected expression (>25%) are shown. Implicated chemokines can be found in the lower panel. Color saturation indicates the strength of expression in positive cells, while dot size reflects the percentage of each cell cluster expressing the gene. (b-e) GOSt analysis of obese-enriched differentially expressed genes for the indicated novel human WAT cell types. (b) GOSt analysis of trNK. (c) GOSt analysis of ILC3. (d) GOSt analysis of IM. (e) GOSt analysis of cDC2B. Terms were considered statistically significantly enriched if −log10(Padj)<0.05.
Extended Data Fig. 10
Extended Data Fig. 10. Proposed model of cell-cell interactions in healthy lean and obese human WAT.
In lean WAT, IL-15 expression from cDC2A coupled with IL-15RA expression from APCs may support the viability of IL-15RB-expressing ILCs and NK cell populations. CSF1 (M-CSF) expression from APCs and IL-13 from ILC2s likely drives the Mo-1 transition to PVMs, while CSF2 from APCs may support dendritic cell homeostasis. cDC2A-derived CD200 could suppress ILC activation at steady-state. TGFβ1, PDGF, AREG, and GAS6 signaling from dendritic cells and PVM to APCs may promote tissue homeostasis. During obesity, IL-23 from an unknown source could drive the differentiation and accumulation of WAT ILC3s from ILCP-like cells. cDC2B-derived IL-18 and potentially IL-12 might stimulate the production of IFNγ by trNK and ILC1 subsets and contribute to the development of LAM from PVM. Increased CCL2 production from hypoxia-sensing PVM and SMC could recruit circulating Mo-1 into the WAT where MIF, LIF, and IFN-γ signaling from ILCs and NKs, as well as IL-1β, OSM and TNF-α signaling from IM, LAM, and cDC2B could polarize Mo-1 to the IM fate. trNK production of TNFSF14 (LIGHT) may further promote inflammation of cDC2B and IM. Together, these interactions suggest a cell type specific positive feedback loop whereby accumulation and polarization of WAT-resident lymphoid and myeloid cell types potentiate inflammation during human obesity.
Figure 1.
Figure 1.. Single cell sequencing reveals the cellular heterogeneity of the stromal vascular fraction of human WAT.
(a) Schematic of the experimental pipeline. Human adipose tissue was isolated from healthy patients (patient information in Supplementary Table 1), dissociated into single cell suspensions, sorted into CD45+ and CD45− cells, and analyzed using 10x Genomics Chromium droplet single cell RNA sequencing. Cells were clustered via differential gene expression and ligand-receptor analysis was performed to assess interaction among cell types. (b,c) UMAP plot of 82,577 human adipose cells isolated from the SVF of 3 lean and 3 obese patients. (b) Annotations are derived from cluster-specific analysis (Extended Data Fig. 1) (c) UMAP indicating the patient sample classification as lean (red) or obese (blue). (d,e) Boxplots showing the proportion of non-immune (d) and immune (e) cells derived from n=3 lean (red) and n=3 obese (blue) patients for each cell type. Centre, median; box limits, upper and lower quartiles; whiskers, 1.5× interquartile range (IQR). (f,g) Density correlation analysis of accumulating non-immune (f) and T cell (g) subsets with patient BMI. Line of best fit and 95% confidence intervals are shown for each plot. Each point represents an individual patient. Linear regression and two-tailed Pearson Correlation analysis with 95% confidence intervals were conducted. p < 0.05 was considered significant.
Figure 2.
Figure 2.. Single cell analysis unveils unique human WAT-resident ILC subsets.
(a) UMAP plot of 14,849 human WAT CD45+LinCD7+CD200R1+ ILCs or CD45+LinCD7+CD200R1 NK cells isolated from the SVF of an independent cohort of 7 lean and 5 obese patients. Cluster analysis yields 7 distinct clusters comprising of ILCs and NK cells. (b) Dot plot showing selected top differentially expressed genes for the populations depicted. Color saturation indicates the strength of expression in positive cells, while dot size reflects the percentage of each cell cluster expressing the gene. (c) Violin plots showing RNA expression levels of selected cluster markers for indicated cell clusters. (d) Representative gating strategy for scRNAseq-defined human WAT NK cell populations (CD45+Lin(CD3+TCRαβ+CD19+CD34+CD14+CD5+TCRγδ+)CD7+TBET+CD200R1): mature NK (mNK): EOMES+PERFORIN+, tissue resident NK (trNK): EOMEShiPERFORINint, immature NK (iNK): EOMESloPERFORINint. (e) Representative histograms of CD16, Perforin, Eomes, CD62L, and T-bet expression on human WAT NK, ILC1 and CD56dim and CD56bright NK PBMC populations. (f) Representative histograms of CD62L, IL1R1, CCR6, IL-2, IFN-γ, IL-13, and IL-17 expression on human WAT ILC populations. Unstim refers to CD45+LinCD7+CD200R1+ cells cultured without PMA and Ionomycin. (g) Relative frequencies of innate lymphoid cell populations as a percentage of LinCD7+ cells (above; n=8 lean, n=8 overweight, and n=7 obese patients) or LinCD7+CD200R1+ cells (below; n=5 lean, n=4 overweight, and n=3 obese patients) isolated from the human WAT SVF. mNK: p=0.0065, iNK: p=0.0467, trNK: p=0.0138, ILC2 lean vs. obese: p=0.0032, ILC2 overweight vs. obese: p=0.0113, ILCP-like: p=0.0255, ILC3: p=0.0341. (h) Density correlation analysis of the depicted ILC types with patient BMI. Line of best fit and 95% confidence intervals are shown for each plot. (d-f) Data is representative of 3 individual patient samples. Each point represents an individual patient. Samples were compared using two-tailed Student’s t test with Welch’s correction, assuming unequal SD, and data are presented as individual points with the mean ± SEM (*p<0.05, **p<0.01). Linear regression and two-tailed Pearson Correlation analysis with 95% confidence intervals were conducted. p < 0.05 was considered significant.
Figure 3.
Figure 3.. RNA velocity and CytoTRACE analysis identifies a shared ILC precursor to mature adipose ILC1 and ILC3.
(a) RNA Velocity analysis of WAT ILC clusters with velocity field projected onto the UMAP plot of human adipose ILCs subclustered from Figure 2. Arrows show the local average velocity evaluated on a regular grid and indicate the extrapolated future states of cells. (b) CytoTRACE scatter plot of WAT ILC clusters. Color indicates the level of differentiation from low (grey) to high (red). (c) UMAP plot of WAT ILC clusters with velocity arrows and corresponding principal curve shown in bold. Principal curve indicates the manually averaged differentiation directionality projected by RNA Velocity and CytoTRACE analysis. (d) Monocle analysis of the ILCP-like, ILC1, and ILC3 populations indicating pseudotime directionality (left) and cell type (right); ILC1 (red), ILCP-like (green), ILC3 (blue). (e) Bar plots showing the proportion of the indicated ILC clusters derived from pooled 7 lean or 5 obese patients. (f,g) IPA Analysis of putative upstream regulators of the ILCP-like to ILC3 transition (f) or the ILCP-like to ILC1 transition (g).
Figure 4.
Figure 4.. Single cell analysis identifies unique cell lineages within human WAT myeloid populations.
(a) UMAP plot of 12,824 pooled human adipose myeloid cells isolated from the SVF of 7 lean and 5 obese patients. Cluster analysis yields 10 distinct clusters comprising of DCs, macrophages, monocytes and neutrophils. (b) Dot plot showing selected top differentially expressed genes for the neutrophil, monocyte, and macrophage populations depicted. (c) Representative gating strategy for scRNAseq-defined human WAT macrophage populations (CD45+Lin(CD3+TCRαβ+CD19+CD34+CD5+CD7+CD1c+)HLA-DR+CD11b+CD14+): Perivascular macrophage (PVM): CD206+CD11c, Lipid-associated macrophage (LAM): CD206+CD11c+, Inflammatory macrophage (IM): CD206CD11c+. (d) Representative flow cytometry histogram of CD9 expression on human WAT macrophage populations. (e) Flow cytometry analysis of endogenous IL-1β production by human WAT macrophage subsets from an additional n=4 lean, n=2 overweight, and n=4 obese patients. LAM: p=0.0158, IM: p=0.0204. Each point represents an individual patient. (f) Dot plot showing selected top differentially expressed genes for indicated DC subsets. (g) Representative gating strategy for scRNAseq-defined human WAT dendritic cell populations (CD45+Lin(CD3+TCRαβ+CD19+CD34+CD7+CD16+CD88+CD89+)HLA-DR+CD14intCD11c+): conventional type 1 dendritic cell (cDC1): CD1cCD26+, conventional type 2 dendritic cell A (cDC2A): CD1c+CD26CD206CD14int, conventional type 2 dendritic cell B (cDC2B): CD1c+CD26CD206+CD14hi. (h) Relative frequencies of DC subsets as a percentage of LinCD11c+HLA-DR+ cells isolated from the SVF of WAT from n=9 lean, n=9 overweight, and n=7 obese patients. (i) Density correlation analysis of the depicted DC subsets with patient BMI. Line of best fit and 95% confidence intervals are shown for each plot. (j) Relative frequencies of macrophage populations as a percentage of LinCD11b+CD14+ cells isolated from the SVF of WAT from n= 7 lean, n=7 overweight, and n=7 obese patients. PVM lean vs. obese: p=0.0054, PVM overwieight vs. obese: p=0.0362, LAM lean vs. obese: p=0.0052, LAM overweight vs. obese: p=0.0088, IM: p=0.0404. (k) Density correlation analysis of the indicated macrophages with patient BMI. Line of best fit and 95% confidence intervals are shown for each plot. Each point represents an individual patient. (c,d,g) Data is representative of 3 individual patient samples. Samples were compared using two-tailed Student’s t test with Welch’s correction, assuming unequal SD, and data are presented as individual points with the mean ± SEM (*p<0.05, **p<0.01). Linear regression and two-tailed Pearson Correlation analysis with 95% confidence intervals were conducted. p < 0.05 was considered significant.
Figure 5.
Figure 5.. RNA velocity analysis uncovers a distinct monocyte state upstream of adipose inflammatory macrophages in obese individuals.
(a) RNA Velocity analysis of WAT monocyte and macrophage clusters with velocity field projected onto the UMAP plot of human adipose myeloid cells subclustered from Figure 4. Arrows show the local average velocity evaluated on a regular grid and indicate the extrapolated future states of cells. (b) CytoTRACE scatter plot of WAT monocyte and macrophage clusters. Color indicates the level of differentiation from low (grey) to high (red). (c) UMAP plot of WAT monocyte and macrophage clusters with velocity arrows and corresponding principal curve shown in bold. Principal curve indicates the manually averaged differentiation directionality projected by RNA Velocity and CytoTRACE analysis. (d) Monocle analysis of the Mo-1, PVM, and IM populations indicating pseudotime directionality (left), cell type (middle); PVM (red), Mo-1 (blue), IM (red), and patient source classification as lean or obese (right); lean (red), obese (blue). (e) Bar plots showing the proportion of the indicated myeloid populations derived from 7 lean and 5 obese patients. (f-h) IPA of putative upstream regulators (left) and transcription factors (right) implicated in the Mo-1 to IM transition (f) in the Mo-1 to PVM transition (g), or in the PVM to LAM transition (h).
Figure 6.
Figure 6.. CellphoneDB analysis reveals the lean human WAT interactome.
(a) Interaction heatmap plotting the total number of lean WAT-derived cell receptor (y-axis) and ligand (y-axis) interactions for the specified cell types. Color represents the number of interactions between cell types; higher number of interactions (red), lower number of interactions (blue). (b) Connectome web analysis of lean interacting putative tissue-resident cell types, based on expression of the ligand in at least 25% of the cell population. Vertex (colored cell node) size is proportional to the number of interactions to and from that cell, while the thickness of the connecting lines is proportional to the number of interactions between two nodes. (c) Dot plots showing expression of ligands (left) and receptors (right) in human tissue-resident WAT cells; only ligands and receptors from cell types with detected expression (>25%) are shown. Implicated chemokines can be found in the lower panel. Color saturation indicates the strength of expression in positive cells, while dot size reflects the percentage of each cell cluster expressing the gene.
Figure 7.
Figure 7.. CellphoneDB analysis predicts a dramatic remodeling of the human WAT interactome during obesity.
(a) Interaction heatmap plotting the total number of lean WAT-derived cell receptor (y-axis) and ligand (y-axis) interactions for the specified cell types. Color represents the number of interactions between cell types; higher number of interactions (red), lower number of interactions (blue). (b) Connectome web analysis of obese highly interacting cell types, based on expression of the ligand in at least 25% of the cell population. Vertex (colored cell node) size is proportional to the number of interactions to and from that cell, while the thickness of the connecting lines is proportional to the number of interactions between two nodes. (c) Dot plots showing expression of ligands (left) and receptors (right) in human WAT cells; only ligands and receptors from cell types with detected expression (>25%) are shown. Implicated chemokines can be found in the lower panel. Color saturation indicates the strength of expression in positive cells, while dot size reflects the percentage of each cell cluster expressing the gene.
Figure 8.
Figure 8.. Analysis of putative upstream regulators uncovers a distinct obese human WAT-enriched signalome.
(a,b) IPA of obese immune and non-immune populations showing common putative upstream regulators. Terms were considered common if implicated in three or more cell types from a lineage. Terms were considered statistically significant if the activation z-score > 2. (a) Dot plots showing expression of common secreted upstream regulators from obese cells (left) and the putative regulated cell types (right) as suggested by IPA; left: color saturation indicates the strength of expression in positive cells, while dot size reflects the percentage of each cell cluster expressing the gene; right: color indicates the implicated cell type, while dot size reflects the number of genes downstream of the suggested secreted upstream regulator. Only ligands from cell types with detected expression (>25%) are shown. Red-highlighted upstream regulators denote those that have been associated with human insulin resistance (see Supplementary Data Table 17). (b) Dot plot showing common non-secreted signaling upstream regulators. Color indicates the implicated cell type, while dot size reflects the number of genes downstream of the suggested signaling upstream regulator (c) GOSt analysis of differentially regulated signaling pathways in obesity. Terms were considered statistically significantly enriched if −log10(Padj)<0.05.

References

    1. Christ A, Lauterbach M & Latz E Western Diet and the Immune System: An Inflammatory Connection. Immunity 51, 794–811 (2019). - PubMed
    1. Roden M & Shulman GI The integrative biology of type 2 diabetes. Nature 576, 51–60 (2019). - PubMed
    1. Lee YS, Wollam J & Olefsky JM An Integrated View of Immunometabolism. Cell 172, 22–40 (2018). - PMC - PubMed
    1. Lackey DE & Olefsky JM Regulation of metabolism by the innate immune system. Nat Rev Endocrinol 12, 15–28 (2016). - PubMed
    1. Pollack RM, Donath MY, LeRoith D & Leibowitz G Anti-inflammatory Agents in the Treatment of Diabetes and Its Vascular Complications. Dia Care 39, S244–S252 (2016). - PubMed

Additional Methods References:

    1. Butler A, Hoffman P, Smibert P, Papalexi E & Satija R Integrating single-cell transcriptomic data across different conditions, technologies, and species. Nat Biotechnol 36, 411–420 (2018). - PMC - PubMed
    1. Koay H-F et al. A divergent transcriptional landscape underpins the development and functional branching of MAIT cells. Sci. Immunol 4, eaay6039 (2019). - PMC - PubMed
    1. Szabo PA et al. Single-cell transcriptomics of human T cells reveals tissue and activation signatures in health and disease. Nat Commun 10, 4706 (2019). - PMC - PubMed
    1. Zheng GXY et al. Massively parallel digital transcriptional profiling of single cells. Nat Commun 8, 14049 (2017). - PMC - PubMed
    1. Wong KL et al. Gene expression profiling reveals the defining features of the classical, intermediate, and nonclassical human monocyte subsets. Blood 118, e16–e31 (2011). - PubMed

Publication types

MeSH terms