. 2021 Jun 1;6(6):468-473.
doi: 10.1039/d0nh00685h.

Real-time monitoring of crystallization from solution by using an interdigitated array electrode sensor

Affiliations

Real-time monitoring of crystallization from solution by using an interdigitated array electrode sensor

Jincheng Tong et al. Nanoscale Horiz. .

Abstract

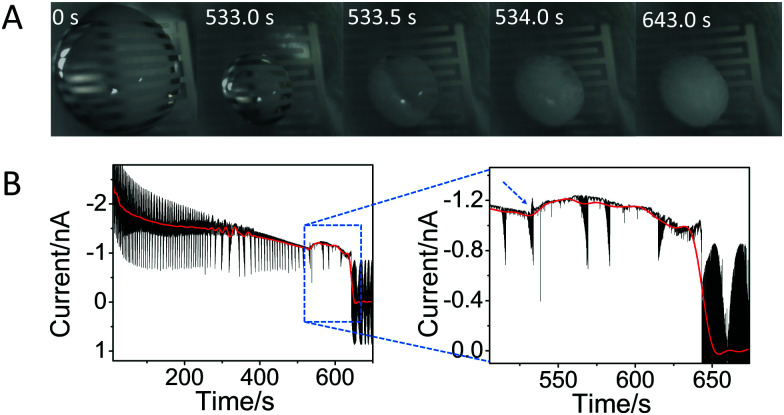
Monitoring crystallization events in real-time is challenging but crucial for understanding the molecular dynamics associated with nucleation and crystal growth, some of nature's most ubiquitous phenomena. Recent observations have suggested that the traditional nucleation model, which describes the nucleus having already the final crystal structure, may not be valid. It appears that the molecular assembly can range during nucleation from crystalline to partially ordered to totally amorphous phases, and can change its structure during the crystallization process. Therefore, it is of critical importance to develop methods that are able to provide real-time monitoring of the molecular interactions with high temporal resolution. Here, we demonstrate that a simple and scalable approach based on interdigitated electrode array sensors (IESs) is able to provide insights on the dynamics of the crystallization process with a temporal resolution of 15 ms.


Conflict of interest statement

The authors declare no competing financial interest.

Figures

Fig. 1
Fig. 1. Interdigitated electrode array and process for in situ monitoring of the crystallization. (A) Picture taken by optical microscope of the fabricated interdigitated electrodes array. The orange rectangle is showing an individual device. (B) Schematic of the process of real-time monitoring of crystallization using an evaporative droplet.
Fig. 2
Fig. 2. In situ monitoring of glycine crystallization by IES and optical microscopy. (A) Images of the droplet over the time covering the whole process of crystallization of 1 M glycine from solution taken from ESI Movie S1. To give an idea of the size of the droplet, one can note that the separation and length of the electrodes are 60 μm and 1600 μm, respectively. (B) The corresponding temporal evolution of the current at a fixed voltage of 0.7 V; the red line, obtained by applying fast Fourier transform (FFT) filtering of the curve, is a guide for the eyes. The large noise is due to the measurements being performed without any Faraday cage to allow optical inspections of the crystals. Inset: Enlarged view showing the change in current at ∼533 s and afterwards. The blue and dashed arrow shows the sudden change of the current, associated to the induction time.
Fig. 3
Fig. 3. Glycine crystallization dynamics monitored and revealed by IES. (A) The recorded current curves over time measured during the evaporation of glycine droplets solutions with concentrations of 0.4 M, 0.7 M, 1 M, 1.5 M, 2 M and 2.5 M. The blue dashed arrows indicate the sudden change in current. (B) Enlarged range (highlighted red square in panel A) of the curve corresponding to the crystallization for a 0.4 M glycine droplet. The blue dashed arrow is showing the beginning of the current fluctuation. (C) The induction time (tind) for different concentrations of glycine obtained from the recorded curves in Fig. S6 and summarized in Table S1 (ESI†). The red dashed arrow indicates the glycine concentration at the critical supersaturation. The blue shadow is a guide for the eyes. (D) The corresponding supersaturation ratio (S) for different concentration of glycine solutions. The blue shadow is a guide for the eyes.
Fig. 4
Fig. 4. In situ monitoring of the crystallization of l-alanine and d-mannitol by IES. (A) The recorded current over time during the evaporation of a 0.4 M l-alanine solution. The blue dashed arrow indicates the sudden change in current. (B) The induction time (tind) for different concentrations of l-alanine solutions obtained from the curves in Fig. S7 and summarized in Table S2 (ESI†). The dashed arrow indicates the concentration at the critical supersaturation. (C) The corresponding supersaturation ratio (S) for different concentrations of l-alanine solutions. (D) The recorded current curve over time measured during the evaporation of a 0.6 M d-Mannitol solution. (E) The tind for different concentrations of d-mannitol solutions obtained from the recorded curves in Fig. S8 and summarized in Table S3 (ESI†). (F) The corresponding supersaturation ratio (S) for different concentration of d-mannitol solutions. The blue shadows in panels B, C, E and F are guides for the eyes.

Similar articles

Cited by

References

    1. Machguth H. MacFerrin M. van As D. Box J. E. Charalampidis C. Colgan W. Fausto R. S. Meijer H. A. J. Mosley-Thompson E. van de Wal R. S. W. Nat. Clim. Change. 2016;6:390–393.
    1. Weiner S. Addadi L. Annu. Rev. Mater. Res. 2011;41:21–40.
    1. Halter W. E. Williams-Jones A. E. Kontak D. J. Chem. Geol. 1998;150:1–17.
    1. Sosso G. C. Chen J. Cox S. J. Fitzner M. Pedevilla P. Zen A. Michaelides A. Chem. Rev. 2016;116:7078–7116. - PMC - PubMed
    1. Erdemir D. Lee A. Y. Myerson A. S. Acc. Chem. Res. 2009;42:621–629. - PubMed

Publication types

LinkOut - more resources