. 2022 Feb 24;139(8):1184-1197.
doi: 10.1182/blood.2020007932.

MondoA drives malignancy in B-ALL through enhanced adaptation to metabolic stress

Affiliations

MondoA drives malignancy in B-ALL through enhanced adaptation to metabolic stress

Alexandra Sipol et al. Blood. .

Abstract

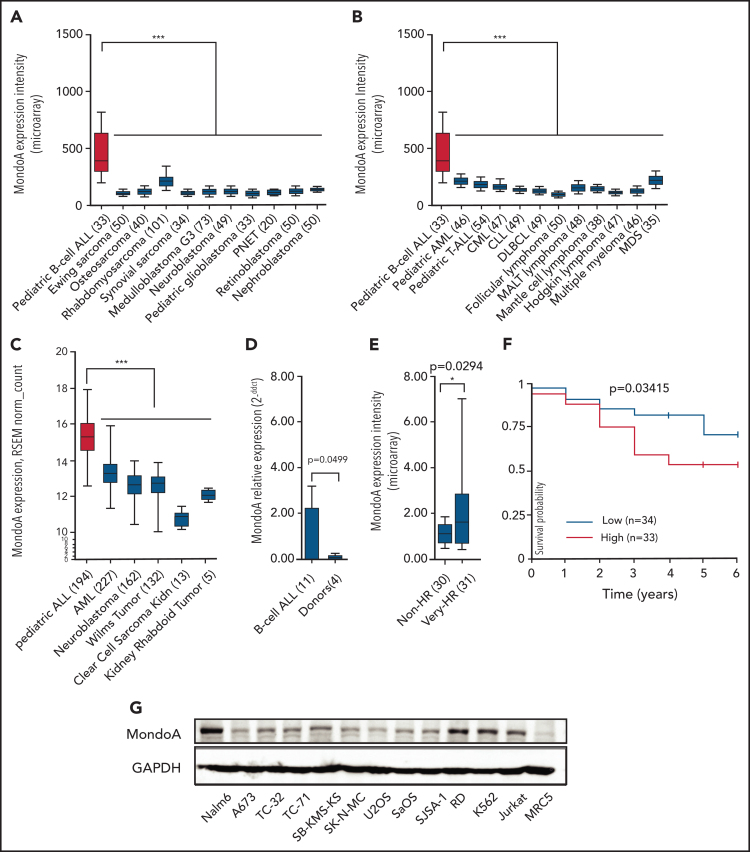
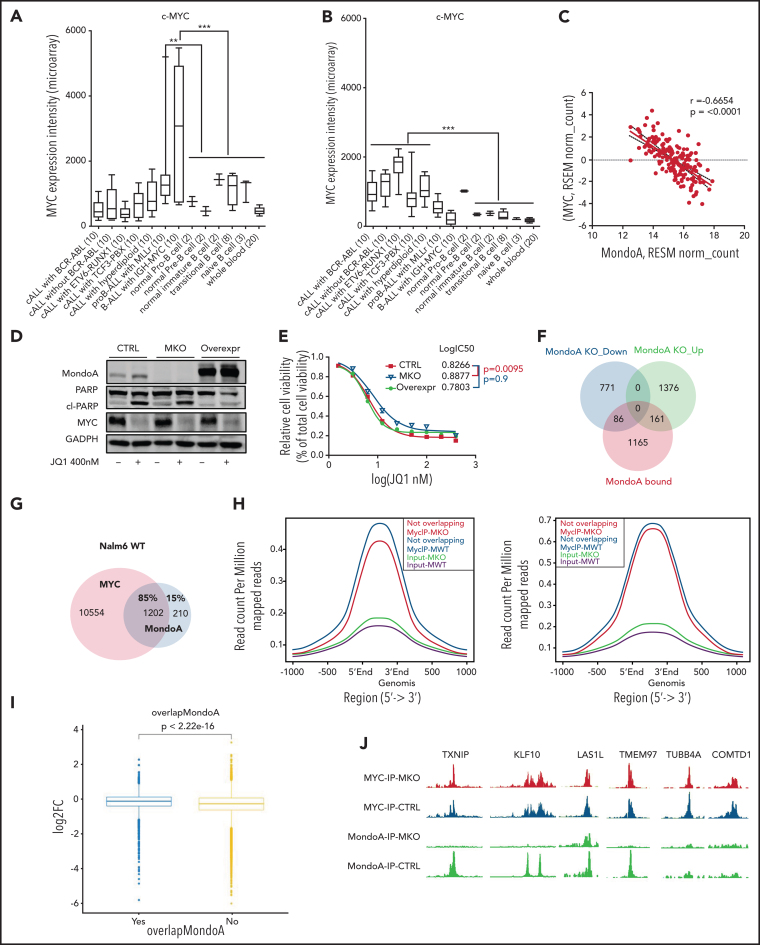
Cancer cells are in most instances characterized by rapid proliferation and uncontrolled cell division. Hence, they must adapt to proliferation-induced metabolic stress through intrinsic or acquired antimetabolic stress responses to maintain homeostasis and survival. One mechanism to achieve this is reprogramming gene expression in a metabolism-dependent manner. MondoA (also known as Myc-associated factor X-like protein X-interacting protein [MLXIP]), a member of the MYC interactome, has been described as an example of such a metabolic sensor. However, the role of MondoA in malignancy is not fully understood and the underlying mechanism in metabolic responses remains elusive. By assessing patient data sets, we found that MondoA overexpression is associated with worse survival in pediatric common acute lymphoblastic leukemia (ALL; B-precursor ALL [B-ALL]). Using clustered regularly interspaced short palindromic repeats (CRISPR)/CRISPR-associated protein 9 (Cas9) and RNA-interference approaches, we observed that MondoA depletion reduces the transformational capacity of B-ALL cells in vitro and dramatically inhibits malignant potential in an in vivo mouse model. Interestingly, reduced expression of MondoA in patient data sets correlated with enrichment in metabolic pathways. The loss of MondoA correlated with increased tricarboxylic acid cycle activity. Mechanistically, MondoA senses metabolic stress in B-ALL cells by restricting oxidative phosphorylation through reduced pyruvate dehydrogenase activity. Glutamine starvation conditions greatly enhance this effect and highlight the inability to mitigate metabolic stress upon loss of MondoA in B-ALL. Our findings give novel insight into the function of MondoA in pediatric B-ALL and support the notion that MondoA inhibition in this entity offers a therapeutic opportunity and should be further explored.


Figures

None
Graphical abstract
Figure 1
Figure 1
MondoA (MLXIP) is highly expressed in primary B-ALL and correlates with relapse risk. (A) MondoA (ID 22877_at) expression in pediatric B-ALL relative to pediatric solid tumors (n = 533; *P < .05; **P < .01; ***P < .001; ****P < .0001; 1-way analysis of variance (ANOVA) with the Bonferroni multiple comparison test). Numbers of analyzed samples are shown in brackets. All data sets were normalized simultaneously using robust multiarray average (RMA) and custom microarray (v15 ENTREZG) CDF files. Data are depicted as box plots. Whiskers indicate the 10th and 90th percentiles. Data presented in linear scale. MondoA Microarray ENTREZG probe set identifier (ID) is 22877_at. (B) MondoA (ID 22877_at) expression in lymphoid and myeloid neoplasms (n = 542; P < .001; 1-way ANOVA with Bonferroni multiple comparison test). (C) MondoA expression in pediatric ALL relative to AML and other pediatric tumors (RNA-Seq data; UCSC Xena; n = 733; P < .001; 1-way ANOVA with Bonferroni multiple comparison test). (D) MondoA relative expression by qRT-PCR in peripheral blood mononuclear cell (PBMC) samples from patients (n = 11) with primary pediatric B-ALL compared with 3 PBMCs from healthy donors (n = 4), normalized to donor PBMC sample. Results of 2 independent experiments in duplicate are presented as means plus or minus standard error of the mean (SEM; P = .0499; Welch Student t test). (E) MondoA overexpression correlates with relapse risk in B-ALL. MondoA expression was 63% higher (P = .0294; Welch Student t test) in the very HR group (n = 31) as compared with the non-HR group (n = 30), defined by prednisone good response (PGR), remission on day 33 of induction therapy, (MRD-MR) minimal residual disease- minimal risk, or (MRD-SR) minimal residual disease- standart risk. All cases are negative for prognostically relevant molecular markers TEL/AML1, BCR/ABL, MLL/AF4 (data from the BFM study group). Bars indicate median; boxes represent middle 50% of data. Whiskers indicate 10th and 90th percentiles. (F) Kaplan-Meier curve indicating significant difference in survival of B-ALL patients with positive MRD on day +28 depending on MondoA expression. All cases are negative for BCR/ABL (n = 67; P = .03415). (G) Western blot showing MondoA and glyceraldehyde-3-phosphate dehydrogenase (GAPDH) as loading control in leukemias and different tumor cell lines. AML, acute myeloid leukemia; CLL, chronic lymphocytic leukemia; CML, chronic myeloid leukemia; DLBCL, diffuse large B-cell lymphoma; MALT lymphoma, mucosa-associated lymphoid tissue lymphoma; MDS, myelodysplastic syndrome; PNET, primitive neuroectodermal tumor; RSEM, RNA-Seq by expectation-maximization; T-ALL, T-cell acute lymphoblastic leukemia. *P < .05; ***P < .001.
Figure 2
Figure 2
MKD reduces proliferation and clonogenicity of B-ALL cells in vitro and tumorigenicity in vivo. (A) Knockdown efficiency of MondoA by doxycycline-inducible shRNA against MondoA compared with control shRNA (shCTRL, Tet-On) by qRT-PCR after treatment with doxycycline for 48 hours. Data are mean and SEM of n = 6 experiments, P < .05 (Reh) and P < .001(Nalm6). (B) Western blot of knockdown efficiency after 48 hours of doxycycline. (C) Contact-independent growth in Nalm6 and 697 cells stably transfected with doxycycline-inducible shRNA either against MondoA or control. Data are mean of n = 2 experiments; P < .01; Mann Whitney test. (D-F) Long-term proliferation measured by BrdU assay. Control and MKD cells pretreated with doxycycline for 48 hours (n = 6 for each time point; P < .001; 2-way ANOVA). (G-H) Xenograft transplantation of Nalm6 and 697 cells stably transfected with doxycycline-inducible shRNA infectants in Rag2−/−yc−/− mice. MKD clones and control Nalm6 and 697 cells were injected into the tail veins of immunocompromised mice. Serial sectioning of liver and spleen tissue, including measurements of liver and spleen weights as well as the relative amount of human CD10+ leukemic blasts in blood, BM, and spleen were then assessed. The reduced number of leukemic cells was also confirmed by hematoxylin-and-eosin (H&E) staining of formalin-fixed paraffin-embedded spleen and liver tissue. H&E staining of formalin-fixed paraffin-embedded liver and spleen (scale bar, 1.0 mm). Images captured from H&E staining of the 4-µm sections of paraffin blocks by Axioplan2 microscopy (Carl Zeiss) and AxioVs40 V.4.8.2.0 software. (I) Weight of spleen in grams. Cell lines either expressing shRNA against MondoA or control, as indicated (n = 5 in each group; P < .05). (J) Weight of liver in grams. Cell lines either expressing shRNA against MondoA or control, as indicated (n = 5 in each group, P < .01, results are presented as mean plus or minus SEM; Mann-Whitney test). MKD was associated with a significant reduction in average size and weights of spleen and liver (P < .05 and P < .01). CD10+ leukemic blasts in BM (K), spleens (L), and blood (M) in cell lines either expressing shRNA against MondoA or control, as indicated (P < .001 [Nalm6] and P < .01 [697]; results are presented as mean plus or minus SEM; Mann Whitney test). ddCt, ΔΔ cycle threshold; ns, not significant. *P < .05; **P < .01; ***P < .001.
Figure 3
Figure 3
MKO mediated by CRISPR/Cas9 reduces proliferation and clonogenicity of B-ALL cells in vitro and tumorigenicity in vivo. (A) Representative western blot with anti-MondoA antibody of Nalm6 MKO clone 1 and clone 2 lysates; Cas9-only transfected Nalm6 B-ALL cell line as control; GAPDH as loading control. (B) Long-term proliferation measured with BrdU assay (n = 6 for each time point, P < .01 at 48 hours and P < .001 at 72 hours, 2-way ANOVA). (C) Long-term proliferation measured by direct cell counting. Cas9-only transfected Nalm6 cell line and MKO clones 1 and 2, were grown under normoxia (20% O2) (n = 6 for each time point, P < .001 at 72 hours and 96 hours, 2-way ANOVA). (D) Contact-independent growth of Nalm6 cells with CRISPR/Cas9-mediated MKO. Quantitative evaluation in methylcellulose-based colony formation assay (n = 4, P < .001, results are presented as mean plus or minus SD; 1-way ANOVA). (E) Survival curves of mice transplanted with Nalm6 MKO and Cas9-only control cells (n = 8 for MKO group, n = 9 for CTRL, P < .001). (F-G) Xenograft transplantation of Nalm6 cells with either MKO (n = 8) or control (n = 9) in Rag2−/−yc−/− mice. Weight of liver and spleens in grams (P = .0026 [liver] and P = .0008 [spleen], results are presented as mean plus or minus SD; unpaired Student t test). **P < .01; ***P < .001.
Figure 4
Figure 4
MondoA suppresses MYC targets including fatty acid metabolism, Oxphos, and ROS-pathway genes in B-ALL. (A) GSEA data summary represented as network generated using Cytoscape (version 3.7.1). Nodes depicted in the networks represent Hallmarks from GSEA with a false discovery rate (FDR) q-val < 0.05. Red color indicates negative normalized enrichment score (NES; overexpressed in MKD [REH, Nalm6, 697]) compared with control cell lines (REH, Nalm6, 697). Size of nodes corresponds to the number of genes in the pathway that belong to the core enrichment in gene set. Saturation intensity represents absolute NES. Edges connecting nodes represent number of genes that are shared between the 2 gene sets. (B) GSEA summary represented as network of Nalm6 cell lines either MKO or control Nalm6. Data representation as described in panel A. (C) Enrichment plots of significantly altered gene sets as yielded by the GSEA of microarray data of Nalm6 cell line with and without MKO. GSEA summary for MKO as well as GSEA summary for 3 cell lines (REH, Nalm6, 697) with knockdown in supplemental Figure 3C-D. Gene sets stimulated by MondoA according to MKD and MKO experiments are shown in supplemental Figure 3A-B. Heat maps showing representative genes comprising MYC-target, Oxphos, fatty acid metabolism, and glycolysis gene sets are shown in supplemental Figure 3E.
Figure 5
Figure 5
MondoA and MYC gene expression inversely correlates, MondoA enhances pharmacological MYC inhibition, and loss of MondoA leads to significant redistribution of MYC toward DNA-binding sites shared with MondoA. (A) MYC (202431_s_at) expression in different subtypes of B-ALL defined according to chromosomal aberration, normal B cells, and whole blood. (B) MondoA (MLXIP, 202519_at) expression in different subtypes of B-ALL defined according to chromosomal aberration. All data sets were normalized simultaneously using RMA and custom microarray (v15 ENTREZG) CDF files. (C) Dot plot indicates significant inverse correlation between MYC and MondoA (MLXIP) gene expression. RNA-Seq data from TARGET Pan-Cancer (Xena). (D) WB showing MondoA, poly (ADP-ribose) polymerase (PARP), cleaved-PARP (cl-PARP), and MYC under pharmacological inhibition of MYC by JQ1 (400 nM, 16 hours), GAPDH as loading control. (E) Line graph showing relative cell viability after 48 hours of JQ1 treatment at various concentrations. The y-axis represents the percentage of viable cells (Ctrl, MKO, and MOE cells) related to total number of cells as measured by  Celigo S Imaging Cytometer (Nexcelom Bioscience). Live cells were measured by costaining cells with Hoechst 33342 to identify nuclei and fluorescently labeled CalceinAM (C3099; Thermo Fisher Scientific) to identify live cells. (F) Overlap of MondoA-bound genes with genes that are differentially expressed in MKO (log FC, ≥0.4 and ≤ −0.4). The diagram created with online tool Venny 2.1. Detailed ChIP-Seq data in supplemental Table 1. MondoA binding peaks and joint expression pathway analyses (G) Overlap of MondoA-bound genes with genes that are MYC target genes. (H) Average coverage profile of MYC-binding sites on DNA not overlapping (left) and overlapping with MondoA (right) binding sites. The drop in binding affinity in Myc-MKO compared with Myc-MondoA wildtype (MWT) is noticeably larger in MYC-binding sites, which are distant from MondoA-binding sites. (I) Box plot shows statistically significant increase in log2 Fc of Myc-MKO over Myc-MWT for Myc-binding sites overlapping or in close vicinity to MondoA-binding sites. (J) ChIP-Seq peak coverage was visualized with Integrated Genome Browser (IGB). Gene description is given in “Results.” cALL, common ALL. **P < .01; ***P < .001.
Figure 6
Figure 6
MondoA provides leukemia stress resistance by limiting Oxphos and fatty acid synthesis via decreased PDH activity. (A) Long-term proliferation measured by direct cell counting. Control Cas9-only Nalm6 B-ALL cell line, MondoA overexpression, and MKO, grown under normoxia (20% O2) (n = 6 for each time point, P < .001 at 96 hours and 120 hours). (B) Mitochondrial respiration determined by cellular OCR in control, MKO clones, and Nalm6 cells with MondoA overexpression using a Seahorse extracellular flux analyzer (Agilent). (C) Glycolysis determined by ECAR in control, MKO clones, and Nalm6 cells with MondoA overexpression using a Seahorse extracellular flux analyzer (Agilent). (D) Basal respiration as measured OCR before oligomycin injection (P < .05 and P < .001, 2-way ANOVA with Bonferroni posttest). (E) ATP production is measured as the difference between basal respiration and OCR levels after oligomycin injection. (F) Maximal respiration as measured by OCR levels after FCCP injection (P < .05 and P < .01, 2-way ANOVA with Bonferroni posttest). (G) Glycolysis as measured as the difference between basal ECAR and ECAR levels after glucose injection. (H) Gas chromatography–mass spectrometry quantification of glucose uptake from, and lactate secretion into, culture medium of the indicated cell lines (P ≤ .0001, 2-way ANOVA with the Tukey multiple comparisons test). (I) PDH activity assessed by NADH production. PDH activity in control, MKO, and MOE Nalm6 cells assessed by the colorimetric PDH activity assay kit (n = 3 for each time point, P < .001, 2-way ANOVA with the Bonferroni posttest). (J) Western blot showing MondoA, total PDK1, pPDH (Ser293), total PDH, TXNIP, α-tubulin, and GAPDH as loading controls in Cas9-only control Nalm6 cells, MKO, and MOE cells. (K) PDK1 mRNA in MKO clones compared with CTRL and MOE clones measured by qRT-PCR (P < .001, 2-way ANOVA with the Bonferroni posttest). (L) Heat map showing PDK1 gene coexpression with MondoA in B-ALL. RNA-Seq data of 194 primary ALL patient samples (TARGET) from Xena browser. (M) Pharmacological inhibition of Nalm6 cell proliferation with PDK-inhibitor dichloroacetic acid (DCA; 5 mM) as measured by live cell analysis with image-based cytometry. (N) Pharmacological inhibition of Nalm6 cell proliferation with MondoA-inhibitor SBI477 (10 µM) as measured by live cell analysis with image-based cytometry. (O) Line graph and (P) western blot showing PDK1 protein relative density in Nalm6 control cells and MOE cells after 16 hours of SBI477 treatment at various concentrations (0, 5, 10 µM). DMSO, dimethyl sulfoxide. *P < .05; **P < .01; ***P < .001; ****P < .0001.
Figure 7
Figure 7
MondoA confers adaptation to metabolic stress, induces glutamine anaplerosis, and limits ROS production in B-ALL cells. (A) Cellular ROS measurement of Nalm6 MKO and control cells under either glutamine (GLN) withdrawal or full media. 2′,7′-Dichlorodihydrofluorescein diacetate (H2DCFDA) fluorescence measured by flow cytometry (n = 3 for each experimental condition, P < .001, 1-way ANOVA with the Bonferroni posttest). (B) Cell death rate determined by Annexin V and 7-aminoactinomycin D (7AAD) staining in control and MKO cells in either full medium or medium lacking GLN (n = 3 for each experimental condition, P < .05, P < .01, or P < .001, 1-way ANOVA with the Bonferroni posttest). (C) PDH activity assessed by NADH production. PDH activity in MKO and MOE Nalm6 cells with or without GLN starvation assessed by colorimetric PDH activity assay kit (n = 3 for each time point, P < .001, 2-way ANOVA with the Bonferroni posttest). (D) Western blot showing MondoA, PARP and cl-PARP, and pPDH and total PDH in control Nalm6 cells and cells with MondoA overexpression under 16 hours of GLN starvation and oligomycin (2.5 µM) or SBI477 (10 µM) treatment. GAPDH as loading control. (E) Relative cell viability after 16 hours of GLN starvation and αKG (5 mM). GLN (4 mM) readdition as a control as measured by Celigo S Imaging Cytometer (Nexcelom Bioscience). Live cells were measured by costaining cells with Hoechst 33342 to identify nuclei and fluorescently labeled CalceinAM (C3099; Thermo Fisher Scientific) to identify live cells. (F) Western blot showing MondoA, PARP, and cl-PARP in control Nalm6 cells, MKO and cells with MondoA overexpression under 16 hours of GLN starvation and asparagine (0.1 mM). GAPDH as loading control. (G) Western blot showing MondoA, PARP, and cl-PARP in control Nalm6 cells, MKO, and cells with MondoA overexpression under 16 hours of GLN starvation and glucose (20 mM). GAPDH as loading control. MFI, mean fluorescence intensity. *P < .05; **P < .01; ***P < .001.

References

    1. Hunger SP, Mullighan CG. Acute lymphoblastic leukemia in children. N Engl J Med. 2015;373(16):1541–1552. - PubMed
    1. Pui CH, Yang JJ, Hunger SP, et al. Childhood acute lymphoblastic leukemia: progress through collaboration. J Clin Oncol. 2015;33(27):2938–2948. - PMC - PubMed
    1. Gudmundsdottir T, Winther JF, de Fine Licht S, et al. ALiCCS study group Cardiovascular disease in adult life after childhood cancer in Scandinavia: a population-based cohort study of 32,308 one-year survivors. Int J Cancer. 2015;137(5):1176–1186. - PubMed
    1. Barnea D, Raghunathan N, Friedman DN, Tonorezos ES. Obesity and metabolic disease after childhood cancer. Oncology (Williston Park). 2015;29(11):849–855. - PMC - PubMed
    1. Mulrooney DA, Hyun G, Ness KK, et al. The changing burden of long-term health outcomes in survivors of childhood acute lymphoblastic leukaemia: a retrospective analysis of the St Jude Lifetime Cohort Study. Lancet Haematol. 2019;6(6):e306–e316. - PMC - PubMed

Publication types

MeSH terms

Substances