. 2021 Jul 5;218(7):e20202756.
doi: 10.1084/jem.20202756.

Immunogenicity and efficacy of one and two doses of Ad26.COV2.S COVID vaccine in adult and aged NHP

Affiliations

Immunogenicity and efficacy of one and two doses of Ad26.COV2.S COVID vaccine in adult and aged NHP

Laura Solforosi et al. J Exp Med. .

Abstract

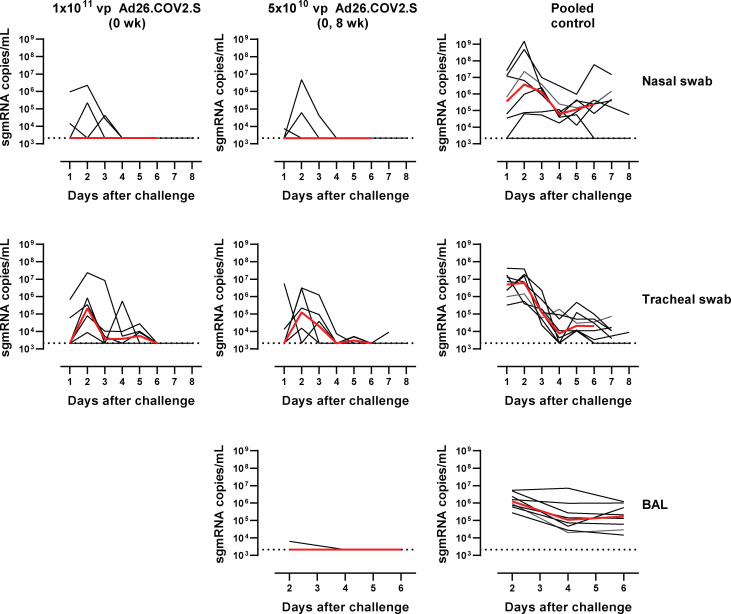
Safe and effective coronavirus disease-19 (COVID-19) vaccines are urgently needed to control the ongoing pandemic. While single-dose vaccine regimens would provide multiple advantages, two doses may improve the magnitude and durability of immunity and protective efficacy. We assessed one- and two-dose regimens of the Ad26.COV2.S vaccine candidate in adult and aged nonhuman primates (NHPs). A two-dose Ad26.COV2.S regimen induced higher peak binding and neutralizing antibody responses compared with a single dose. In one-dose regimens, neutralizing antibody responses were stable for at least 14 wk, providing an early indication of durability. Ad26.COV2.S induced humoral immunity and T helper cell (Th cell) 1-skewed cellular responses in aged NHPs that were comparable to those in adult animals. Aged Ad26.COV2.S-vaccinated animals challenged 3 mo after dose 1 with a SARS-CoV-2 spike G614 variant showed near complete lower and substantial upper respiratory tract protection for both regimens. Neutralization of variants of concern by NHP sera was reduced for B.1.351 lineages while maintained for the B.1.1.7 lineage independent of Ad26.COV2.S vaccine regimen.


Conflict of interest statement

Disclosures: M.R.M. Baert, Y. Choi, J. Custers, D.N. Czapska-Casey, A.H. de Wilde, J. Drijver, J. Huizingh, M. Jongeneelen, K. Kaszas, E. Kourkouta, H. Kuipers, L. Muchene, R. Roozendaal, S.K. Rosendahl Huber, L. Solforosi, J.T.B.M. Tolboom, J.E.M. van der Lubbe, R. van der Vlugt, M. van Heerden, E. van Huizen, J. Vaneman, D. Veldman, J. Vreugdenhil, and R. Zahn are employees of Janssen Pharmaceutical Companies of Johnson & Johnson. D.H. Barouch reports grants from Janssen during the conduct of the study; grants from NIH, HJF/WRAIR, BMGF, DARPA, Gilead, Intima, Alkermes, CureVac, South Africa MRC, amfAR, Ragon Institute, MassCPR, Sanofi, Legend, and Zentalis; and personal fees from SQZ Biotech outside the submitted work. In addition, D.H. Barouch has a patent to COVID-19 vaccines licensed (Janssen). H. Schuitemaker reports "other" from Department of Health and Human Services BARDA (HHS0100201700018C) during the conduct of the study; and personal fees from Johnson & Johnson and Janssen Vaccines & Prevention B.V. outside the submitted work. F. Wegmann reports a patent to company pending and is an employee of Janssen Pharmaceutical Companies of Johnson & Johnson. No other disclosures were reported.

Figures

Figure 1.
Figure 1.
SARS-CoV-2–specific humoral immune responses to one- and two-dose Ad26.COV2.S vaccine regimens in adult rhesus macaques. (A) SARS-CoV-2 spike protein–binding antibody concentrations were measured over time in 480 NHP serum samples (60 NHPs and eight time points) with an ELISA qualified for human samples, using a trimeric, soluble, stabilized spike protein produced in mammalian cells as coating antigen. Antibody levels in the individual animals are depicted with gray points, and paired measurements are connected with gray lines. The geometric mean titer (GMT) of binding antibody responses per group is indicated with the red line. The dotted lines indicate the LLOD and LLOQ. (B) SARS-CoV-2 spike protein neutralizing antibody titers were measured over time in 456 NHP serum samples (60 NHPs and eight time points; 24 data points not available) with a psVNA qualified for human samples, using pseudotyped virus particles made from a modified VSVΔG backbone and bearing the S glycoprotein of SARS-CoV-2 Wuhan-Hu-1. Neutralizing antibody responses were expressed as the reciprocal of the sample dilution, where 50% neutralization is achieved (IC50). Antibody levels in the individual animals are depicted with gray points, and paired measurements are connected with gray lines. The GMT of neutralizing antibody responses per group is indicated with the red line. The dotted lines indicate the LLOD and LLOQ. For binding and psVNA neutralizing antibody data, comparisons between specific vaccine groups were made with the two-sample t test in an ANOVA. Successive time points were compared using the paired t test per vaccine group. (C) Correlation between spike protein–specific binding antibody concentrations and neutralizing antibody titers per animal for all groups at each time point of analysis. The sham control group and week 0 (baseline) data were excluded. The dashed lines indicate the LLOD for each assay. Correlation coefficients between binding antibody concentrations and neutralizing antibody titers were calculated using two-sided Spearman rank correlation.
Figure 2.
Figure 2.
SARS-CoV-2–specific humoral responses of one- and two-dose Ad26.COV2.S vaccine regimens in aged rhesus macaques. (A) SARS-CoV-2 spike protein–binding antibody concentrations were measured over time in 120 NHP serum samples (20 NHPs and six time points) with an ELISA qualified for human samples using a trimeric, soluble, stabilized spike protein produced in mammalian cells as coating antigen. Antibody levels in the individual animals are depicted with gray points, and paired measurements are connected with gray lines. The geometric mean titer (GMT) of binding antibody responses per group is indicated with the red line. The dotted lines indicate the LLOD and LLOQ. (B) SARS-CoV-2 spike protein neutralizing antibody titers were measured over time in 116 NHP serum samples (20 NHPs and six time points; four data points not available) with a psVNA qualified for human samples using pseudotyped virus particles made from a modified VSVΔG backbone and bearing the S glycoprotein of SARS-CoV-2 Wuhan-Hu-1. Neutralizing antibody responses were expressed as the reciprocal of the sample dilution where 50% neutralization is achieved (IC50). Antibody levels in the individual animals are depicted with gray points, and paired measurements are connected with gray lines. The GMT of neutralizing antibody responses per group is indicated with the red line. The dotted lines indicate the LLOD and LLOQ. For binding and psVNA neutralizing antibody data, comparisons between specific vaccine groups were made with the two-sample t test in an ANOVA. Successive time points were compared using the paired t test per vaccine group. (C) Correlation between spike-specific–binding antibody concentrations and neutralizing antibody titers per animal for all groups at each time point of analysis. The sham control group and week 0 (baseline) data were excluded. The dashed lines indicate the LLOD for each assay. Correlation coefficients between binding antibody concentrations and neutralizing antibody titers were calculated using two-sided Spearman rank correlation.
Figure S1.
Figure S1.
Ad26 neutralizing antibodies measured in 20 NHPs at indicated time points (three time points, week 0, week 4, and week 10). Antibody levels in the individual animals are depicted with gray points, and paired measurements are connected with gray lines. The geometric mean titer of neutralizing antibody responses per group is indicated with the red line. The dotted lines indicate the LLOQ.
Figure S2.
Figure S2.
Correlation between SARS-CoV-2 neutralizing antibody titers as measured by different VNA assays for all groups and time points except week 0 time point. (A) Correlation between Leiden-0008 strain (B.1 lineage; LUMC) and Wuhan-Hu-1 (A lineage, Nexelis). rs = 0.90, P < 0.001. (B) Correlation between the Victoria/1/202 strain (A lineage; PHE) and Wuhan-Hu-1 (A lineage, Nexelis). rs = 0.91, P < 0.001. The dotted lines indicate the LLOD for each assay. Correlation coefficients between different neutralization assays were calculated using two-sided Spearman rank correlation.
Figure 3.
Figure 3.
SARS-CoV-2–specific cellular immune responses after vaccination of aged rhesus macaques. (A) Spike protein–specific T cell responses as measured in 40 NHP PBMC samples (20 NHPs and two time points) with an IFN-γ/IL-4 double-color ELISPOT at indicated time points. The geometric mean titer (GMT) response per group is indicated with a horizontal line. Samples with background subtracted counts below or equal to zero were set at 10 and 1 for IFN-γ and IL-4, respectively, for visualization purposes and are indicated by open symbols and the dotted line. (B) Spike protein–specific Th1 and Th2 cell responses as measured in 40 NHP PBMC samples (20 NHPs and two time points) by ICS at indicated time points. Frequency of CD4+CD69+ T cell–expressing Th1 cytokines (IFN-γ and/or IL-2 and not IL-4, IL-5, and IL-13) or Th2 cytokines (IL-4 and/or IL-5 and/or IL-13). SFU, spot-forming units. The geometric mean response per group is indicated with a horizontal line. The dotted line indicates the technical threshold. Open symbols denote samples at technical threshold.
Figure S3.
Figure S3.
Spike protein–specific CD4 and CD8 T cell responses after vaccination of aged rhesus macaques. (A) Spike protein–specific T cell responses as measured in 40 NHP PBMC samples (20 NHPs and two time points) by ICS at indicated time points. Frequency of CD4+CD69+ T cell–expressing cytokines. The geometric mean response per group is indicated with a horizontal line. The dotted line indicates the technical threshold. Open symbols denote samples at technical threshold. (B) Spike (S) protein–specific T cell responses as measured by ICS at indicated time points. Frequency of CD8+CD69+ T cell–expressing cytokines. The geometric mean response per group is indicated with a horizontal line. The dotted line indicates the technical threshold. Open symbols denote samples at technical threshold.
Figure S4.
Figure S4.
Viral load (sgmRNA copies/ml) kinetics in swabs and BAL after SARS-CoV-2 inoculation of 19 vaccinated aged rhesus macaques. Black lines represent individual animals, red lines the group median up to day 6, the last day of follow-up before scheduled euthanasia. Dotted horizontal line represents the LLOQ. Data of a related challenge of naive animals (n = 4) using an identical challenge strain, challenge regimen, and readouts were added to the sham control group data, collectively referred to as pooled control, to increase statistical power.
Figure 4.
Figure 4.
Protective efficacy against SARS-CoV-2 inoculation after vaccination of aged rhesus macaques. (A–D) Animals were challenged with 105 TCID50 SARS-CoV-2 administered intranasally and intratracheally 13 wk after the first vaccine dose. Data from a challenge of naive animals (n = 4) using an identical challenge strain, challenge regimen, and readouts were added to the sham control group data, collectively referred to as pooled control, to increase statistical power. (A) Cumulative viral load (sgmRNA) in daily nasal (left panel) and tracheal (right panel) swabs, defined by AUC calculation and expressed as log10 AUC (sgmRNA copies/ml × days) from 19 NHPs. Note that for AUC calculation, the day of death of all animals was aligned to day 7 to allow combining data from animals euthanized at day 7 and day 8. (B) Cumulative viral load (sgmRNA) in BAL, obtained every other day during the follow-up period, defined by AUC calculation and expressed as log10 AUC (sgmRNA copies/ml × days) from 13 NHPs. Note that it was only possible to perform BAL on a limited number of animals, and it was decided to exclude the one-dose 1011-vp Ad26.COV2.S group. (C) Viral load (sgmRNA) in lung tissue. Viral load was measured in each individual lung lobe (seven) of each animal (19 NHPs) and expressed as log10 sgmRNA copies/gram. A lower right lung lobe sample of one animal in the pooled control group was not available. (D) Fever duration, defined as AUC of the net temperature increase for each animal (19 NHPs) during the first 6 consecutive d of the follow-up period relative to a prechallenge baseline period. Red horizontal lines represent group geometric means; the dashed horizontal line indicates the LLOQ. Open symbols denote samples at LLOQ. Mean nasal and trachea swabs and BAL AUC values of each group were pairwise compared using Tobit ANOVA with post hoc z-test. Mean net temperature difference AUCs were pairwise compared between groups by t test.
Figure S5.
Figure S5.
Body temperatures after SARS-CoV-2 inoculation of 19 vaccinated aged rhesus macaques on day of infection and for 6 consecutive d afterward. Calendar dates are on top, animal id and group number labels on the right-hand side. Orange lines indicate the daily baseline temperature profile derived from a multiday window before virus inoculation in which no biotechnical interventions occurred. The blue line is the temperature of each animal after infection. Top: Body temperatures of the 1011-vp Ad26.COV2.S group. Middle: Body temperatures of the 5 × 10¹⁰–vp Ad26.COV2.S group. Bottom: Body temperatures of the pooled control animal group. p.i., post infection.
Figure 5.
Figure 5.
Lung histology after SARS-CoV-2 inoculation of vaccinated aged rhesus macaques. Seven individual lung lobes were evaluated for each animal in each treatment group (19 NHPs total). (A–C) 20× magnification overview image per treatment group. Scale bar is 1 mm. (D–F) H&E staining of rectangular areas as indicated in A–C. (D) In the one-dose 1011-vp Ad26.COV2.S group, minimal mononuclear cell interstitial infiltrate and minimal perivascular cuffing was observed. (E) In the two-dose 5 × 10¹⁰–vp Ad26.COV2.S group, multifocal small areas with minimal mixed-cell interstitial infiltrates (macrophages, scattered neutrophils, and lymphocytes) and minimal perivascular cuffing were observed. Alveolar lumina contained minimal macrophages, lymphocytes, and scattered neutrophils. (F) In the pooled control group animals, here represented by an animal of the Ad26.RSV.gLuc sham control group, focally extensive to diffuse lesions were observed with moderate mononuclear cell infiltrate in interstitium (macrophages, lymphocytes) and mild type II pneumocyte hyperplasia. Alveolar lumina contained edema, macrophages, lymphocytes, and scattered neutrophils. (G–I) SARS-CoV-2 −N immunohistochemistry (brown staining) of rectangular areas as indicated in A–C. Antigen-positive pneumocytes are marked with an asterisk (*). In the one-dose 1011–vp Ad26.COV2.S group, only one out of six animals had a single lung lobe in which antigen-positive pneumocyte staining was observed. (G) Focal area with individual SARS-CoV-2 N-positive pneumocytes (*) in the left caudal lung lobe. (H) Absence of SARS-CoV-2 N-positive pneumocytes in all lung lobes from all animals in the two-dose 5 × 10¹⁰–vp Ad26.COV2.S group. (I) Multifocal minimal to moderate numbers of SARS-CoV-2 N-positive pneumocytes (*) in seven out of eight pooled control animals. D–I are 200× magnification; scale bar is 100 µm.
Figure 6.
Figure 6.
Neutralizing activity of antibodies elicited by Ad26.COV2.S against SARS-CoV-2– spike variants. NHPs received 1 × 10¹¹ vp Ad26.COV2.S in a one-dose regimen (n = 6) or a two-dose regimen of 5 × 10¹⁰ vp Ad26.COV2.S (n = 6) or control Ad26.RSV.gLuc (n = 4) at study weeks 0 and 8. Neutralizing antibody titers of a subset (n = 4 per group) of Ad26.COV2.S-immunized NHP serum samples are shown. Dots are week 8 samples from the one-dose 1011-vp treatment group (i.e., 8 wk after the first dose). Triangles are week 10 samples from the two-dose 5 × 10¹⁰–vp treatment group (i.e., 2 wk after the second dose). Note that serum from one animal from the two-dose 5 × 10¹⁰–vp treatment group was not measured against the B.1 lineage (D614G) + E484K variant and lineage B.1.351 501Y.V2–del242-244 (RSA) due to lack of sufficient volume. Neutralizing antibody titers were below the limit of detection (LOD) in serum from the sham-immunized group, and sera did not have neutralizing antibody titers against the psVNA specificity control (i.e., lentivirus pseudotyped with VSVΔG). Neutralizing antibody titers are expressed as the geometric mean dilution giving a 50% reduction (IC50) in the luciferase readout relative to control wells without any serum added. Individual dots represent individual samples, as a geometric mean of a maximum of four individual assay runs of NHP samples, depending on the variant. Red horizontal bars per SARS-CoV-2–spike variant represent average geometric mean titers of individual NHPs. Dashed horizontal line represents the LOD of a 1:20 dilution. Samples with no measurable titer were set at LOD.

References

    1. Abbink, P., Lemckert A.A.C., Ewald B.A., Lynch D.M., Denholtz M., Smits S., Holterman L., Damen I., Vogels R., Thorner A.R., et al. . 2007. Comparative seroprevalence and immunogenicity of six rare serotype recombinant adenovirus vaccine vectors from subgroups B and D. J. Virol. 81:4654–4663. 10.1128/JVI.02696-06 - DOI - PMC - PubMed
    1. Anderson, E.J., Rouphael N.G., Widge A.T., Jackson L.A., Roberts P.C., Makhene M., Chappell J.D., Denison M.R., Stevens L.J., Pruijssers A.J., et al. . mRNA-1273 Study Group . 2020. Safety and Immunogenicity of SARS-CoV-2 mRNA-1273 Vaccine in Older Adults. N. Engl. J. Med. 383:2427–2438. 10.1056/NEJMoa2028436 - DOI - PMC - PubMed
    1. Baden, L.R., Walsh S.R., Seaman M.S., Tucker R.P., Krause K.H., Patel A., Johnson J.A., Kleinjan J., Yanosick K.E., Perry J., et al. . 2013. First-in-human evaluation of the safety and immunogenicity of a recombinant adenovirus serotype 26 HIV-1 Env vaccine (IPCAVD 001). J. Infect. Dis. 207:240–247. 10.1093/infdis/jis670 - DOI - PMC - PubMed
    1. Baden, L.R., El Sahly H.M., Essink B., Kotloff K., Frey S., Novak R., Diemert D., Spector S.A., Rouphael N., Creech C.B., et al. . COVE Study Group . 2021. Efficacy and Safety of the mRNA-1273 SARS-CoV-2 Vaccine. N. Engl. J. Med. 384:403–416. 10.1056/NEJMoa2035389 - DOI - PMC - PubMed
    1. Bos, R., Rutten L., van der Lubbe J.E.M., Bakkers M.J.G., Hardenberg G., Wegmann F., Zuijdgeest D., de Wilde A.H., Koornneef A., Verwilligen A., et al. . 2020. Ad26 vector-based COVID-19 vaccine encoding a prefusion-stabilized SARS-CoV-2 Spike immunogen induces potent humoral and cellular immune responses. NPJ Vaccines. 5:91. 10.1038/s41541-020-00243-x - DOI - PMC - PubMed

Publication types

MeSH terms

Substances