Review
. 2021 Apr 28;62(5):5.
doi: 10.1167/iovs.62.5.5.

IMI Pathologic Myopia

Affiliations
Review

IMI Pathologic Myopia

Kyoko Ohno-Matsui et al. Invest Ophthalmol Vis Sci. .

Erratum in

  • Erratum in: IMI Pathologic Myopia.
    [No authors listed] [No authors listed] Invest Ophthalmol Vis Sci. 2021 Jun 1;62(7):17. doi: 10.1167/iovs.62.7.17. Invest Ophthalmol Vis Sci. 2021. PMID: 34125158 Free PMC article. No abstract available.

Abstract

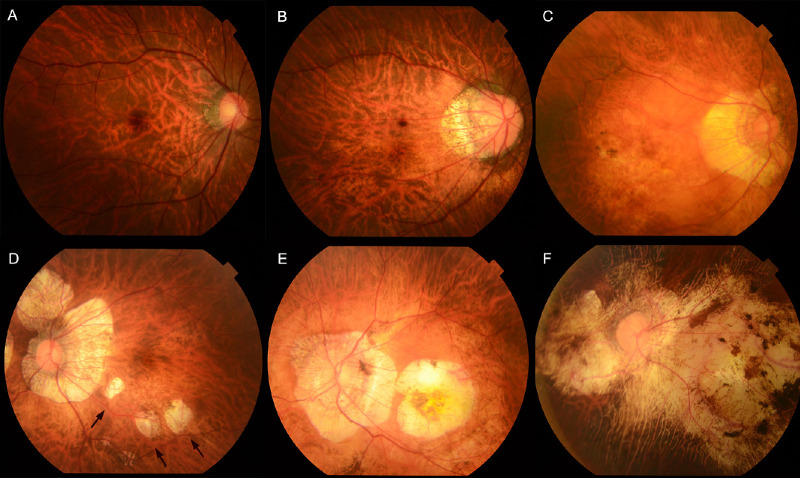
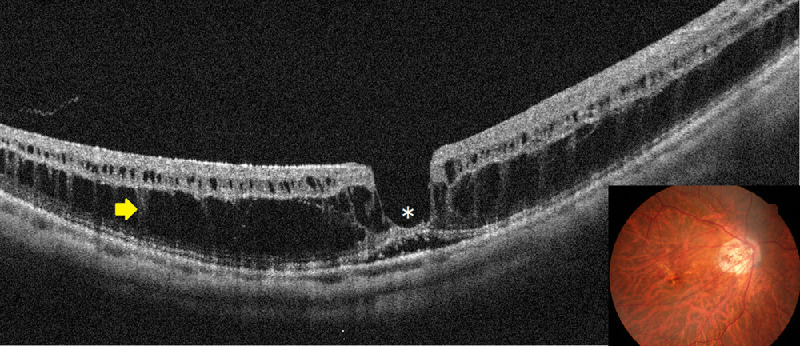
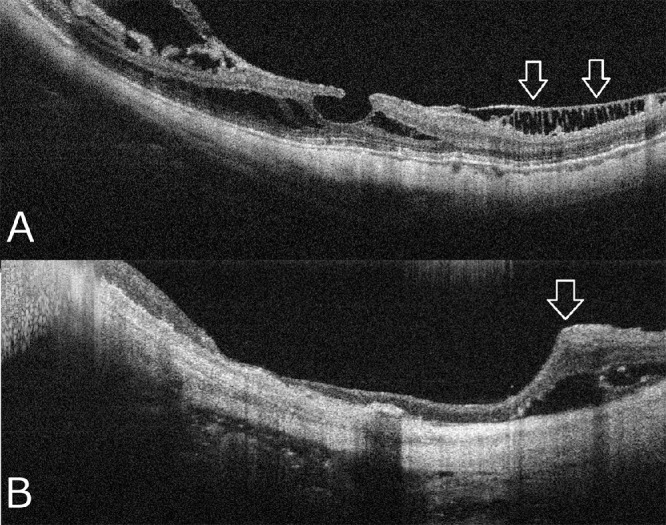
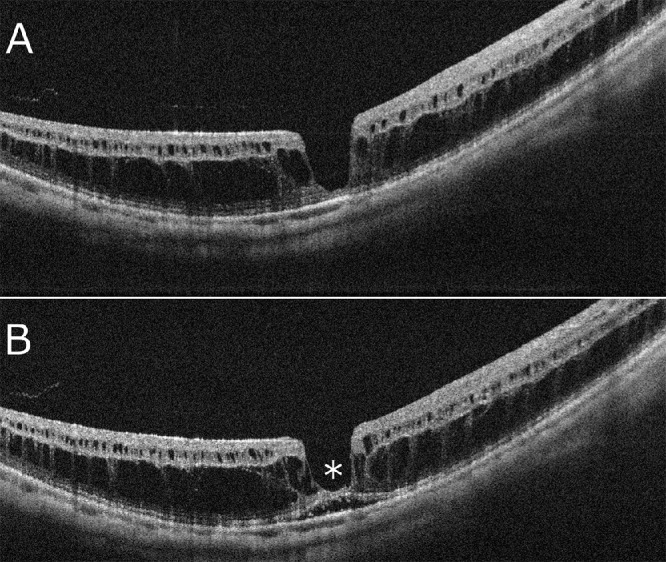
Pathologic myopia is a major cause of visual impairment worldwide. Pathologic myopia is distinctly different from high myopia. High myopia is a high degree of myopic refractive error, whereas pathologic myopia is defined by a presence of typical complications in the fundus (posterior staphyloma or myopic maculopathy equal to or more serious than diffuse choroidal atrophy). Pathologic myopia often occurs in eyes with high myopia, however its complications especially posterior staphyloma can also occur in eyes without high myopia. Owing to a recent advance in ocular imaging, an objective and accurate diagnosis of pathologic myopia has become possible. Especially, optical coherence tomography has revealed novel lesions like dome-shaped macula and myopic traction maculopathy. Wide-field optical coherence tomography has succeeded in visualizing the entire extent of large staphylomas. The effectiveness of new therapies for complications have been shown, such as anti-VEGF therapies for myopic macular neovascularization and vitreoretinal surgery for myopic traction maculopathy. Myopia, especially childhood myopia, has been increasing rapidly in the world. In parallel with an increase in myopia, the prevalence of high myopia has also been increasing. However, it remains unclear whether or not pathologic myopia will increase in parallel with an increase of myopia itself. In addition, it has remained unclear whether genes responsible for pathologic myopia are the same as those for myopia in general, or whether pathologic myopia is genetically different from other myopia.


Conflict of interest statement

Disclosure: K. Ohno-Matsui, Santen (C), Nevakar (C); P.-C. Wu, None; K. Yamashiro, None; K. Vutipongsatorn, None; Y. Fang, None; C.M.G. Cheung, Novartis, Bayer, Roche, Topcon, Zeiss, Allergan, and Boehringer Ingelheim (F, C); T.Y.Y. Lai, Bayer Healthcare (C, F, R), Boehringer Ingelheim (C), Roche (C, F, R), Novartis (C, F, R); Y. Ikuno, Novartis Pharma (R); S.Y. Cohen, Allergan (C), Bayer (C), Novartis (C), Thea (C), Roche (C); A. Gaudric, None; J.B. Jonas, Europäische Patentanmeldung 16 720 043.5 and Patent application US 2019 0085065 A1 „Agents for use in the therapeutic or prophylactic treatment of myopia or hyperopia” (P)

Figures

Figure 1.
Figure 1.
Images taken from 8-week-old lid-sutured chick. (A) Macroscopic appearance of the eyecup of a lid-sutured eye. Horizontal lacquer cracks could be seen running perpendicularly to the pecten. (B) Vascular cast at site of the LC and showing a central gap surrounded by areas of decreased choriocapillaris density and some large choroidal bridging vessels between the gap. (C) Histology image at the site of the LC. The white arrow depicts the proliferation and accumulation of RPE while the red arrows indicates both ends of Bruch's membrane.
Figure 2.
Figure 2.
Images taken from rge chick. (A, Left) Macroscopic appearance of an eyecup taken from a 7-week-old rge chick showing lacquer cracks as white linear lesions. Reprinted with permission from Montiani-Ferreira F, Kiupel M, Petersen-Jones SM. Spontaneous lacquer crack lesions in the retinopathy, globe enlarged (rge) chick. J Comp Pathol. 2004;131(2-3):105-11. Copyright © 2004 Elsevier Ltd. (B, Right) Histology image taken from 48-week-old rge chick showing Bruch's membrane rupture and absence of RPE (Toluidine blue. Bar, 20 mm).
Figure 3.
Figure 3.
Images of older lid-sutured (A) and rge chicks (BD). (A) Eyecup of 50-week-old lid-sutured chick. There are more orientations and a higher number of lacquer cracks compared with an 8-week-old lid-sutured eyecup with two lesions crisscrossing each other (red arrow) (B) Confocal scanning laser ophthalmoscopy (cSLO) FA of 134-week-old rge chicks showing three circular lesions near the pecten. (C) Spectral domain OCT (SD-OCT) image of a circular lesion illustrating the marked loss of tissue and the posterior bowing of sclera at the lesion site. (D) A 3D image of the circular lesion showing similar findings.
Figure 4.
Figure 4.
Images taken from 134-week-old rge chicks. (A) Confocal scanning laser ophthalmoscopy (cSLO) FA showing three circular lesions near the pecten. (B) Spectral domain OCT (SD-OCT) image of a circular lesion illustrating the marked loss of tissue and the posterior bowing of sclera at the lesion site. (C) A 3D image of the circular lesion showing similar findings.
Figure 5.
Figure 5.
Proposed nomenclature for staphylomas. (A) Normal eye shape. (B) Axial elongation occurring in the equatorial region that does not induce altered curvature in the posterior aspect of the eye. This eye has axial myopia but no staphyloma. (C) A second curvature occurs in the posterior portion of the eye with a small radius (r2) than the surrounding eye wall (r1). This secondary curve is staphyloma, Reproduced with permission from Spaide RF. Staphyloma: part 1. Pathologic Myopia: Springer; 2014:167-176.
Figure 6.
Figure 6.
Three-dimensional MRI of the eye with posterior staphyloma. A clear outpouching of a part of the posterior segment of the eye is observed in the image viewed from the side (left) as well as in the image viewed from the inferior (right).
Figure 7.
Figure 7.
Classification of staphyloma. A new classification of posterior staphyloma according to its location and extent. The staphyloma type is renamed according to its location and distribution. Type I → wide, macular staphyloma, Type II → narrow, macular staphyloma, Type III → peripapillary staphyloma, Type IV → nasal staphyloma, Type V → inferior staphyloma, Others → staphylomas other than type I to V. Reprinted with permission from Ohno-Matsui K. Proposed classification of posterior staphylomas based on analyses of eye shape by 3D-MRI. Ophthalmology. 2014;121:1798-1809. © 2014 American Academy of Ophthalmology. Published by Elsevier Inc.
Figure 8.
Figure 8.
Ultra-wide-field optical coherence tomographic image of staphyloma. (A) In a horizontal OCT section across the fovea, the edge of the staphyloma (arrow) shows consistent features with a gradual thinning of the choroid from the periphery toward the staphyloma edge as well as a gradual re-thickening of the choroid from the staphyloma edge in direction to the posterior pole, accompanied by a change in the curvature of the sclera at the staphyloma edge. The staphylomatous region shows a posterior outpouching of the sclera nasal to the staphyloma edge. (B) Three-dimensionally reconstructed image shows the staphyloma edge clearly (outlined by arrowheads). Reprinted with permission from Shinohara K, Shimada N, Moriyama M, et al. Posterior staphylomas in pathologic myopia imaged by widefield optical coherence tomography. Invest Ophthalmol Vis Sci. 2017;58:3750-3758. Licensed under a Creative Commons Attribution 4.0 International License (CC BY).
Figure 9.
Figure 9.
Fundus photographs showing different type of myopic maculopathy. (A) Right fundus showing a tessellated fundus with an axial length of 28.1 mm in a 37-year-old woman. The best-corrected visual acuity (BCVA) is 1.2. (B) Right fundus showing PDCA with an axial length of 29.76 mm in a 45-year-old woman. The BCVA is 0.8. (C) Right fundus showing MDCA with an axial length of 31.77 mm in a 76-year-old man. The BCVA is 0.5. (D) Left fundus showing patchy atrophy (arrows) with an axial length of 30.46 mm in a 60-year-old woman. The BCVA is 0.9. (E) Left fundus showing myopic MNV-related macular atrophy with an axial length of 33.16 mm in a 74-year-old woman. The BCVA is 0.15. (F) Left fundus showing patchy atrophy-related macular atrophy with an axial length of 32.95 mm in a 61-year-old woman. The BCVA is 0.2.
Figure 10.
Figure 10.
Diagram showing the progression patterns of high myopia to the different categories of pathologic myopia. Bruch's membrane, Bruch's membrane. Reproduced and modified with permission from Fang Y, Yokoi T, Nagaoka N, et al. Progression of myopic maculopathy during 18-year follow-up. Ophthalmology. 2018;125(6):863-877. © 2018 by the American Academy of Ophthalmology.
Figure 11.
Figure 11.
Typical appearance of myopic foveoschisis. The fundus photograph (inset) shows a slightly elevated retina at the posterior pole, although it is not clearly identifiable. A horizontal OCT scan involving the macula shows retinoschisis in multiple retinal layers and a retinal detachment at the fovea (asterisk). There is glial tissue bridging the inner and outer layers of the retinoschisis (a so-called column, arrow).
Figure 12.
Figure 12.
Representative OCT images specific high myopia. (A) an ILM detachment (arrows) shows that the ILM layer is detached from the other retinal layers owing to inflexibility of this layer. (B) Retinal microfolds (arrow) is associated with the retinal vessels showing microvascular traction on the retina.
Figure 13.
Figure 13.
Time course and two distinct subtypes of myopic foveoschisis of the same patient shown in Fig 11. (A) The OCT image at the initial visit showing the retinoschisis type characterized by only retinoschisis without a retinal detachment. (B) One year later, the foveal detachment type occurs, which is characterized by a small localized retinal detachment (asterisk). The photoreceptors are separated from the RPE.
Figure 14.
Figure 14.
OCT appearance of two distinct subtypes in highly myopic macular holes. (A) A macular hole without retinoschisis has only retinal cysts and is normally stable, whereas (B) a macular hole with surrounding retinoschisis usually presents a higher likelihood of consequent retinal detachment.
Figure 15.
Figure 15.
Round dome-shaped macula (DSM). The diagnosis of DSM may be challenging based on fundus examination (A, —). The border of the staphyloma (yellow line) appears on the wide-field color photo (C). FA (B) only shows a slight hyperfluorescence in the macula. The DSM is visible on both SD-OCT horizontal (D) and vertical (E) B-scans, which also reveal a serous macular detachment. The choroid is relatively thick in the subfoveal area. The 3D reconstruction of the macula (F, G) clearly shows the round inward bulge of the macula.
Figure 16.
Figure 16.
Vertical dome-shaped macula (DSM). Fundus examination (A) is not contributive. Fundus autofluorescence (B) shows a hypoautofluorescence revealing RPE atrophy in the macula, surrounded by hyperautofluorescent areas. FA shows an uneven hyperfluorescence with leaking points (C). The difference in curvature is obvious when comparing the OCT horizontal (D) and vertical (E) B-scans, or on the 3D reconstruction of the posterior pole (F). A SRD is present. MRI shows a macular focal thickening of the eye wall in the right eye (G, arrow).
Figure 17.
Figure 17.
Horizontal dome-shaped macula (DSM). Fundus photography (A) and fundus autofluorescence (B) show a horizontal band of RPE atrophy. The horizontal (C) and vertical (D) B-scans show a horizontal DSM associated with a shallow SRD.
Figure 18.
Figure 18.
Horizontal dome-shaped macula (DSM). Fundus photography (A) and fundus autofluorescence (B) show RPE atrophy in the macula. The vertical (C) scan shows a horizontally oriented bulge. The sclera is thicker beneath the macula than at its periphery.
Figure 19.
Figure 19.
Graph showing the pattern of distribution of choroidal thickness (CT) at different locations for each type of myopic maculopathy in the horizontal (A) and in the vertical direction (B). The CT was measured at the subfoveal region and at 3 mm nasal, temporal, superior, and inferior to the fovea. MA = macular atrophy.
Figure 20.
Figure 20.
The subfoveal CT (mean with standard deviation) in each myopic maculopathy are shown. The CT decreased significantly from normal fundus to tessellated fundus, to PDCA, and to MDCA in all locations. There is no significant difference in choroidal thickness between eyes with MDCA and patchy atrophy. *P < 0.05. CT = choroidal thickness; MA = macular atrophy; NS = not significant.

References

    1. Flitcroft DI, He M, Jonas JB, et al. .. IMI - defining and classifying myopia: a proposed set of standards for clinical and epidemiologic studies. Invest Ophthalmol Vis Sci. 2019; 60: M20–M30. - PMC - PubMed
    1. Duke-Elder S. (ed) Pathological Refractive Errors. St. Louis: Mosby; 1970.
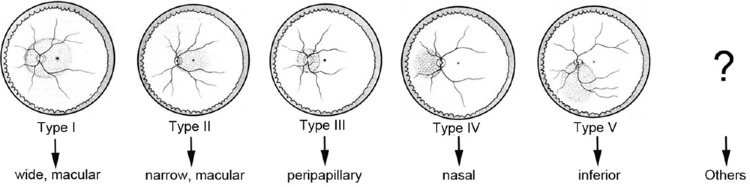
    1. Ohno-Matsui K, Kawasaki R, Jonas JB, et al. .. International photographic classification and grading system for myopic maculopathy. Am J Ophthalmol. 2015; 159: 877–883. - PubMed
    1. Ohno-Matsui K, Lai TY, Lai CC, Cheung CM. Updates of pathologic myopia. Prog Retin Eye Res. 2016; 52: 156–187. - PubMed
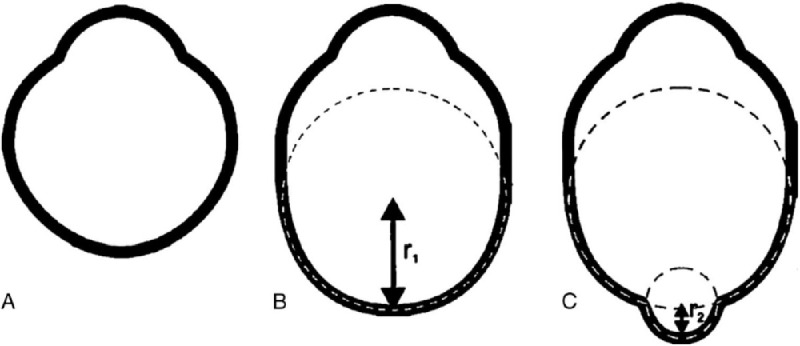
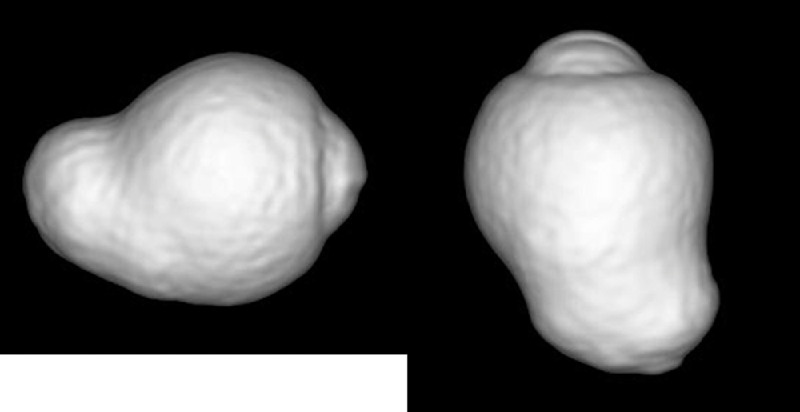
    1. Moriyama M, Ohno-Matsui K, Hayashi K, et al. .. Topographic analyses of shape of eyes with pathologic myopia by high-resolution three-dimensional magnetic resonance imaging. Ophthalmology. 2011; 118: 1626–1637. - PubMed

Publication types

LinkOut - more resources