. 2021 Sep 9;31(8):988-1004.
doi: 10.1093/glycob/cwab033.

Hydrocephalus in mouse B3glct mutants is likely caused by defects in multiple B3GLCT substrates in ependymal cells and subcommissural organ

Affiliations

Hydrocephalus in mouse B3glct mutants is likely caused by defects in multiple B3GLCT substrates in ependymal cells and subcommissural organ

Sanjiv Neupane et al. Glycobiology. .

Abstract

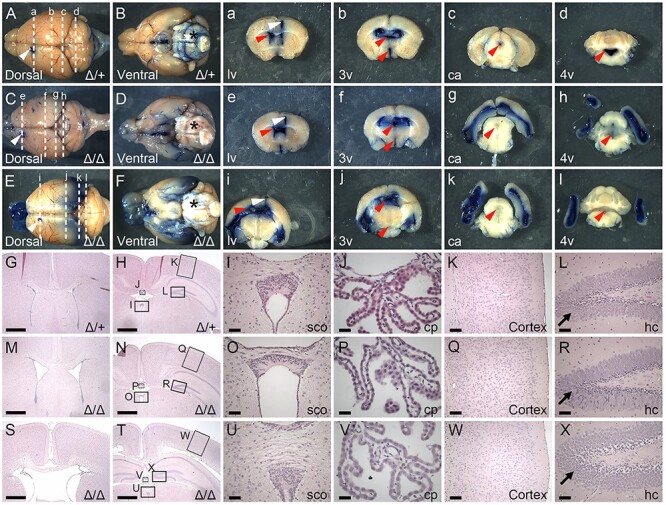
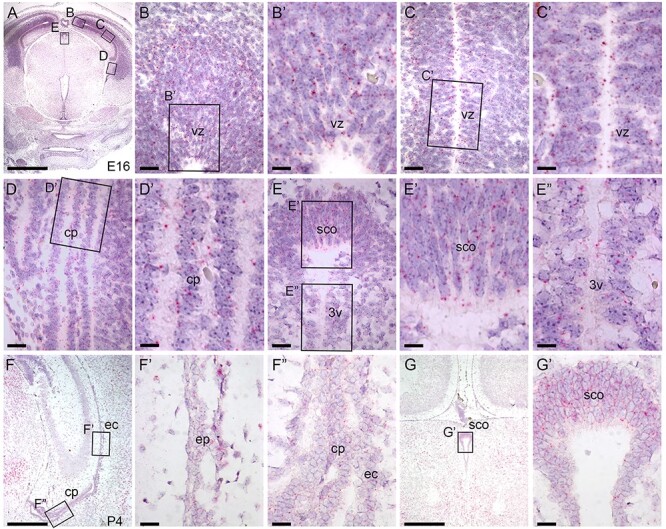
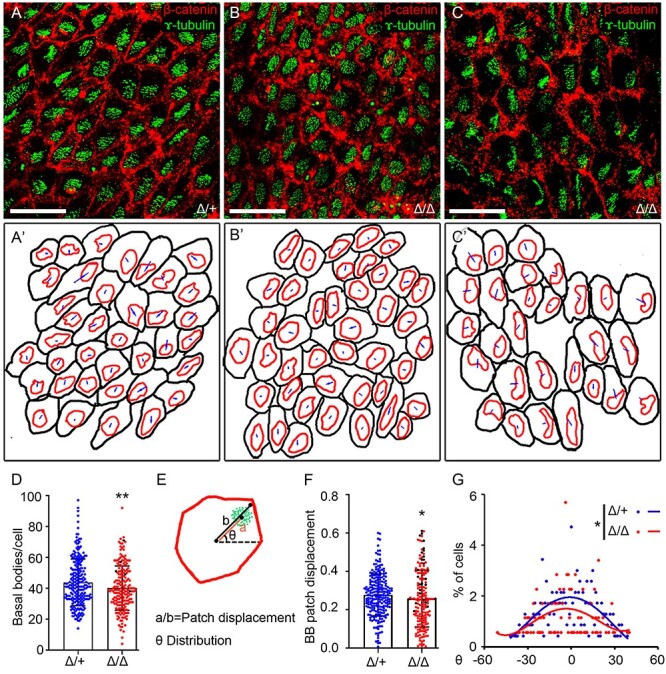
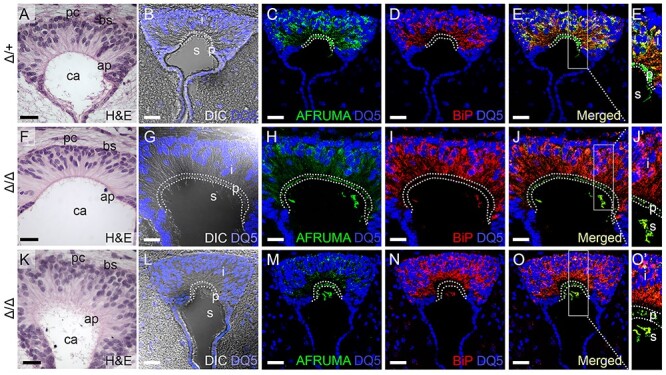
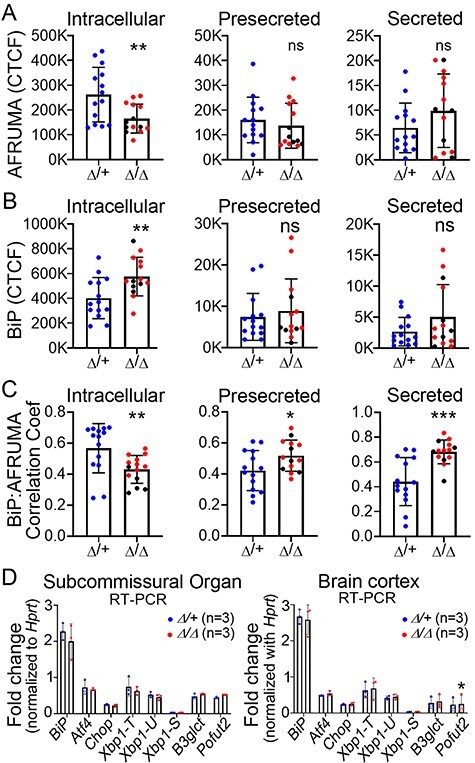
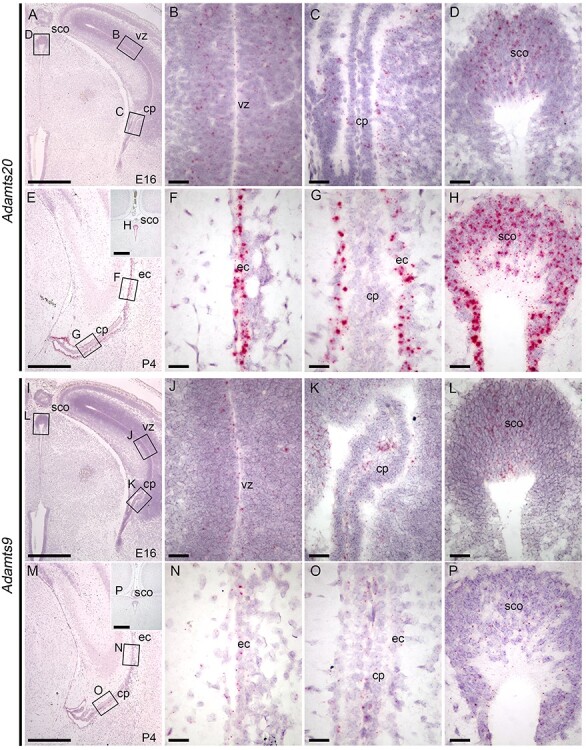
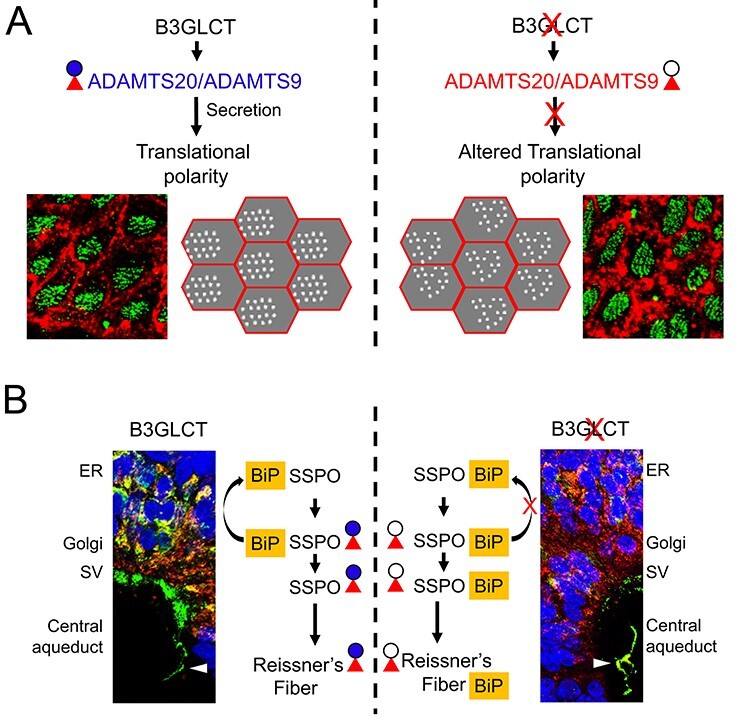
Peters plus syndrome, characterized by defects in eye and skeletal development with isolated cases of ventriculomegaly/hydrocephalus, is caused by mutations in the β3-glucosyltransferase (B3GLCT) gene. In the endoplasmic reticulum, B3GLCT adds glucose to O-linked fucose on properly folded thrombospondin type 1 repeats (TSRs). The resulting glucose-fucose disaccharide is proposed to stabilize the TSR fold and promote secretion of B3GLCT substrates, with some substrates more sensitive than others to loss of glucose. Mouse B3glct mutants develop hydrocephalus at high frequency. In this study, we demonstrated that B3glct mutant ependymal cells had fewer cilia basal bodies and altered translational polarity compared to controls. Localization of mRNA encoding A Disintegrin and Metalloproteinase with ThromboSpondin type 1 repeat 20 (ADAMTS20) and ADAMTS9 suggested that reduced function of these B3GLCT substrates contributed to ependymal cell abnormalities. In addition, we showed that multiple B3GLCT substrates (Adamts3, Adamts9 and Adamts20) are expressed by the subcommissural organ, that subcommissural organ-spondin ((SSPO) also known as SCO-spondin) TSRs were modified with O-linked glucose-fucose and that loss of B3GLCT reduced secretion of SSPO in cultured cells. In the B3glct mutant, intracellular levels of SSPO were reduced and BiP levels increased, suggesting a folding defect. Secreted SSPO colocalized with BiP, raising the possibility that abnormal extracellular assembly of SSPO into Reissner's fiber also contributed to impaired CSF flow in mutants. Combined, these studies underscore the complexity of the B3glct mutant hydrocephalus phenotype and demonstrate that impaired cerebrospinal fluid (CSF) flow likely stems from the collective effects of the mutation on multiple processes.

Keywords: C-mannosylation; O-fucosylation; SCO-spondin; hydrocephalus; thrombospondin.


Figures

Fig. 1
Fig. 1
Loss of B3glct impairs CSF flow. (A–F and a–l) Representative images taken 10 min following injection of Evans Blue dye into the anterior horn of the left lateral ventricle (lv) (White arrowhead) at 5 weeks of age. (A, C, E) Dorsal and (B, D, F) ventral whole brain views with anterior to left and posterior to right. (a–l) Thick coronal sections of whole brains with approximate locations of the plane of sectioning indicated by dashed lines in A–F. White arrowhead indicates dye injection site. Red arrowheads indicate respective ventricles or central aqueduct. (A, B and a–d) In control brains (Δ/+) (n = 5), Evans blue dye flowed through the ventricular system and was detected in the lateral (lv), third (3v), central aqueduct (ca) and fourth (4v), as well as in the perivascular space (*) on the surface of the brain. (C–F and e–l) In contrast in B3glct knockout (Δ/Δ) (n = 4) brains, dye accumulated in the lateral ventricles with reduced flow to the third and fourth ventricles in moderate ventriculomegaly (C, D and e–h) and severe hydrocephalus (E, F and i–l) brains. (G–X) Hematoxylin and eosin staining of coronal sections from postnatal day 21 (P21) control (Δ/+) (G–L), B3glct knockout (Δ/Δ) with mild ventriculomegaly (M–R) and B3glct knockout (Δ/Δ) with severe hydrocephalus (S–X) animals. (G, M, S) Sections taken through lv and (H, N, T) sections through 3v. Arrows in panels L, R and X indicate granular layer in dentate gyrus in hippocampus. Boxes in panels H, N and T indicate regions expanded in panels I–L, O–R and U–X. Abbreviations: cp, choroid plexus; sco, subcommissural organ; hc, hippocampus. Scale bars: panels G, H, M, N, S and T 1 mm; panels I, O, U, L, R, X 100 μm; panels J, P, V 50 μm; and K, Q, W 200 μm.
Fig. 2
Fig. 2
B3glct is expressed ubiquitously in brain. RNAscope® analysis of B3glct mRNA expression. Localization of B3glct mRNA appears as red dots overlying cells counterstained with hematoxylin (purple). (A–E″) At E 16.5, B3glct transcripts were localized in the ventricular zone (vz) of the cortex (B–C′), choroid plexus (cp) (D, D′), subcommissural organ (sco) (E, E′) and ependyma of third ventricle (3v) (E″). (F–G′) At P4, B3glct mRNA was localized to ependymal cells (ec) of the lateral ventricle (F′), choroid plexus (cp) (F″) and subcommissural organ (sco) (G, G′). Rectangles indicate the magnified regions of brain sections. Scale bars: panel A, 1 mm; panel F, G, 500 μm; panels B, C, D, E, F′, F″ and G′, 50 μm; and panels B′, C′, D′, E′ and E″, 20 μm.
Fig. 3
Fig. 3
Loss of B3glct decreases number of basal bodies and alters translational polarity in ependymal cell. Analysis of cell polarity in P21 lateral ventricles. (A–C) Representative maximum projection images of P21 whole-mount brain lateral ventricular walls stained with γ-tubulin (green) to detect basal bodies and β-catenin (red) to identify cell borders in (A) B3glct control (Δ/+), (B) and B3glct knockouts (Δ/Δ) with mild ventriculomegaly, or (C) severe hydrocephalus. (A–C′) Representative tracings of cells in maximum projection images used to calculate basal body patch displacement and theta distribution. (D) Total basal bodies per ependymal cells. (E) Cartoon depicting cell measurements used to calculate basal body patch displacement (a/b) (F) and theta angle (G). (D, F, G) Blue indicates B3glct control (Δ/+), red indicates B3glct knockout (Δ/Δ) with mild ventriculomegaly and black indicates B3glct knockout (Δ/Δ) with severe hydrocephalus. Data were evaluated for statistical significance using unpaired, two-tailed t-test (D), Mann–Whitney test (F) and Watson’s two-sample U2 test (G). *P ≤ 0.05, **P ≤ 0.01. Scale bars: panel A–C 20 μm.
Fig. 4
Fig. 4
SSPO is a novel B3GLCT substrate and requires B3GLCT for efficient trafficking. (A) Domain structure of SCO-spondin (SSPO). The 25 SSPO TSRs are depicted by ovals. Red ovals identify 17 TSRs that have a consensus sequence for POFUT2 mediated O-fucosylation. White ovals are TSRs that lack a serine or threonine (S/T) in the consensus sequences for O-fucosylation, and P above a TSR indicates a proline in the position usually occupied by S/T. TSRs with consensus for modification with C-mannose are marked with diagonal black lines. In this study, we used the pSecTag2-SSPO TSRs 6–9 construct to confirm the presence of the glucose–fucose disaccharide (red triangle indicating fucose and blue circle glucose) and one or two C-mannose residues (green circles with #) on TSRs 6, 7, 8 and 9. Other SSPO domains include VWFD, von Willebrand factor–type D domain; LDLR-A, low density lipoprotein receptor class A domain; EGF, epidermal growth factor-like (EGF) domain; F5/8, factor V/VIII type C-like domain; VWFC, von Willebrand factor C repeats; CTCK, C-terminal cysteine knot domain. (B) Extracted ion chromatograms (EIC) of ions corresponding to the different glycoforms of peptides from TSRs 6, 7, 8 and 9 containing the POFUT2 consensus sequence. MS2 spectra for the major glycoforms and masses of ions used to generate the EICs can be found in Supplemental Figure 2. Although the score for the O-fucose glycopeptide from TSR6 was low, the mass of the parent ion matches the predicted mass of the glycopeptide and was used to generate the EIC. Black lines, unmodified peptide; red lines, fucose-modified peptide; blue lines, glucose–fucose–modified peptides. * indicate ions that match the mass of the relevant peptide but do not match the MS2 fragmentation pattern. (C) EICs of ions corresponding to the glycopeptides from TSRs 6, 7, 8 and 9 containing the C-mannosylation W-X-X-W motif. MS2 spectra for the major glycoforms and masses of ions used to generate the EICs can be found in Supplemental Figure 3. Black lines, unmodified peptide; green lines, Hex-modified peptide; orange lines, Hex–Hex modified peptides; pink lines, Hex–Hex–Hex modified peptides. The modified W is indicated by yellow shading for TSRs 6, 7 and 8. The MS2 data for the peptide from TSR9 are of insufficient quality to determine the location of the C-mannose. (D–F) Cell-based secretion assays were used to measure the effects of POFUT2 and B3GLCT mutations on trafficking of SSPO TSRs 6–9-Myc-His6 (TSRs 6–9, underlined in panel A) in wild-type HEK293T (WT), CRISPR-Cas9 mutagenized POFUT2 (P2 KO) or B3GLCT (B3 KO) HEK293T cells, or mutagenized cells rescued by cotransfection with plasmids encoding wild-type POFUT2 (+P2) or B3GLCT (+B3). (D) Representative western blot of the medium (above) and cell lysate (below). TSRs 6–9 were detected with anti-Myc (red), and GFP (green) was used as an internal transfection control. (E, F) Quantification of western blots of medium (E) and cell lysate (F). Data were evaluated for statistical significance using unpaired, one-tailed t-test. *P ≤ 0.05, **P ≤ 0.01, ns not significant. P ≤ 0.05).
Fig. 5
Fig. 5
AFRUMA is secreted in B3glct mutant subcommissural organ. (A–O′) Analysis of SSPO trafficking in subcommissural organs from P21 wild-type (Δ/+) (A–E′) and B3glct knockout (Δ/Δ) with mild ventriculomegaly (F–J′) or severe hydrocephalus (K–O′). (A, F, K) Hematoxylin and eosin (H&E)-stained subcommissural organ sections. pc, posterior commissure; bs, basal side; ap, apical side; and ca, central aqueduct. (B, G, L) DRAQ5 (DQ5) staining of subcommissural organ sections merged with differential interference contrast (DIC) image to indicate boundaries of intracellular (i), presecretory (p) and secreted (s) regions of the subcommissural organ. (C–E′, H–J′, and M–O′) Maximum projection images of immunostained subcommissural organ sections stained with AFRUMA (green) and DRAQ5 (blue) (C, H, M) or anti-BiP (red) and DRAQ5 (blue) (D, I, N). Merged channels are shown in (E–E′, J–J′, and O–O′). Rectangles in (E, J, O) indicate regions digitally expanded to the right (E′, J′, O′). Dotted curves demarcate intracellular, presecretory and secreted regions in subcommissural organs. See Figure 6 for quantification of immunofluorescence signals and colocalization of signals. Scale bars: panels A, F, K, 50 μm, and panels B–E, G–J, L–O, 20 μM.
Fig. 6
Fig. 6
Secreted AFRUMA colocalizes with BiP in B3glct mutants, but UPR not activated. (A–C) Quantitation of corrected total cell fluorescence (CTCF) for AFRUMA (A) or BiP (B), and correlation coefficient for BiP and AFRUMA (C) in the intracellular and presecretory regions of the subcommissural organ and central canal (secreted). Representative images are shown in Figure 5. Fluorescence was measured from 14 sections located in the middle part of the subcommissural organ from five animals from each group (n = 5). Measurements for B3glct heterozygous controls (Δ/+) are plotted in blue dots; B3glct homozygotes (Δ/Δ) are plotted as red dots (mild ventriculomegaly) and black dots (severe hydrocephalus). (D) qRT-PCR analysis of UPR genes in subcommissural organ and brain cortex. Xbp1-T, -U and -S indicate total, unspliced and spliced form of Xbp1, respectively. Data were evaluated for statistical significance using unpaired, two-tailed t-test. *P ≤ 0.05, **P ≤ 0.01, ***P ≤ 0.001, ns not significant.
Fig. 7
Fig. 7
Adamts9 and Adamts20 mRNA localization in brain at E16 and P4. RNAscope™ analysis of (A–H) Adamts20 and (I–P) Adamts9 mRNA localization at E16 (A–D, I–L) and P4 (E–H, M–P). Areas indicated by black rectangles in panels A and E are expanded in panels B–D and F–H, respectively. Areas indicated by black rectangles in I and M are expanded in J–L and N–P, respectively. Scale bars: panels A, E, I, M, and insets, 500 μm; panels B–D, F–H, J–L and N–P, 50 μm. Abbreviations: vz, ventricular zone of cortex; cp, choroid plexus; ec, ependymal cells of lateral ventricle; sco, subcommissural organ.
Fig. 8
Fig. 8
O-linked glucose-β1-3fucose disaccharide modification of TSRs is important for secretion and extracellular assembly of B3GLCT substrates. Impaired CSF flow in B3glct mutants likely results from the combined effects of the mutation on multiple substrates by impacting the efficiency of substrate secretion and/or extracellular assembly/function of substrates. (A) B3GLCT/POFUT2 modification facilitates stabilization of ADAMTS20 and ADAMTS9 TSR folds and promotes efficient secretion of these substrates, especially ADAMTS20 (Holdener et al. 2019). (A, top left) We propose that postnatal expression of Adamts20 and Adamts9 in the ependymal cells promotes translational polarity of the ependymal cell cilia by altering properties of the matrix and/or a noncanonical role in regulating cilia. (A, top right) In B3glct mutants, defects in ADAMTS20 and ADAMTS9 secretion (Holdener et al. 2019) result in impaired translational polarity of ependymal cells in B3glct mutants. (B) We propose that B3GLCT/POFUT2 modification of SSPO is not only important for efficient trafficking of SSPO but is also likely important for extracellular assembly of SSPO. (B, left) In wild-type subcommissural organ cells, SSPO and BiP colocalize within the ER. As SSPO transits to the Golgi, BiP is returned to the ER, and SSPO is packaged into secretory vesicles, processed and secreted. Secreted SSPO is found both as soluble fragments in the CSF and also assembles via intermolecular and intramolecular disulfide bonds (Munoz et al. 2019). (B, right) In B3glct mutants, intracellular levels of SSPO are reduced consistent with a role for the O-linked disaccharide in stabilizing the TSR fold. However, the continued association of SSPO with BiP in secretory vesicles and Reissner’s fiber suggests a defect in intra- or intermolecular assemble of SSPO, raising the possibility for an alternate role for the disaccharide in protecting the TSR disulfide bond from inappropriate extracellular intermolecular isomerization. Red triangle and blue circle indicate fucose and glucose, respectively, and black circle indicates glucose is absent. Abbreviations: ER, endoplasmic reticulum; SV, secretory vesicles.

Similar articles

Cited by

References

    1. Abdelhamed Z, Vuong SM, Hill L, Shula C, Timms A, Beier D, Campbell K, Mangano FT, Stottmann RW, Goto J. 2018. A mutation in Ccdc39 causes neonatal hydrocephalus with abnormal motile cilia development in mice. Development. 145:dev154500. - PMC - PubMed
    1. Adams CJ, Kopp MC, Larburu N, Nowak PR, Ali MMU. 2019. Structure and molecular mechanism of ER stress signaling by the unfolded protein response signal activator IRE1. Front Mol Biosci. 6:11. - PMC - PubMed
    1. Amirav I, Wallmeier J, Loges NT, Menchen T, Pennekamp P, Mussaffi H, Abitbul R, Avital A, Bentur L, Dougherty GW, et al. 2016. Systematic analysis of CCNO variants in a defined population: Implications for clinical phenotype and differential diagnosis. Hum Mutat. 37:396–405. - PubMed
    1. Baas D, Meiniel A, Benadiba C, Bonnafe E, Meiniel O, Reith W, Durand B. 2006. A deficiency in RFX3 causes hydrocephalus associated with abnormal differentiation of ependymal cells. Eur J Neurosci. 24:1020–1030. - PubMed
    1. Benveniste H, Liu X, Koundal S, Sanggaard S, Lee H, Wardlaw J. 2019. The glymphatic system and waste clearance with brain aging: A review. Gerontology. 65:106–119. - PMC - PubMed

Publication types