

Public Compliance With Social Distancing Measures and SARS-CoV-2 Spread : A Quantitative Analysis of 5 States
- PMID: 33909541
- PMCID: PMC8203040
- DOI: 10.1177/00333549211011254
Public Compliance With Social Distancing Measures and SARS-CoV-2 Spread : A Quantitative Analysis of 5 States
Abstract
Objective: We quantified the association between public compliance with social distancing measures and the spread of SARS-CoV-2 during the first wave of the epidemic (March-May 2020) in 5 states that accounted for half of the total number of COVID-19 cases in the United States.
Methods: We used data on mobility and number of COVID-19 cases to longitudinally estimate associations between public compliance, as measured by human mobility, and the daily reproduction number and daily growth rate during the first wave of the COVID-19 epidemic in California, Illinois, Massachusetts, New Jersey, and New York.
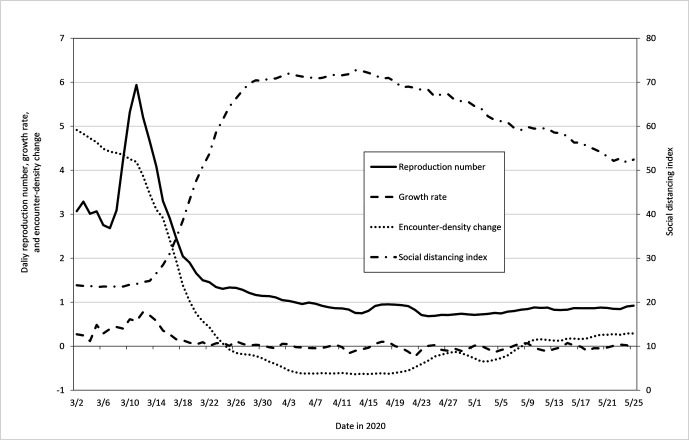
Results: The 5 states mandated social distancing directives during March 19-24, 2020, and public compliance with mandates started to decrease in mid-April 2020. As of May 31, 2020, the daily reproduction number decreased from 2.41-5.21 to 0.72-1.19, and the daily growth rate decreased from 0.22-0.77 to -0.04 to 0.05 in the 5 states. The level of public compliance, as measured by the social distancing index (SDI) and daily encounter-density change, was high at the early stage of implementation but decreased in the 5 states. The SDI was negatively associated with the daily reproduction number (regression coefficients range, -0.04 to -0.01) and the daily growth rate (from -0.009 to -0.01). The daily encounter-density change was positively associated with the daily reproduction number (regression coefficients range, 0.24 to 1.02) and the daily growth rate (from 0.05 to 0.26).
Conclusions: Social distancing is an effective strategy to reduce the incidence of COVID-19 and illustrates the role of public compliance with social distancing measures to achieve public health benefits.
Keywords: COVID-19; SARS-CoV-2; impact assessment; public compliance; social distancing.
Conflict of interest statement
Figures
References
-
- GitHub . Coronavirus (COVID-19) data in the United States. The New York Times. 2021. Accessed June 15, 2020. https://github.com/nytimes/covid-19-data
-
- Maryland Transportation Institute . University of Maryland COVID-19 impact analysis platform. 2020. Accessed June 20, 2020. https://data.covid.umd.edu
Publication types
MeSH terms
LinkOut - more resources
Full Text Sources
Other Literature Sources
Medical
Miscellaneous
