. 2022 Mar 25;118(5):1262-1275.
doi: 10.1093/cvr/cvab148.

Endothelial Zeb2 preserves the hepatic angioarchitecture and protects against liver fibrosis

Affiliations

Endothelial Zeb2 preserves the hepatic angioarchitecture and protects against liver fibrosis

Willeke de Haan et al. Cardiovasc Res. .

Abstract

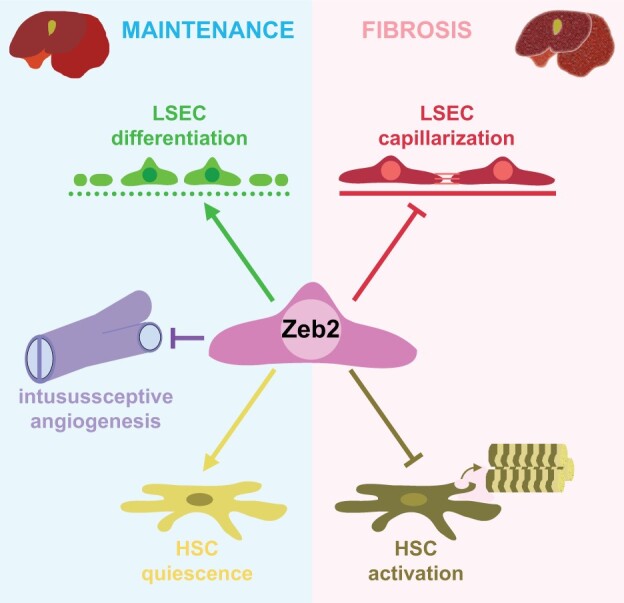
Aims: Hepatic capillaries are lined with specialized liver sinusoidal endothelial cells (LSECs) which support macromolecule passage to hepatocytes and prevent fibrosis by keeping hepatic stellate cells (HSCs) quiescent. LSEC specialization is co-determined by transcription factors. The zinc-finger E-box-binding homeobox (Zeb)2 transcription factor is enriched in LSECs. Here, we aimed to elucidate the endothelium-specific role of Zeb2 during maintenance of the liver and in liver fibrosis.

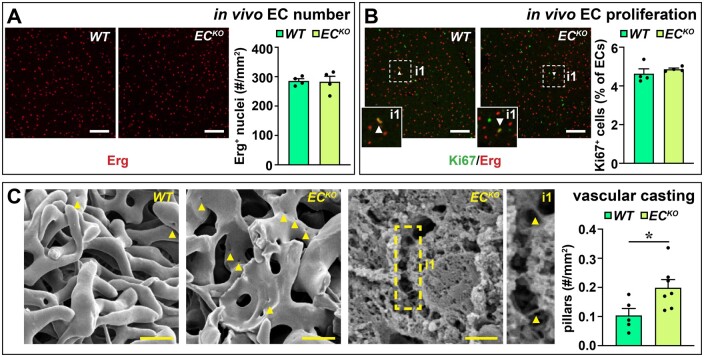
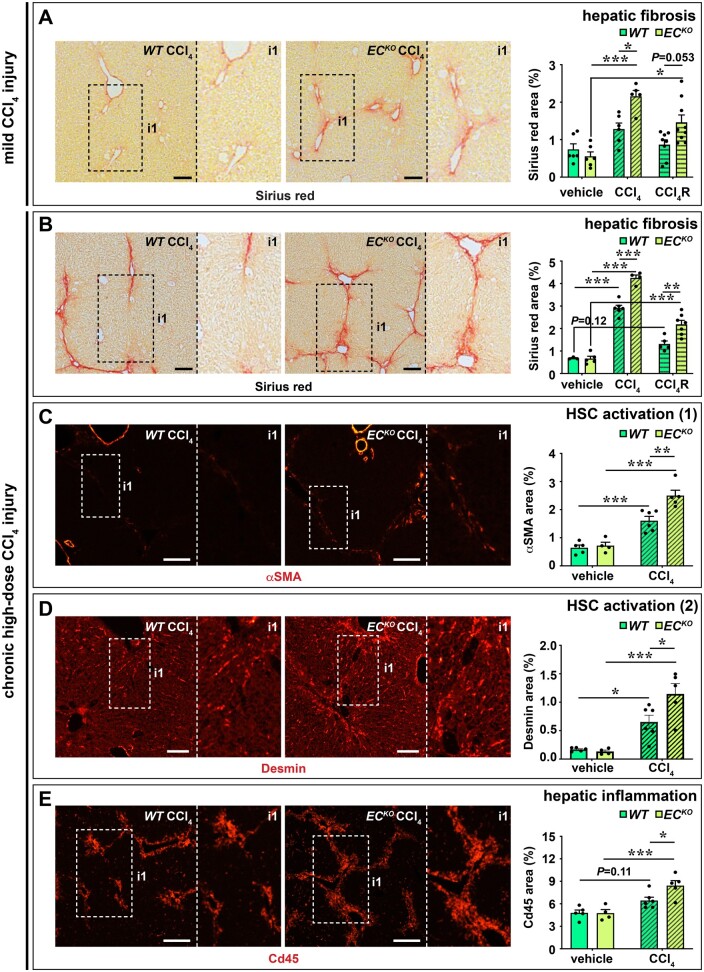
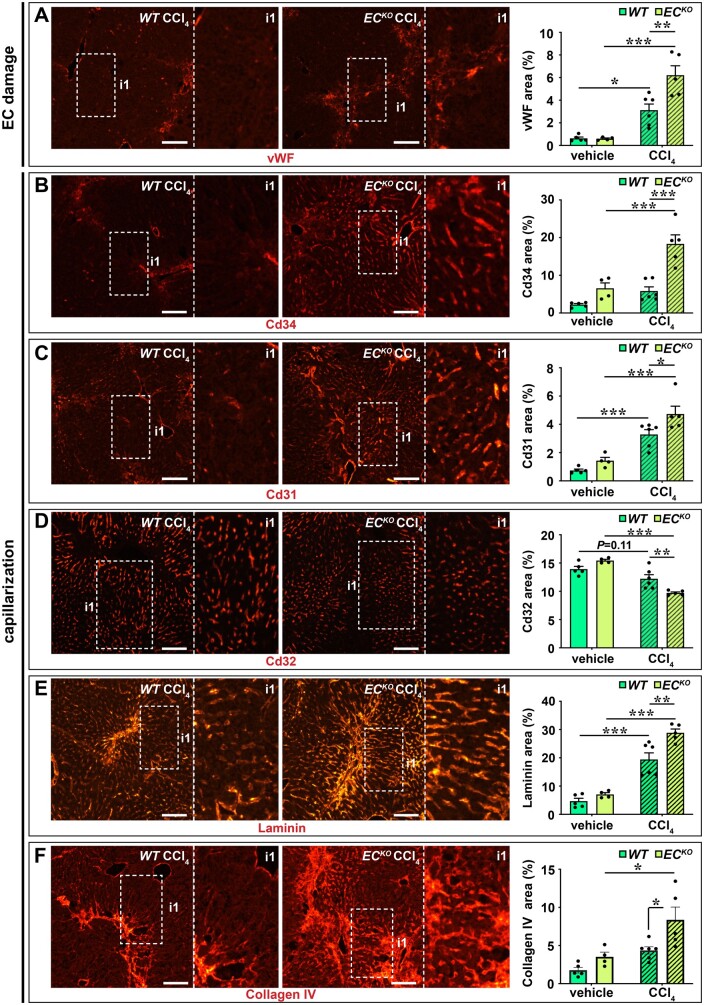
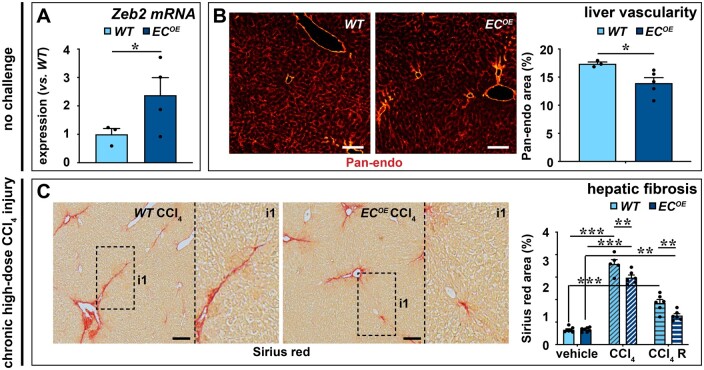
Methods and results: To study the role of Zeb2 in liver endothelium we generated EC-specific Zeb2 knock-out (ECKO) mice. Sequencing of liver EC RNA revealed that deficiency of Zeb2 results in prominent expression changes in angiogenesis-related genes. Accordingly, the vascular area was expanded and the presence of pillars inside ECKO liver vessels indicated that this was likely due to increased intussusceptive angiogenesis. LSEC marker expression was not profoundly affected and fenestrations were preserved upon Zeb2 deficiency. However, an increase in continuous EC markers suggested that Zeb2-deficient LSECs are more prone to dedifferentiation, a process called 'capillarization'. Changes in the endothelial expression of ligands that may be involved in HSC quiescence together with significant changes in the expression profile of HSCs showed that Zeb2 regulates LSEC-HSC communication and HSC activation. Accordingly, upon exposure to the hepatotoxin carbon tetrachloride (CCl4), livers of ECKO mice showed increased capillarization, HSC activation, and fibrosis compared to livers from wild-type littermates. The vascular maintenance and anti-fibrotic role of endothelial Zeb2 was confirmed in mice with EC-specific overexpression of Zeb2, as the latter resulted in reduced vascularity and attenuated CCl4-induced liver fibrosis.

Conclusion: Endothelial Zeb2 preserves liver angioarchitecture and protects against liver fibrosis. Zeb2 and Zeb2-dependent genes in liver ECs may be exploited to design novel therapeutic strategies to attenuate hepatic fibrosis.

Keywords: Capillarization; Intussusceptive angiogenesis; Liver fibrosis; Liver sinusoidal endothelial cells; Zeb2.


Figures

None
Graphical abstract
Figure 1
Figure 1
Zeb2 is highly expressed in liver endothelium. (A) Zeb2 mRNA expression in ECs isolated by FACS from Tie2-GFP livers, hearts, and brains (n =4). (BD) Sections of Zeb2-eGFP liver (B), heart (C), or brain (D) stained for Zeb2-eGFP (red) and EC markers Erg (green) or BS-I lectin (green). Hoechst (blue) was used as nuclear counterstain. Arrowheads indicate EC nuclei. Data are expressed as mean ± sem; **P <0.01 by one-way ANOVA with Bonferroni post hoc test. Scale bars: 50 µm. EC, endothelial cell.
Figure 2
Figure 2
EC-specific Zeb2-KO alters expression of genes related to LSEC capillarization and HSC communication. (A) Number of differentially expressed genes in LSECs, HSCs, KCs, and HEPs (n =2). (B) Pathways affected by Zeb2 (based on Enrichr analysis; n =2; top). Expression of LSEC markers (determined by qRT-PCR on an extended set of mice; n = 5–7; middle) and continuous EC markers (heat map generated from the RNA sequencing dataset; n = 2; bottom). (C) NicheNet-based predictions of ligands downregulated in LSEC source cells and targets downregulated in HSC target cells (n =2; middle). Expression of LSEC-derived ligand genes (bottom) and HSC target genes (top; highlighted in red in the middle diagram; determined by qRT-PCR on an extended set of mice; n =5–7). Data are expressed as mean ± sem; *P <0.05, **P <0.01 by the Student’s t-test. EC, endothelial cell; HEPs, hepatocytes; HSC, hepatic stellate cell; KCs, Kupffer cells; LSEC, liver sinusoidal endothelial cell; WT, wild-type.
Figure 3
Figure 3
EC-specific Zeb2-KO distorts the angioarchitecture of the liver. (A and B) Hepatic Pan-endo+ (n = 4) and Cd32+ area (n = 8). (C) Number of medium-sized vessels counted on Pan-endo-stained sections (left; n =4) and the ratio of portal vs. central veins (right; n =8). (D) Representative scanning EM images of vascular corrosion casts and size distribution of sinusoidal diameter (n = 7–9; bottom). (E) Representative selection of vascular planes recorded by UFUS imaging of the left (lateral) lobe. (F) Hepatic blood volume before bandpass filtering (n = 6–8). (G and H) Representative Doppler images showing blood flow bandpass filtering in the region of interest for three different speed ranges, corresponding to three-vessel size ranges (G) and quantification of blood volume (n = 6–8) (H). Data are expressed as mean ± sem, ultrafast ultrasound data are expressed in AU as mean ± sem. *P <0.05, **P <0.01 by the Student’s t-test (A, B, C, and F) or two-way ANOVA with Bonferroni post hoc test (H). Scale bars: 3 mm in E and G; 100 µm in A, B, and D; and 50 µm in D, inset. AU, arbitrary units; EC, endothelial cell; UFUS, ultrafast ultrasound; WT, wild-type.
Figure 4
Figure 4
Endothelial Zeb2-KO promotes intussusceptive angiogenesis. (A and B) Number of Erg+ ECs (A; n =4) and % of Ki67+ Erg+ ECs (B; n =4). Arrowheads indicate proliferating ECs. (C) Representative scanning EM images of vascular corrosion casts (left) or a liver slice (middle) of an ECKO mouse and corresponding quantification (right) of number of intussusceptive pillars (n =5–7). Arrowheads indicate pillars. Data are expressed as mean ± sem; *P <0.05 by the Student’s t-test. Scale bars: 20 µm in C, left; 5 µm in C, middle. EC, endothelial cell; WT, wild-type.
Figure 5
Figure 5
Endothelial Zeb2-KO promotes toxin-induced liver fibrosis. (A) Collagen content (Sirius red+ area; n =6–9) after treatment with oil (vehicle) or 1 week low-dose CCl4. Livers were analysed 24 h (progression cohort) or 1 week after the last oil or CCl4 injection (regression cohort ‘R’). (B) Collagen content (Sirius red+ area; n =3–7) after treatment with oil (vehicle) or 4 weeks high-dose CCl4. Livers were analysed 24 h after last oil or CCl4 injection (progression cohort) or 1 week after last oil or CCl4 injection (regression cohort ‘R’). (CE) α-Smooth muscle actin (SMA)+ area (C; n =4–6), Desmin+ area (D; n =4–6), and Cd45+ area (E; n =4–6) after treatment with oil (vehicle) or high-dose CCl4. Data are expressed as mean ± sem; *P <0.05, **P <0.01, ***P <0.001 by one-way ANOVA with Bonferroni post hoc test. Scale bars: 100 µm. EC, endothelial cell; HSC, hepatic stellate cell; WT, wild-type.
Figure 6
Figure 6
Endothelial Zeb2-KO promotes toxin-induced LSEC damage and capillarization. (AF) vWF+ area (A), Cd34+ area (B), Cd31+ area (C), Cd32+ area (D), Laminin+ area (E), and Collagen type IV+ area (F) in livers after treatment with oil (vehicle) or 4 weeks high-dose CCl4. Data are expressed as mean ± sem; n =4–7. *P <0.05, **P <0.01, ***P <0.001 by one-way ANOVA with Bonferroni post hoc test. Scale bars: 100 µm. EC, endothelial cell; vWF, von Willebrand factor; WT, wild-type.
Figure 7
Figure 7
Endothelial Zeb2-overexpression reduces vascular expansion and toxin-induced fibrosis. (A) Expression of Zeb2 in ECs from WT or EC-specific Zeb2 overexpressing (‘ECOE’ mice; n =5). (B) Pan-endo+ area 4 weeks after the last tamoxifen injection (n =3–5). (C) Collagen content (Sirius red+ area; n =5–7) mice 24 h after the last injection of oil or CCl4 (progression cohort) or 1 week after the last CCl4 injection (regression cohort ‘R’). Data are expressed as mean ± sem; *P <0.05, **P <0.01, ***P <0.001 by the Student’s t-test (A and B) or one-way ANOVA with Bonferroni post hoc test (C). Scale bars: 100 µm. EC, endothelial cell; WT, wild-type.

Similar articles

Cited by

References

    1. Aird WC. Phenotypic heterogeneity of the endothelium: II. Representative vascular beds. Circ Res 2007;100:174–190. - PubMed
    1. Coppiello G, Collantes M, Sirerol-Piquer MS, Vandenwijngaert S, Schoors S, Swinnen M, Vandersmissen I, Herijgers P, Topal B, van Loon J, Goffin J, Prósper F, Carmeliet P, García-Verdugo JM, Janssens S, Peñuelas I, Aranguren XL, Luttun A. Meox2/Tcf15 heterodimers program the heart capillary endothelium for cardiac fatty acid uptake. Circulation 2015;131:815–826. - PubMed
    1. Geraud C, Koch PS, Zierow J, Klapproth K, Busch K, Olsavszky V, Leibing T, Demory A, Ulbrich F, Diett M, Singh S, Sticht C, Breitkopf-Heinlein K, Richter K, Karppinen SM, Pihlajaniemi T, Arnold B, Rodewald HR, Augustin HG, Schledzewski K, Goerdt S. GATA4-dependent organ-specific endothelial differentiation controls liver development and embryonic hematopoiesis. J Clin Invest 2017;127:1099–1114. - PMC - PubMed
    1. Poisson J, Lemoinne S, Boulanger C, Durand F, Moreau R, Valla D, Rautou PE. Liver sinusoidal endothelial cells: physiology and role in liver diseases. J Hepatol 2017;66:212–227. - PubMed
    1. Marrone G, Shah VH, Gracia-Sancho J. Sinusoidal communication in liver fibrosis and regeneration. J Hepatol 2016;65:608–617. - PMC - PubMed

Publication types