

Inhibition of Syk promotes chemical reprogramming of fibroblasts via metabolic rewiring and H2 S production
- PMID: 33909912
- PMCID: PMC8167362
- DOI: 10.15252/embj.2020106771
Inhibition of Syk promotes chemical reprogramming of fibroblasts via metabolic rewiring and H2 S production
Abstract
Chemical compounds have recently been introduced as alternative and non-integrating inducers of pluripotent stem cell fate. However, chemical reprogramming is hampered by low efficiency and the molecular mechanisms remain poorly characterized. Here, we show that inhibition of spleen tyrosine kinase (Syk) by R406 significantly promotes mouse chemical reprogramming. Mechanistically, R406 alleviates Syk / calcineurin (Cn) / nuclear factor of activated T cells (NFAT) signaling-mediated suppression of glycine, serine, and threonine metabolic genes and dependent metabolites. Syk inhibition upregulates glycine level and downstream transsulfuration cysteine biosynthesis, promoting cysteine metabolism and cellular hydrogen sulfide (H2 S) production. This metabolic rewiring decreased oxidative phosphorylation and ROS levels, enhancing chemical reprogramming. In sum, our study identifies Syk-Cn-NFAT signaling axis as a new barrier of chemical reprogramming and suggests metabolic rewiring and redox homeostasis as important opportunities for controlling cell fates.
Keywords: R406; Syk; chemical reprogramming; hydrogen sulfide; metabolism.
© 2021 The Authors.
Conflict of interest statement
The authors declare that they have no conflict of interest.
Figures
- A
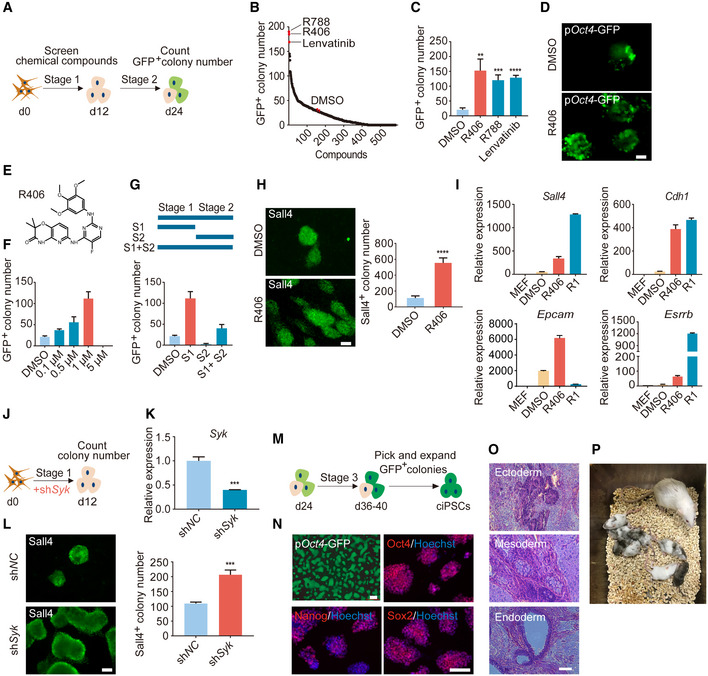
Schematic diagram depicting the procedure of compound screening during mouse chemical reprogramming.
- B
The chemical screening result evaluated by GFP+ colony number on d24.
- C
GFP+ colony number of samples treated with R406, R788, and Lenvatinib. n = 3.
- D
Fluorescence image of colonies with pOct4‐GFP expression after DMSO and R406 treatments. Scale bar, 100 μm.
- E–G
Concentration (F) and stage (G) test of R406 (E) during reprogramming. n = 3.
- H
Immunofluorescence of early pluripotent marker Sall4 in DMSO‐ and R406‐treated cells on d12. n = 5. Scale bar, 100 μm.
- I
RT–qPCR analysis of Sall4, Cdh1, Epcam, and Esrrb gene expression in MEFs, intermediate cells on d12 treated with DMSO and R406, and R1 (mESCs). n = 3.
- J
Diagram showing the procedure of shSyk virus infection at the early stage of reprogramming.
- K
RT–qPCR analysis of Syk expression in MEFs infected with shNC and shSyk viruses. n = 3.
- L
Immunofluorescence of Sall4 in reprogramming intermediates infected with shNC and shSyk. n = 3. Scale bar, 100 μm.
- M
Schematic diagram of the procedure of establishing ciPSC lines.
- N
ciPSCs express key pluripotent markers Oct4, Sox2, and Nanog. Scale bar, 100 μm.
- O
ciPSCs have developmental potentials to form teratomas containing tissues from all three germ layers. Scale bar, 100 μm.
- P
Chimeric mice were generated from ciPSCs.
- A
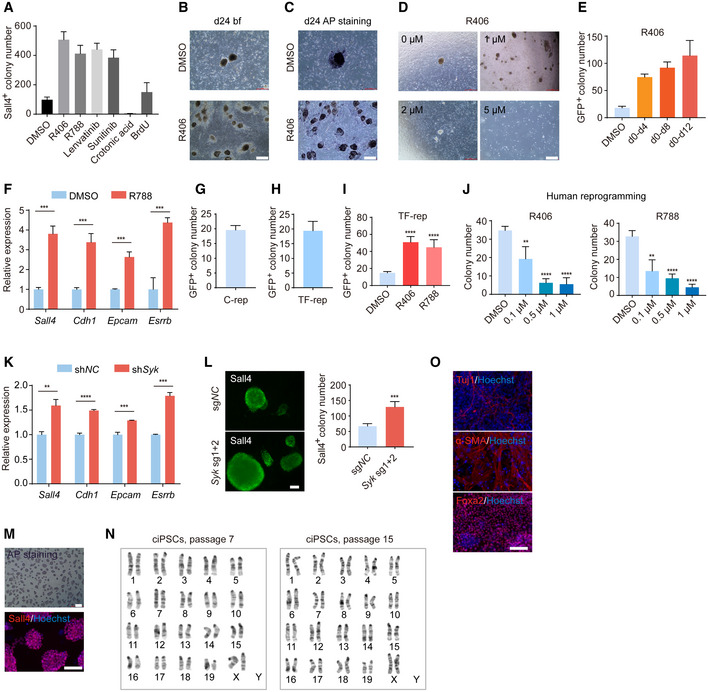
Sall4+ colony number on d12 after treatments with candidate small molecules. n = 5.
- B
Bright field (bf) of colonies on d24 after DMSO and R406 treatments. Scale bar, 500 μm.
- C
AP staining of colonies on d24 after DMSO and R406 treatments. Scale bar, 500 μm. AP staining was done after the data acquisition of bright field (B) from the same sample.
- D
The effects of R406 with different concentrations. Scale bar, 500 μm.
- E
The effects of R406 in different time windows. n = 3.
- F
RT–qPCR analysis of early pluripotent genes expression in reprogramming intermediates treated with DMSO and R788. n = 3.
- G, H
GFP+ colony number on d24 of chemical reprogramming (C‐rep) and d8 of TF‐induced reprogramming (TF‐rep). n = 5.
- I
The effects of R406 and R788 in TF‐induced reprogramming. n = 5.
- J
The effects of R406 and R788 in human reprogramming. n = 4.
- K
RT–qPCR analysis of pluripotent genes expression in reprogramming intermediates treated with shNC and shSyk. n = 3.
- L
Immunofluorescence of Sall4 in reprogramming intermediates infected with sgNC and Syk sgRNA viruses. n = 4. Scale bar, 100 μm.
- M–O
Characterization of ciPSCs: AP staining and Sall4 staining (M), karyotyping analysis of ciPSCs at passage 7 and passage 15 (N), and Tuj1, α‐SMA, and Foxa2 immunostaining after EB differentiation (O). Scale bar, 100 μm.
- A
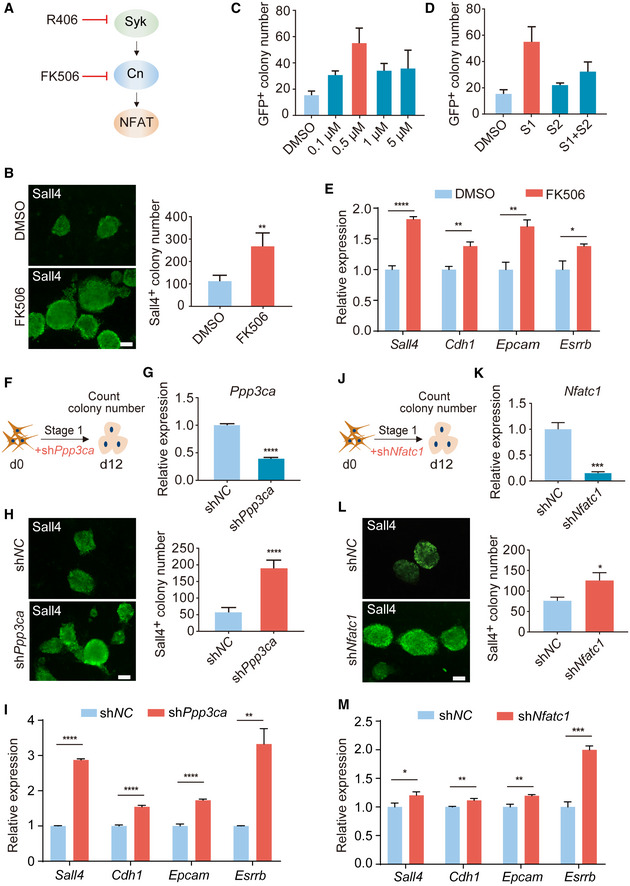
Schematic diagram showing Syk‐Cn‐NFAT pathway axis.
- B
Immunofluorescence of Sall4 in reprogramming intermediates treated with DMSO and FK506. n = 5. Scale bar, 100 μm.
- C, D
Concentration (C) and stage (D) test of FK506 during reprogramming. n = 3.
- E
RT–qPCR analysis of Sall4, Cdh1, Epcam, and Esrrb gene expression in reprogramming intermediates treated with DMSO and FK506. n = 3.
- F
Diagram showing the procedure of Ppp3ca knockdown at the early stage of reprogramming.
- G
RT–qPCR analysis of Ppp3ca expression in MEFs infected with shNC and shPpp3ca viruses. n = 3.
- H
Immunofluorescence of Sall4 in WT cells and Ppp3ca knockdown cells on d12. n = 6. Scale bar, 100 μm.
- I
RT–qPCR analysis of pluripotent genes expression in cells treated with shNC and shPpp3ca. n = 3.
- J
Diagram showing the procedure of shNfatc1 virus infection at the early stage of reprogramming.
- K
RT–qPCR analysis of Nfatc1 expression in MEFs infected with shNC and shNfatc1 viruses. n = 3.
- L
Immunofluorescence of Sall4 in WT cells and Nfatc1 knockdown cells on d12. n = 3. Scale bar, 100 μm.
- M
RT–qPCR analysis of pluripotent genes expression in cells treated with shNC and shNfatc1. n = 3.
- A
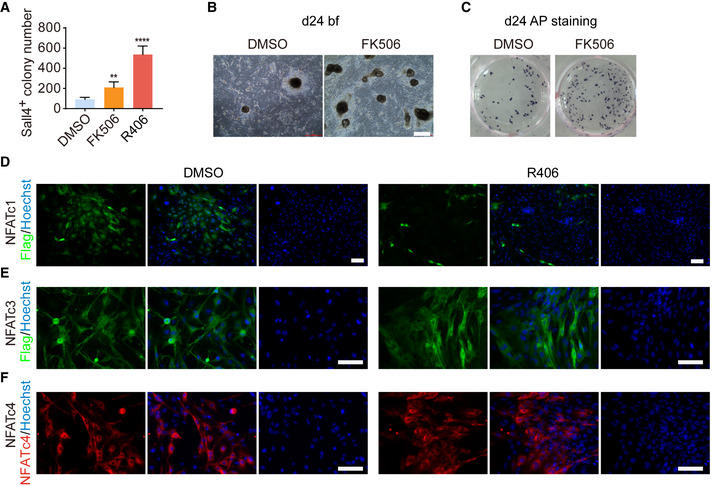
Sall4+ colony number on d12 after FK506 and R406 treatments. n = 5. Statistical significance was assessed by the two‐tailed Student’s t‐test, **P < 0.01, ****P < 0.0001.
- B
Bright field (bf) of colonies on d24 after DMSO and FK506 treatments. Scale bar, 500 μm.
- C
AP staining of cells on d24 after DMSO and FK506 treatments. AP staining was done after the data acquisition of bright field (B) from the same sample.
- D–F
Immunofluorescence of Flag in Flag‐NFATc1 or Flag‐NFATc3 overexpressed cells (D, E) and NFATc4 in NFATc4 overexpressed cells (F) on d4 of reprogramming. Only NFATc1 was detected in the nucleus and affected by R406 treatment. Scale bar, 100 μm.
- A
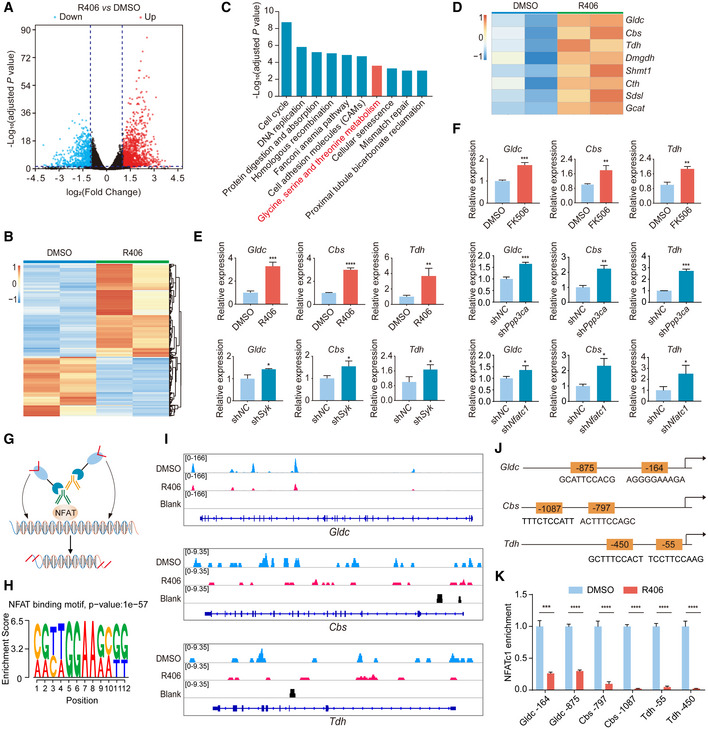
Volcano plot of differentially expressed genes (DEGs) in DMSO‐ and R406‐treated cells on d12. Red dots represent upregulated genes, and blue dots represent downregulated genes in R406‐treated cells. Dash lines represent twofold change, adjusted P‐value < 0.05. Statistical significance was assessed by the method described previously (Love et al, 2014).
- B
Heatmap showing the normalized expression (z score) of DEGs. Red indicates upregulated, whereas blue indicates downregulated genes.
- C
KEGG analysis of upregulated genes in R406‐treated reprogramming intermediates. Statistical significance was assessed by Benjamini–Hochberg method.
- D
Heatmap of RNA‐seq data for the normalized expression (z score) of genes involved in glycine, serine, and threonine metabolism. Red indicates upregulated genes, whereas blue indicates downregulated genes.
- E, F
RT–qPCR analysis of Gldc, Cbs, and Tdh expression in R406‐ and shSyk‐treated cells (E) and FK506‐, shPpp3ca‐, and shNfatc1‐treated cells (F) on d8. n = 3.
- G
Schematic of CUT&Tag experiments to map the genomic occupancy of NFATc1.
- H
NFAT motif enrichment and associated P‐value are shown. Statistical significance was assessed by the method described previously (Heinz et al, 2010).
- I
NFATc1 occupancy at Gldc, Cbs, and Tdh gene loci in cells treated with DMSO and R406 and no‐antibody control.
- J
The predicted NFAT‐binding sites at the promoters of Gldc, Cbs, and Tdh.
- K
qPCR assay of the binding of NFATc1 at Gldc, Cbs, and Tdh gene loci in cells treated with DMSO and R406. n = 3.
- A
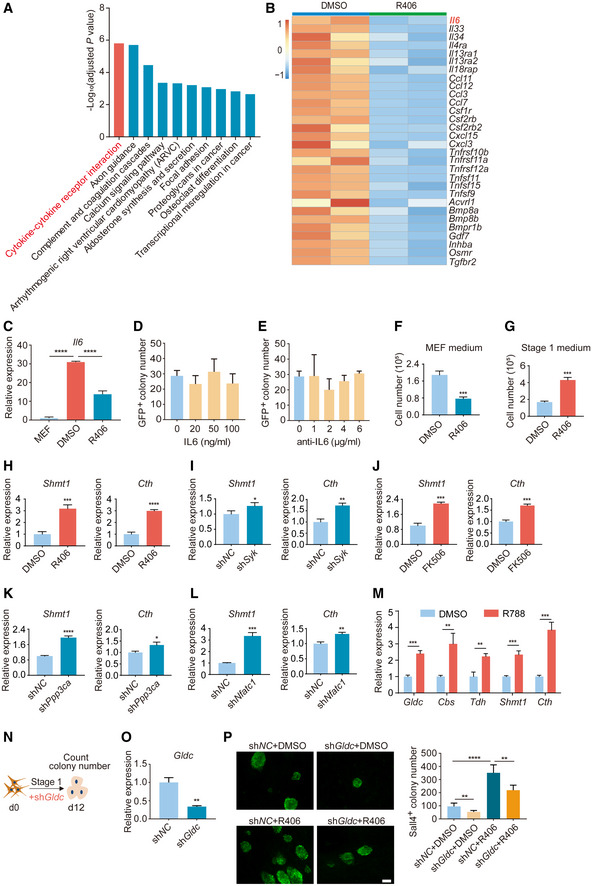
KEGG analysis of downregulated genes in R406‐treated reprogramming intermediates. Statistical significance was assessed by Benjamini–Hochberg method.
- B
Heatmap of RNA‐seq data for the normalized expression (z score) of genes involved in cytokine–cytokine receptor interaction (A).
- C
RT–qPCR analysis of Il6 expression in MEFs and reprogramming intermediates treated with DMSO and R406. n = 3.
- D
GFP+ colony number on d24 of samples treated with IL6 protein. n = 3.
- E
GFP+ colony number on d24 of samples treated with anti‐IL6 antibody. n = 3.
- F
Cell number on d4 of samples cultured in MEF medium supplemented with DMSO or R406. n = 3.
- G
Cell number on d4 of samples cultured in Stage 1 medium supplemented with DMSO or R406. n = 3.
- H–L
RT–qPCR analysis of Shmt1 and Cth gene expression after treatments of R406, shSyk, FK506, shPpp3ca, and shNfatc1 on d8 of reprogramming. n = 3.
- M
RT–qPCR analysis of Gldc, Cbs, Tdh, Shmt1, and Cth gene expression after R788 treatment on d8 of reprogramming. n = 3.
- N
Diagram showing the procedure of shGldc virus infection at the early stage of reprogramming.
- O
RT–qPCR analysis of Gldc expression in MEFs infected with shNC and shGldc viruses. n = 3.
- P
Immunofluorescence of Sall4 in shNC‐ and shGldc‐infected cells with and without R406 treatment on d12. n = 5. Scale bar, 100 μm.
- A
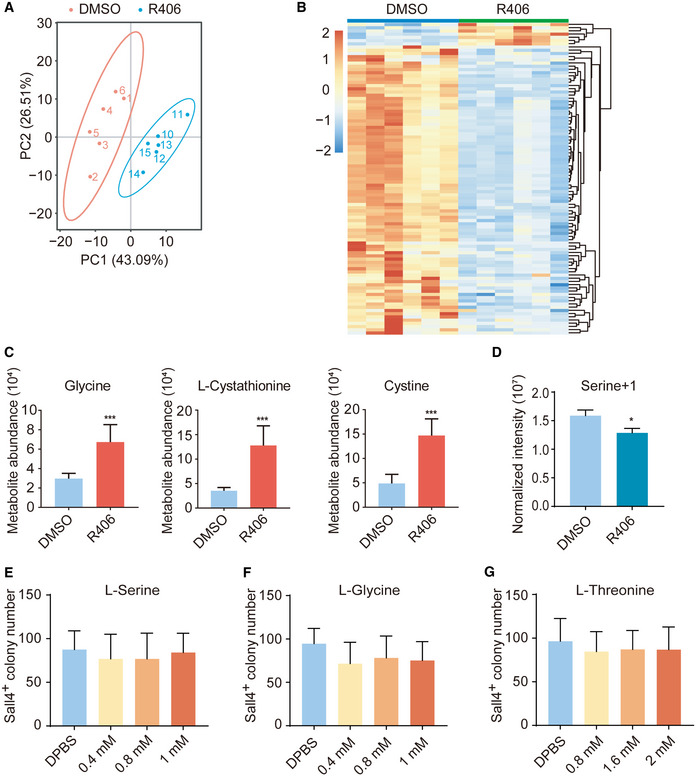
Principal component analysis of analyzed metabolites in DMSO‐treated samples and R406‐treated samples on d8. n = 6.
- B
Heatmap showing the normalized abundance (z score) of the differential metabolites between DMSO‐treated and R406‐treated samples. Red indicates upregulated, whereas blue indicates downregulated metabolites. n = 6.
- C
Abundance of R406‐upregulated metabolites in glycine, serine, and threonine metabolism in cells treated with DMSO and R406. n = 6.
- D
Stable isotope tracing mass spectrometry using 13C‐labeled Serine in cells treated with DMSO and R406. n = 3.
- E–G
Sall4+ colony number on d12 after treatments with
l ‐serine,l ‐glycine, andl ‐threonine. n = 5.
- A
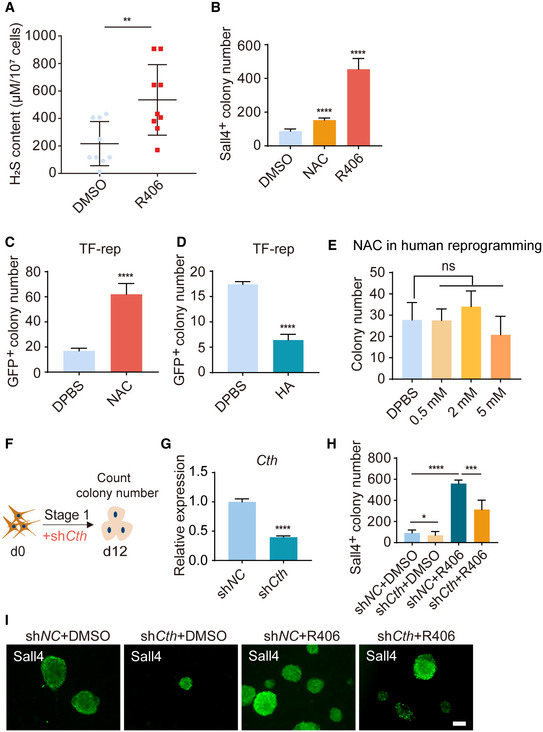
H2S levels in DMSO‐ and R406‐treated reprogramming intermediates by methylene blue method. n = 9.
- B
Sall4+ colony number on d12 after treatments of NAC and R406. n = 5.
- C, D
GFP+ colony number of samples treated with NAC (C) and HA (D) on d8 of TF‐induced reprogramming. n = 5.
- E
The effect of NAC in human reprogramming. n = 4.
- F
Diagram showing the procedure of shCth virus infection at the early stage of reprogramming.
- G
RT–qPCR analysis of Cth expression in MEFs infected with shNC and shCth viruses. n = 3.
- H, I
Immunofluorescence of Sall4 in shNC‐ and shCth‐infected cells with and without R406 treatment on d12. n = 5. Scale bar, 100 μm.
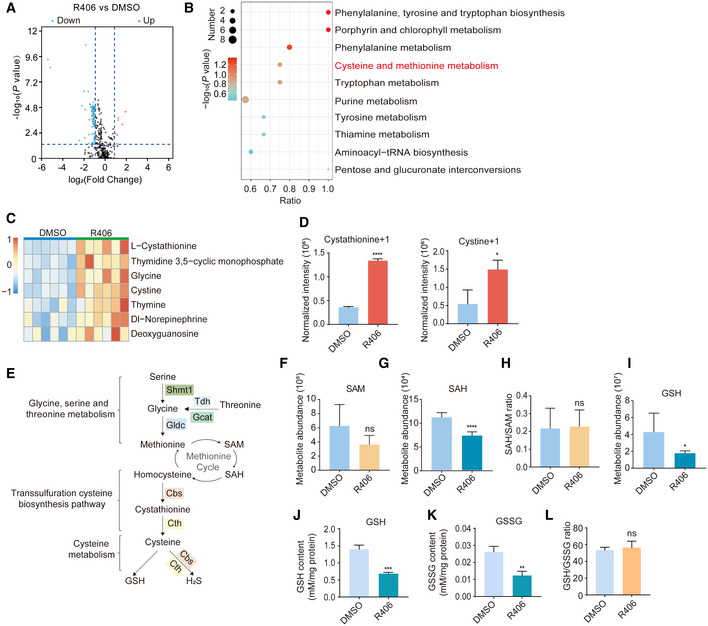
- A
Volcano plot showing the differential metabolites between DMSO‐treated and R406‐treated samples. Red dots represent significantly upregulated metabolites, and blue dots represent significantly downregulated metabolites in R406‐treated cells. Dash lines represent twofold change, P‐value < 0.05. Statistical significance was assessed by the method described previously (Love et al, 2014).
- B
KEGG analysis of these differential metabolites. Statistical significance was assessed by Benjamini–Hochberg method.
- C
Heatmap showing the normalized abundance (z score) of upregulated metabolites in R406‐treated cells. Red indicates upregulated metabolites, whereas blue indicates downregulated metabolites.
- D
Stable isotope tracing mass spectrometry using 13C‐labeled serine in cells treated with DMSO and R406. n = 3.
- E
Schematic diagram showing glycine, serine, and threonine metabolism and downstream metabolic pathways.
- F–I
Metabolite abundance of SAM, SAH, and GSH (F, G, and I), and the SAH/SAM ratio (H) in samples treated with DMSO and R406. n = 6.
- J–L
The GSH and GSSG levels (J, K) and the ratio of GSH/GSSG (L) in samples treated with DMSO and R406. n = 3.
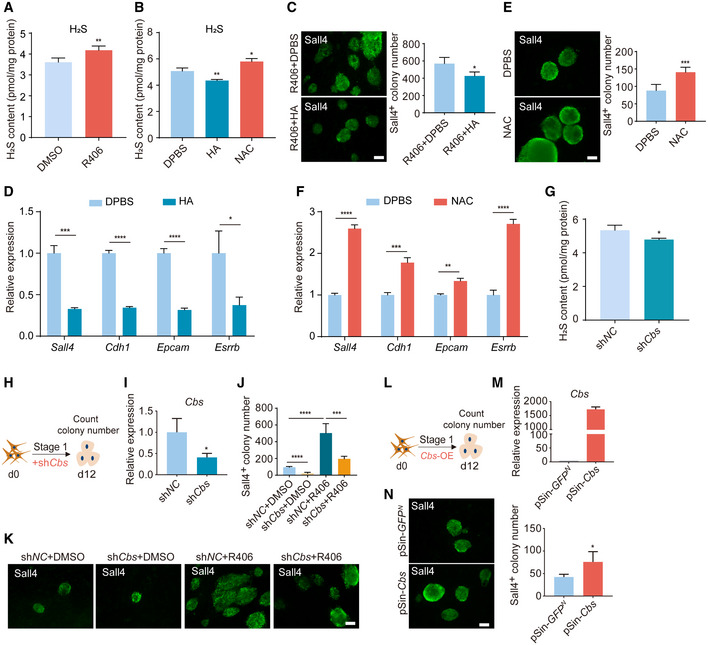
- A
H2S levels in DMSO‐ and R406‐treated reprogramming intermediates detected by monobromobimane method. n = 4.
- B
H2S levels in reprogramming intermediates treated with DPBS, HA, and NAC. n = 3.
- C
Immunofluorescence of Sall4 in reprogramming intermediates treated by R406 + HA and R406 + DPBS on d12. n = 3. Scale bar, 100 μm.
- D
RT–qPCR analysis of Sall4, Cdh1, Epcam, and Esrrb gene expression in DPBS‐ and HA‐treated cells on d12. n = 3.
- E
Immunofluorescence of Sall4 in NAC‐ and DPBS‐treated cells on d12. n = 5. Scale bar, 100 μm.
- F
RT–qPCR analysis of Sall4, Cdh1, Epcam, and Esrrb gene expression in DPBS‐ and NAC‐treated cells on d12. n = 3.
- G
H2S levels in reprogramming intermediates treated with shNC and shCbs. n = 3.
- H
Diagram showing the procedure of reprogramming infected with shRNA for Cbs.
- I
RT–qPCR analysis of Cbs expression in MEFs infected with shNC and shCbs. n = 3.
- J, K
Immunofluorescence of Sall4 in shNC‐ and shCbs‐infected cells with and without R406 treatment on d12. n = 5. Scale bar, 100 μm.
- L
Diagram showing the procedure of reprogramming infected with Cbs‐OE (pSin‐Cbs) virus.
- M
RT–qPCR analysis of Cbs expression in MEFs infected with pSin‐GFPN and pSin‐Cbs viruses. n = 3.
- N
Immunofluorescence of Sall4 in WT cells and Cbs overexpressing cells on d12. n = 4. Scale bar, 100 μm.
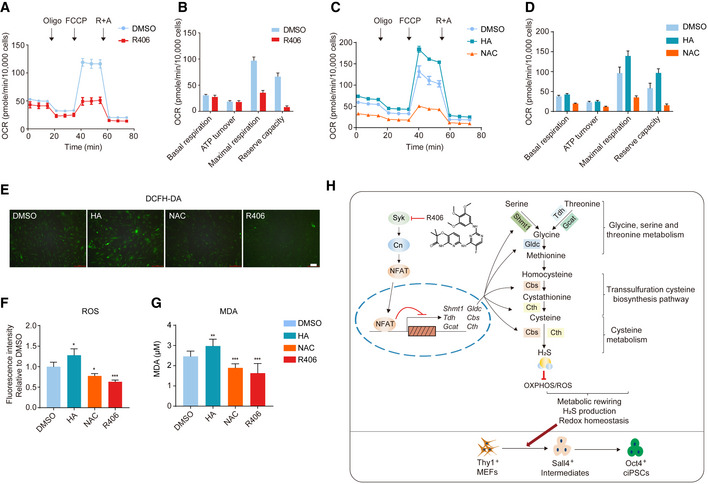
- A–D
Quantification of oxygen consumption rate (OCR) of reprogramming intermediates treated with small molecules (A, C) and the indicated OCR parameters (B, D). n = 9.
- E, F
Fluorescence images of DCFH‐DA staining for ROS levels in cells treated with DMSO, HA, NAC, and R406 on d12 (E) and the quantification of the ROS levels (F). n = 4. Scale bar, 100 μm.
- G
MDA quantification in cells treated with DMSO, HA, NAC, and R406 on d12. n = 9.
- H
A summary diagram of this study.
Similar articles
-
R406 elicits anti-Warburg effect via Syk-dependent and -independent mechanisms to trigger apoptosis in glioma stem cells.Cell Death Dis. 2019 May 1;10(5):358. doi: 10.1038/s41419-019-1587-0. Cell Death Dis. 2019. PMID: 31043589 Free PMC article.
-
SYK inhibition targets acute myeloid leukemia stem cells by blocking their oxidative metabolism.Cell Death Dis. 2020 Nov 6;11(11):956. doi: 10.1038/s41419-020-03156-8. Cell Death Dis. 2020. PMID: 33159047 Free PMC article.
-
Inhibition of spleen tyrosine kinase signaling protects against acute lung injury through blockade of NADPH oxidase and IL-17A in neutrophils and γδ T cells respectively in mice.Int Immunopharmacol. 2019 Mar;68:39-47. doi: 10.1016/j.intimp.2018.12.062. Epub 2019 Jan 2. Int Immunopharmacol. 2019. PMID: 30611000
-
Therapeutic inhibition of spleen tyrosine kinase in inflammatory macrophages using PLGA nanoparticles for the treatment of non-alcoholic steatohepatitis.J Control Release. 2018 Oct 28;288:227-238. doi: 10.1016/j.jconrel.2018.09.004. Epub 2018 Sep 13. J Control Release. 2018. PMID: 30219279
-
The Syk inhibitor R406 is a modulator of P-glycoprotein (ABCB1)-mediated multidrug resistance.PLoS One. 2019 Jan 22;14(1):e0210879. doi: 10.1371/journal.pone.0210879. eCollection 2019. PLoS One. 2019. PMID: 30668583 Free PMC article.
Cited by
-
Human dermal fibroblast subpopulations and epithelial mesenchymal transition signals in hidradenitis suppurativa tunnels are normalized by spleen tyrosine kinase antagonism in vivo.PLoS One. 2023 Nov 3;18(11):e0282763. doi: 10.1371/journal.pone.0282763. eCollection 2023. PLoS One. 2023. PMID: 37922232 Free PMC article.
-
Harnessing endogenous transcription factors directly by small molecules for chemically induced pluripotency inception.Proc Natl Acad Sci U S A. 2023 May 23;120(21):e2215155120. doi: 10.1073/pnas.2215155120. Epub 2023 May 16. Proc Natl Acad Sci U S A. 2023. PMID: 37192170 Free PMC article.
-
Chemical-based epigenetic reprogramming to advance pluripotency and totipotency.Nat Chem Biol. 2025 May;21(5):635-647. doi: 10.1038/s41589-025-01874-8. Epub 2025 Apr 18. Nat Chem Biol. 2025. PMID: 40251434 Review.
-
USP9X-mediated REV1 deubiquitination promotes lung cancer radioresistance via the action of REV1 as a Rad18 molecular scaffold for cystathionine γ-lyase.J Biomed Sci. 2024 May 28;31(1):55. doi: 10.1186/s12929-024-01044-3. J Biomed Sci. 2024. PMID: 38802791 Free PMC article.
-
Small-molecule screening identifies Syk kinase inhibition and rutaecarpine as modulators of macrophage training and SARS-CoV-2 infection.Cell Rep. 2022 Oct 4;41(1):111441. doi: 10.1016/j.celrep.2022.111441. Epub 2022 Sep 15. Cell Rep. 2022. PMID: 36179680 Free PMC article.
References
-
- Asimakopoulou A, Panopoulos P, Chasapis CT, Coletta C, Zhou Z, Cirino G, Giannis A, Szabo C, Spyroulias GA, Papapetropoulos A (2013) Selectivity of commonly used pharmacological inhibitors for cystathionine beta synthase (CBS) and cystathionine gamma lyase (CSE). Br J Pharmacol 169: 922–932 - PMC - PubMed
-
- Baksh S, Widlund HR, Frazer‐Abel AA, Du J, Fosmire S, Fisher DE, DeCaprio JA, Modiano JF, Burakoff SJ (2002) NFATc2‐mediated repression of cyclin‐dependent kinase 4 expression. Mol Cell 10: 1071–1081 - PubMed
-
- Cao S, Yu S, Li D, Ye J, Yang X, Li C, Wang X, Mai Y, Qin Y, Wu J et al (2018) Chromatin accessibility dynamics during chemical induction of pluripotency. Cell Stem Cell 22: 529–542.e525 - PubMed
-
- Cheng Z‐L, Zhang M‐L, Lin H‐P, Gao C, Song J‐B, Zheng Z, Li L, Zhang Y, Shen X, Zhang H et al (2020) The Zscan4‐Tet2 transcription nexus regulates metabolic rewiring and enhances proteostasis to promote reprogramming. Cell Rep 32: 107877 - PubMed
Publication types
MeSH terms
Substances
LinkOut - more resources
Full Text Sources
Other Literature Sources
Molecular Biology Databases
Miscellaneous
