. 2021 May 6;81(9):2031-2040.e8.
doi: 10.1016/j.molcel.2021.03.020. Epub 2021 Apr 27.

Non-canonical autophagy drives alternative ATG8 conjugation to phosphatidylserine

Affiliations

Non-canonical autophagy drives alternative ATG8 conjugation to phosphatidylserine

Joanne Durgan et al. Mol Cell. .

Abstract

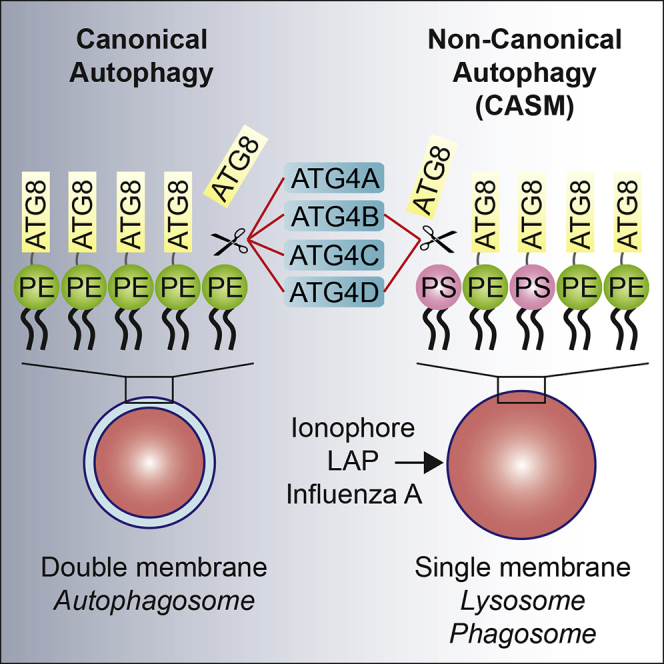
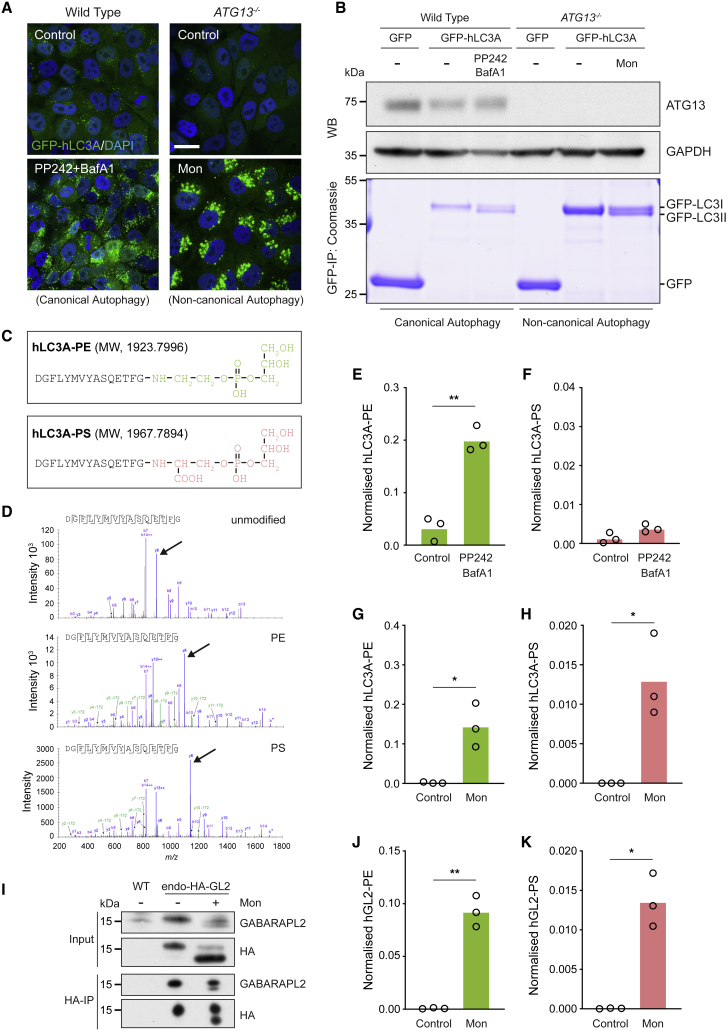
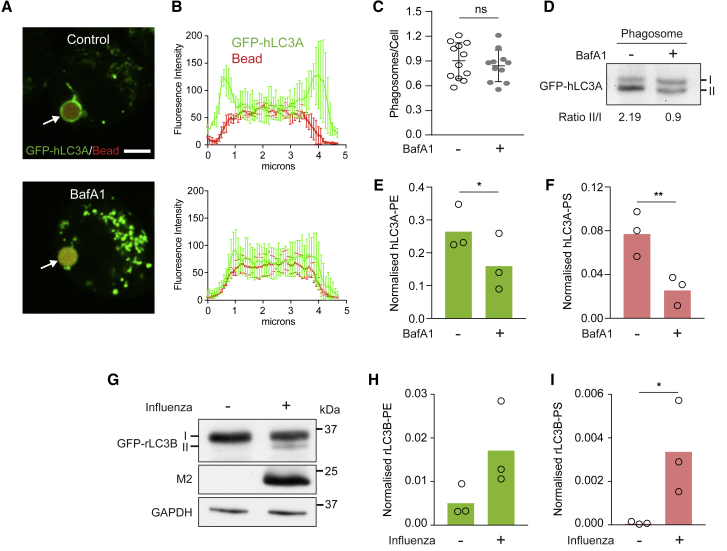
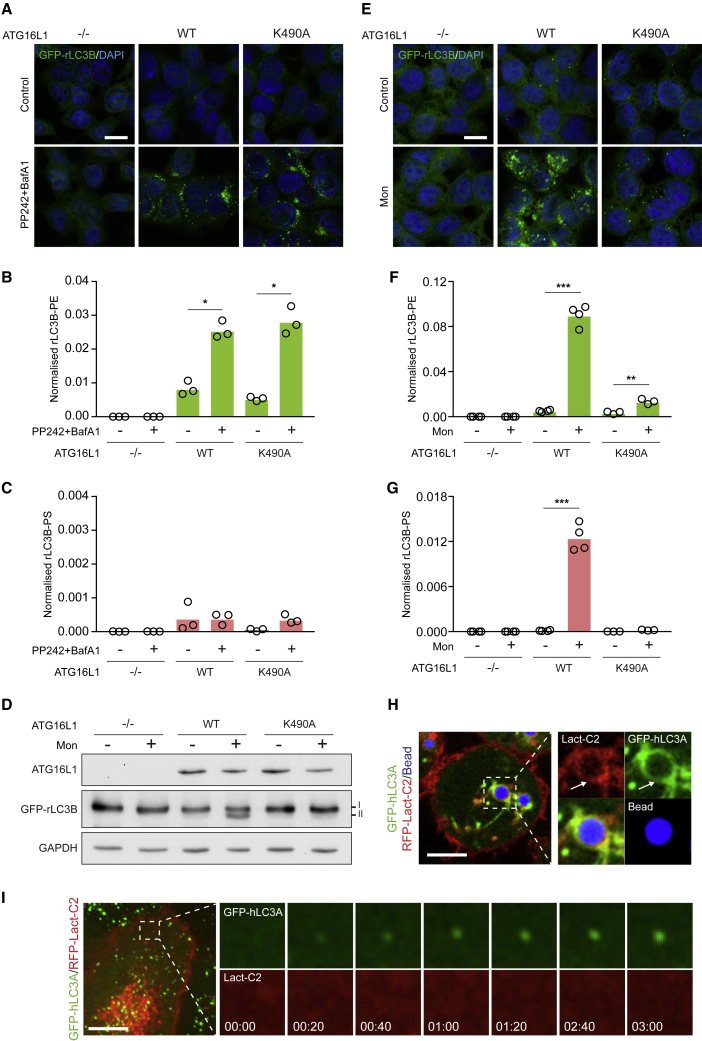
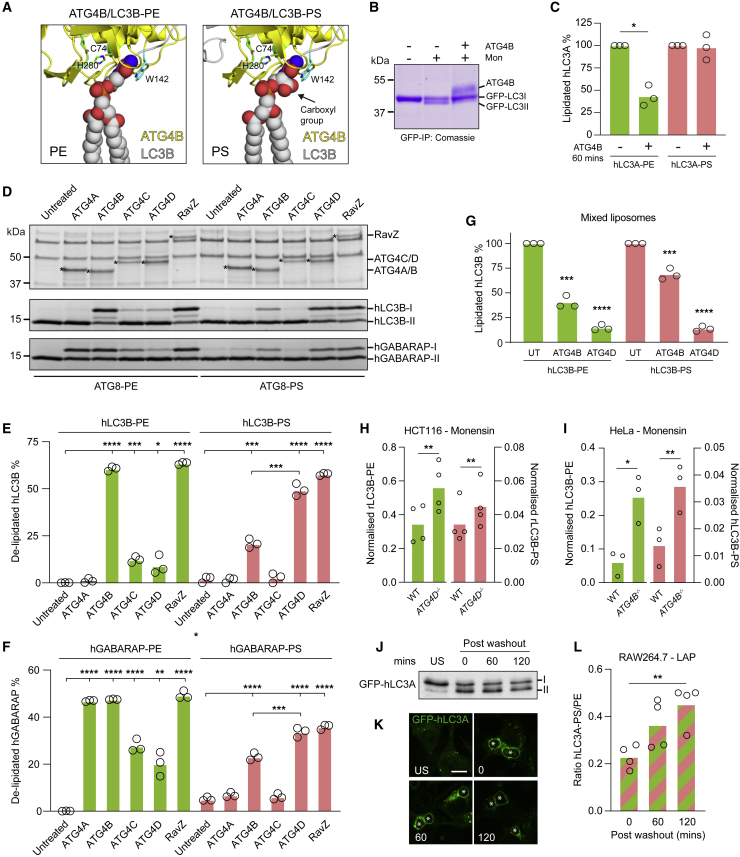
Autophagy is a fundamental catabolic process that uses a unique post-translational modification, the conjugation of ATG8 protein to phosphatidylethanolamine (PE). ATG8 lipidation also occurs during non-canonical autophagy, a parallel pathway involving conjugation of ATG8 to single membranes (CASM) at endolysosomal compartments, with key functions in immunity, vision, and neurobiology. It is widely assumed that CASM involves the same conjugation of ATG8 to PE, but this has not been formally tested. Here, we discover that all ATG8s can also undergo alternative lipidation to phosphatidylserine (PS) during CASM, induced pharmacologically, by LC3-associated phagocytosis or influenza A virus infection, in mammalian cells. Importantly, ATG8-PS and ATG8-PE adducts are differentially delipidated by the ATG4 family and bear different cellular dynamics, indicating significant molecular distinctions. These results provide important insights into autophagy signaling, revealing an alternative form of the hallmark ATG8 lipidation event. Furthermore, ATG8-PS provides a specific "molecular signature" for the non-canonical autophagy pathway.

Keywords: ATG4; ATG8; LC3-associated phagocytosis; non-canonical autophagy; phosphatidylserine.


Conflict of interest statement

Declaration of interests The authors declare no competing interests.

Figures

None
Graphical abstract
Figure 1
Figure 1
Pharmacological activation of non-canonical autophagy promotes ATG8-PS lipidation in cells (A) Confocal images of WT and ATG13−/− MCF10A cells upon activation of canonical (PP242/BafA1) and non-canonical autophagy (monensin). Scale bar: 20 μm. (B) Coomassie staining of GFP-IPs and western blotting of cells treated as in (A). (C) C-terminal peptides of hLC3A conjugated to the PE or PS headgroup. Predicted molecular weights (MWs) are indicated. (D) Collision-induced dissociation (CID) mass spectra of unmodified, PE-modified, or PS-modified hLC3A C-terminal peptides. Monoisotopic mass shifts: 197.05, glycerophosphoethanolamine (from PE); 241.04, glycerophosphoserine (from PS); arrowheads denote y8 ion peaks as examples. (E–H) Normalized mass spectrometry analysis of hLC3A-PE and hLC3A-PS in WT (E and F) and ATG13−/− (G and H) cells. (I–K) Analysis of endogenous GABARAPL2 in HeLa cells by western blotting and mass spectrometry. Data represent means from three independent experiments. p < 0.03 and ∗∗p < 0.002, paired t test. See also Figure S2.
Figure 2
Figure 2
ATG8-PS lipidation occurs during LC3-associated phagocytosis (LAP) and influenza A virus (IAV) infection (A) Confocal images of J774A.1 macrophage treated with IgG-coated beads to induce LAP −/+ BafA1. Scale bar: 5 μm. (B) Signal intensity profile of phagosomal GFP-hLC3A. Data represent mean ± SD from three phagosomes. (C) Quantification of phagocytosis. Data represent means ± SD from more than ten fields of view. (D) Western blot of GFP-hLC3A from phagosome fraction with ratio of LC3II/LC3I. (E and F) Normalized mass spectrometry analysis of hLC3A-PE and hLC3A-PS from phagosome fractions. Data represent means from three independent experiments. p < 0.03 and ∗∗p < 0.002, paired t test. (G) HCT116 cells infected with influenza A virus (IAV) PR8 and analyzed using western blot. (H and I) Normalized mass spectrometry analysis of rLC3B-PE and rLC3B-PS −/+ IAV infection. Data represent means from three independent experiments. p < 0.03, ratio paired t test.
Figure 3
Figure 3
The ATG16L1 WD40 domain supports alternative ATG8 lipidation, which occurs at PS-enriched membranes (A) Confocal images of HCT116 ATG16L1−/− cells, re-expressing ATG16L1 WT or K490A, stimulated for canonical autophagy (PP242/BafA1). Scale bar: 20 μm. (B and C) Normalized mass spectrometry analysis of rLC3B-PE and rLC3B-PS in cells treated as in (A). (D) Western blot analysis of HCT116 cell panel, stimulated −/+ monensin. (E) Confocal images of HCT116 cells treated as in (D). (F and G) Normalized mass spectrometry analysis of rLC3B-PE and rLC3B-PS in cells treated as in (D). (H) Confocal images of GFP-hLC3A and RFP-Lact-C2 in J774.A1 cells during LAP. Scale bar: 5 μm; arrows denote a GFP-hLC3A-positive phagosome. (I) Live confocal imaging of MCF10A cells, expressing GFP-hLC3A and RFP-Lact-C2, treated with PP242. Scale bar: 5 μm. Cropped time-lapse frames, min:sec. Data represent means from three or four independent experiments. p < 0.03, ∗∗p < 0.002, and ∗∗∗p < 0.0002, paired t test. See also Figure S3.
Figure 4
Figure 4
ATG8-PS and ATG8-PE undergo differential delipidation by the ATG4 family (A) Molecular modeling of LC3B-PE and LC3B-PS in complex with ATG4B (on the basis of PDB: 2Z0D), with critical catalytic residues marked. (B) Coomassie staining of GFP-hLC3A IPs from MCF10A ATG13−/− cells −/+ monensin, incubated −/+ ATG4B for 60 min. (C) Mass spectrometry analysis of hLC3A-PE and hLC3A-PS from cells treated as in (B). Data represent three independent experiments with means normalized to time 0. p < 0.01, paired t test. (D) PE or PS liposome-based delipidation assays with purified ATG4s or RavZ. Conjugated hLC3B or hGABARAP was incubated with ATG4A/B/C/D/RavZ (asterisk) for 60 min and analyzed using SDS-PAGE/Coomassie. (E and F) Densitometry analysis of (D). Data represent means from three independent experiments p < 0.03, ∗∗p < 0.002, ∗∗∗p < 0.0002, and ∗∗∗∗p < 0.0001, unpaired t test. (G) Mass spectrometry analysis of hLC3B conjugation on mixed liposomes, incubated with ATG4B or ATG4D for 60 min. Data represent means normalized to untreated controls from three independent experiments. ∗∗∗p < 0.0002 and ∗∗∗∗p < 0.0001, unpaired t test. (H and I) Normalized mass spectrometry analysis of GFP-rLC3B from monensin treated WT and ATG4D−/− HCT116 cells (H) and of GFP-hLC3BG120 from monensin treated WT and ATG4B−/− HeLa cells (I). Data represent means from three or four independent experiments. p < 0.03 and ∗∗p < 0.002, paired t test. (J) Western blot analysis of RAW264.7 cells expressing GFP-hLC3A treated −/+ zymosan for 25 min, followed by washout 0–120 min post-LAP. (K) Confocal images of cells treated as in (J). Scale bar: 5 μm. Asterisks denote phagosomes. (L) Ratios of hLC3A-PS/PE measured by mass spectrometry from cells treated as in (J). Data represent means from four independent experiments. ∗∗p < 0.002, unpaired t test. See also Figure S4.

Comment in

References

    1. Acheson J.F., Derewenda Z.S., Zimmer J. Architecture of the cellulose synthase outer membrane channel and its association with the periplasmic TPR domain. Structure. 2019;27:1855–1861.e3. - PMC - PubMed
    1. Agrotis A., Pengo N., Burden J.J., Ketteler R. Redundancy of human ATG4 protease isoforms in autophagy and LC3/GABARAP processing revealed in cells. Autophagy. 2019;15:976–997. - PMC - PubMed
    1. Betin V.M., Lane J.D. Caspase cleavage of Atg4D stimulates GABARAP-L1 processing and triggers mitochondrial targeting and apoptosis. J. Cell Sci. 2009;122:2554–2566. - PMC - PubMed
    1. Choy A., Dancourt J., Mugo B., O’Connor T.J., Isberg R.R., Melia T.J., Roy C.R. The Legionella effector RavZ inhibits host autophagy through irreversible Atg8 deconjugation. Science. 2012;338:1072–1076. - PMC - PubMed
    1. Cunha L.D., Yang M., Carter R., Guy C., Harris L., Crawford J.C., Quarato G., Boada-Romero E., Kalkavan H., Johnson M.D.L. LC3-associated phagocytosis in myeloid cells promotes tumor immune tolerance. Cell. 2018;175:429–441.e16. - PMC - PubMed

Publication types

MeSH terms

LinkOut - more resources