. 2021 Apr 27;35(4):109024.
doi: 10.1016/j.celrep.2021.109024.

Inhibition of mitochondrial translation suppresses glioblastoma stem cell growth

Affiliations

Inhibition of mitochondrial translation suppresses glioblastoma stem cell growth

Denise Sighel et al. Cell Rep. .

Abstract

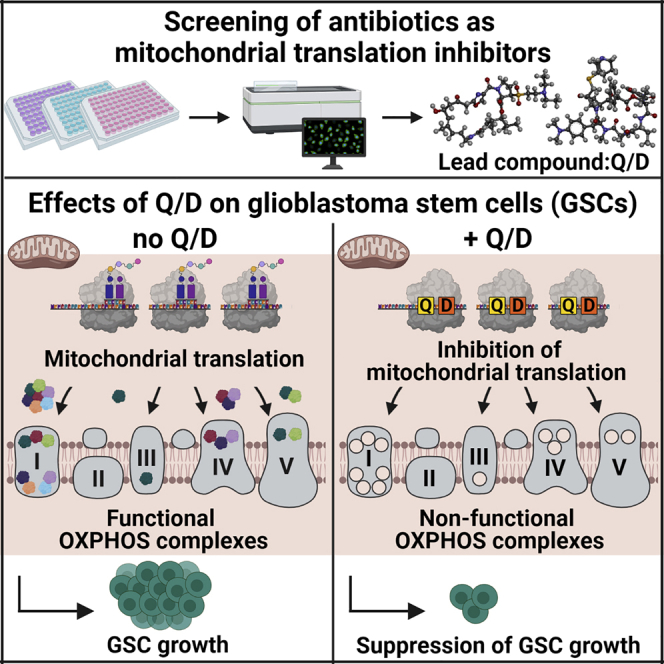
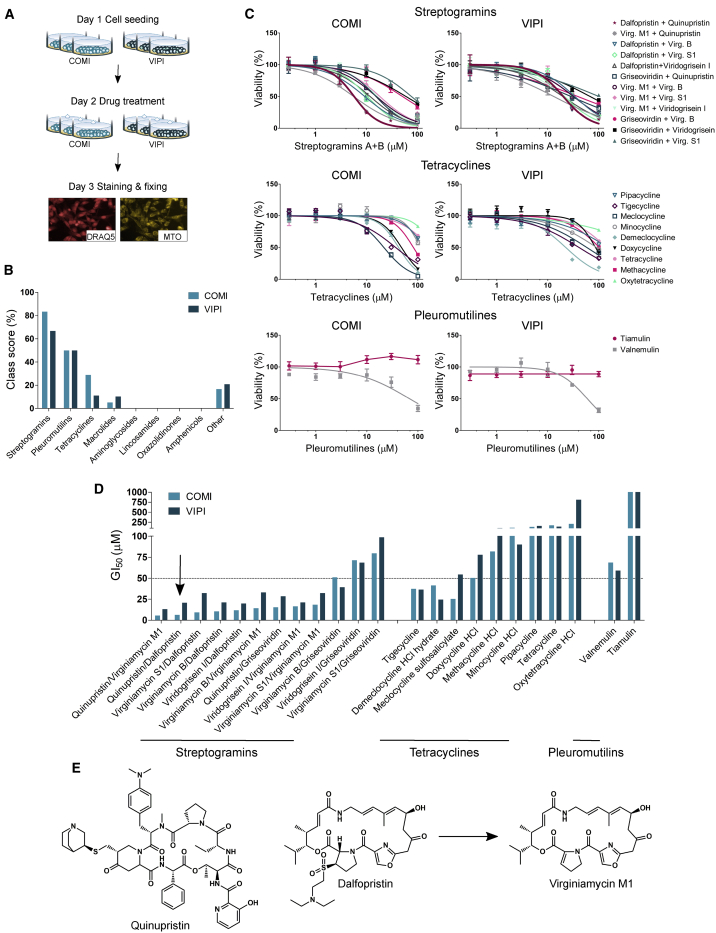
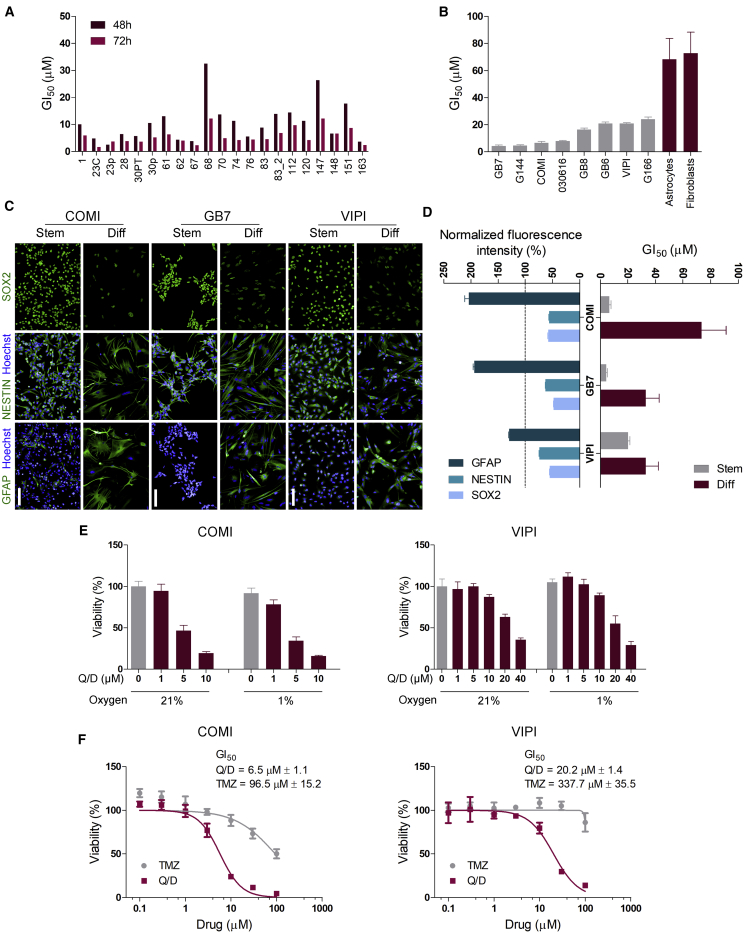
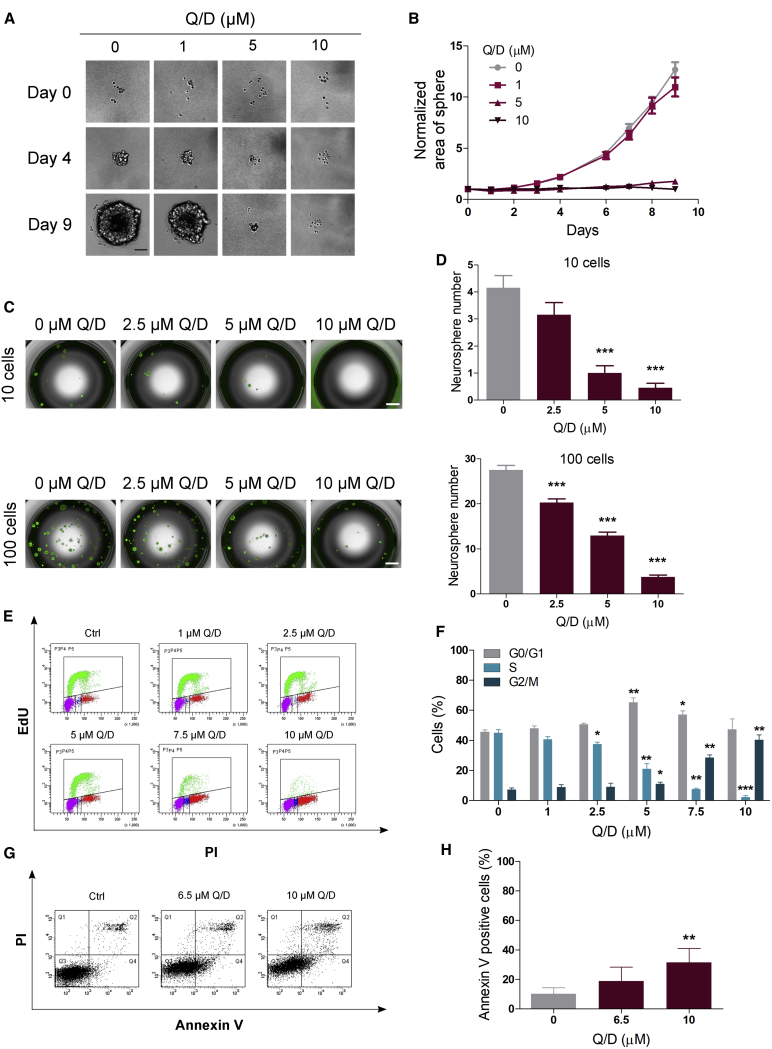
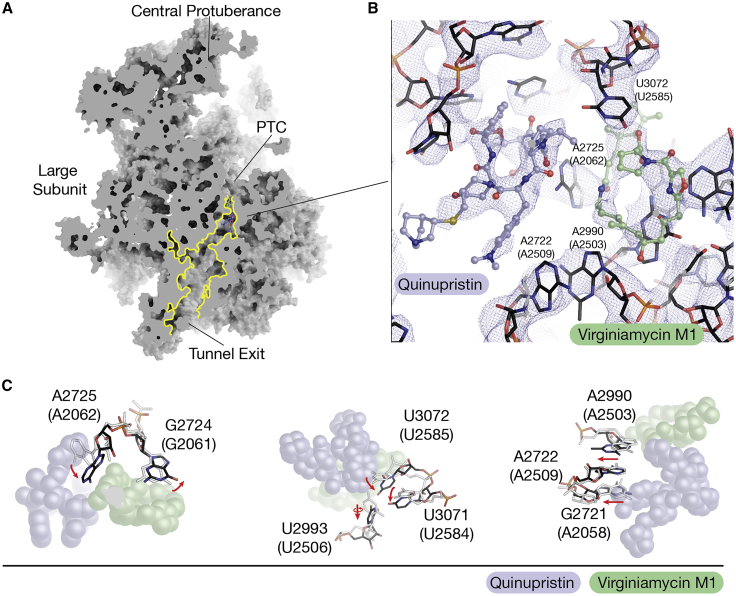
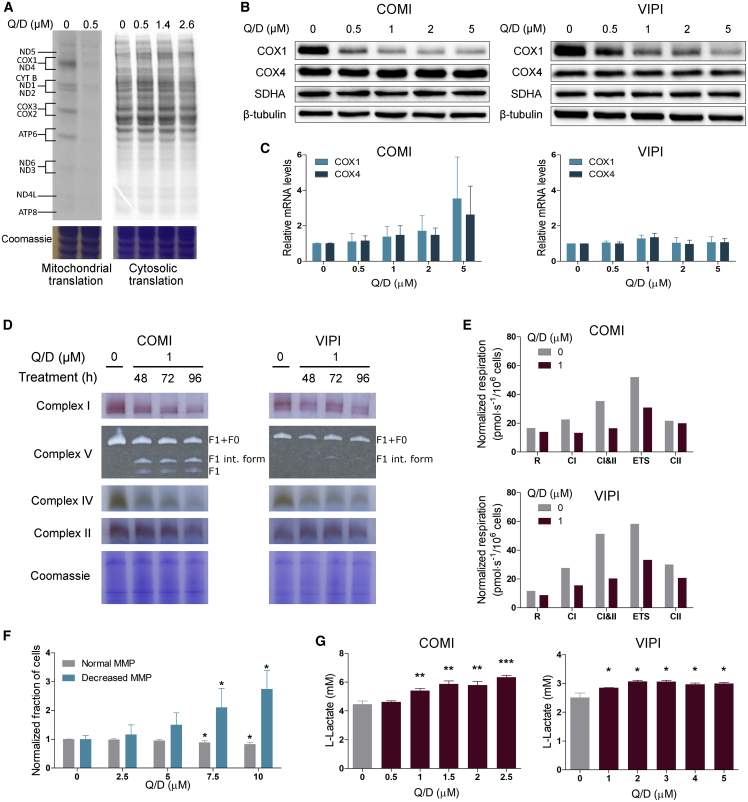
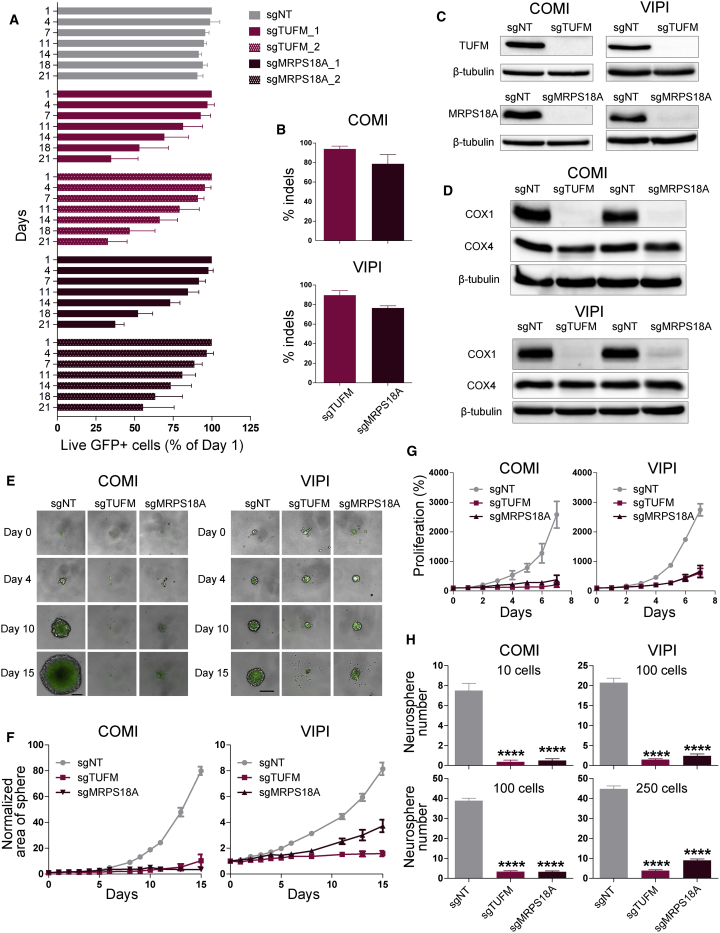
Glioblastoma stem cells (GSCs) resist current glioblastoma (GBM) therapies. GSCs rely highly on oxidative phosphorylation (OXPHOS), whose function requires mitochondrial translation. Here we explore the therapeutic potential of targeting mitochondrial translation and report the results of high-content screening with putative blockers of mitochondrial ribosomes. We identify the bacterial antibiotic quinupristin/dalfopristin (Q/D) as an effective suppressor of GSC growth. Q/D also decreases the clonogenicity of GSCs in vitro, consequently dysregulating the cell cycle and inducing apoptosis. Cryoelectron microscopy (cryo-EM) reveals that Q/D binds to the large mitoribosomal subunit, inhibiting mitochondrial protein synthesis and functionally dysregulating OXPHOS complexes. These data suggest that targeting mitochondrial translation could be explored to therapeutically suppress GSC growth in GBM and that Q/D could potentially be repurposed for cancer treatment.

Keywords: OXPHOS; cryo-EM; dalfopristin; drug repurposing; glioblastoma; glioblastoma stem cells; high-content screening; mitochondrial translation; mitoribosome; quinupristin.


Conflict of interest statement

Declaration of interests D.S., I.M., A.M., and A.Q. have applied for protection of intellectual property related to the results in the manuscript and to Q/D analogs in cancer therapy (Italian patent number 102020000012601).

Figures

None
Graphical abstract
Figure 1
Figure 1
Q/D is the most effective prospective mitochondrial translation inhibitor in GSCs (A) An outline of the screening workflow. Each treatment was performed in a technical triplicate. (B) Identification of hit classes based on class score calculation. (C) Representative dose-response curves for all tested compounds belonging to the three hit classes validated in COMI and VIPI cells; n = 4 technical replicates, mean ± SD. (D) The GI50 values of the tested compounds. (E) The chemical structures of the lead compound Q/D (30:70 w/w) and virginiamycin M1, the product of dalfopristin hydrolysis. See also Figures S1 and S2 and Tables S1–S3.
Figure 2
Figure 2
Q/D selectively inhibits growth of GSCs at clinically relevant concentrations, is effective under hypoxic conditions, and is more potent than TMZ (A) GI50 values of a panel of 21 GSC lines derived from 18 tumor samples 48 and 72 h after Q/D treatment; n = 4 technical replicates. (B) Q/D GI50 values for 14 GSC lines compared with Q/D GI50 values for astrocytes derived from human fetal neural stem cells (CB660, HNPC#13, and U3), human lung fibroblasts (MRC5), and human skin fibroblast (Hs68); n = 3 biological replicates, mean ± SD. (C) Representative immunofluorescence images for SOX2, NESTIN, and GFAP staining of COMI, GB7, and VIPI cells grown under stemness (Stem) and differentiation (Diff) conditions. Scale bar, 100 μm. (D) Quantification of the fluorescence intensity of SOX2, NESTIN, and GFAP immunostaining (left) and Q/D GI50 values for COMI, GB7, and VIPI cells grown under Stem and Diff conditions (right). For immunostaining quantification, n = 6,000 objects for stem cells and n = 1,000 objects for differentiated cells; mean ± SEM. Values for differentiated cells were normalized to those of stem cells (dashed line). The GI50 values were calculated using 4–7 biological replicates; mean ± SD. (E) Viability of COMI and VIPI cells grown under normal and hypoxic conditions with different doses of Q/D; n = 4 technical replicates, mean ± SD. Shown are representative results of 3 biological replicates. (F) Representative dose-response curves to Q/D and temozolomide (TMZ) for COMI and VIPI cells; n = 3 biological replicates, mean ± SD. See also Tables S4 and S5.
Figure 3
Figure 3
Q/D decreases clonogenicity, dysregulates the cell cycle, and promotes apoptosis (A) Effects of Q/D treatment on COMI cells grown in suspension. Shown are example images from days 0, 4, and 9. Scale bar, 100 μm. (B) Sphere area measured over the course of the 9-day experiment. The data were normalized to day 0. n = 30 technical replicates, mean ± SEM. One representative experiment is shown; n = 3 biological replicates. (C) Representative images of the gliomasphere formation assay; scale bar, 1,000 μm. (D) Quantification of the number of spheres larger than 100 μm; n = 20 technical replicates, mean ± SEM. ∗∗∗p < 0.001, unpaired two-tailed t test. One representative result is shown; n = 3 biological replicates. (E) Representative fluorescence-activated cell sorting (FACS) analysis of the effects of Q/D on the cell cycle in COMI cells assayed using EdU incorporation and PI staining. (F) Quantification of the percentage of cells in each cell cycle phase; n = 3 biological replicates, mean ± SD. p < 0.05, ∗∗p < 0.01, ∗∗∗p < 0.001, unpaired two-tailed t test. (G) Representative FACS analysis of apoptosis upon treatment with Q/D in COMI cells, as evaluated by Annexin V and PI staining. (H) Quantification of the percentage of Annexin V-positive cells; n = 6 biological replicates, mean ± SD. ∗∗p < 0.01, unpaired two-tailed t test. See also Figure S3.
Figure 4
Figure 4
Cryo-EM of the mitoribosome from Q/D-treated cells (A) A model of the mitoribosomal large subunit with quinupristin and virginiamycin M1 (the hydrolysis product of dalfopristin). The two compounds are found in the entrance of the exit tunnel and the peptidyl transferase center (PTC). (B) View of the cryo-EM density at an overall resolution of 3.9 Å around quinupristin (purple) and virginiamycin M1 (green). The two compounds interact with the surrounding rRNA. (C) Comparison of the human mitoribosomal RNA when bound to quinupristin and virginiamycin M1 (black) and when unbound (PDB: 3J9M; light gray). Red arrows indicate rRNA movement to accommodate the molecules. See also Figure S4 and Table S6.
Figure 5
Figure 5
Q/D inhibits mitochondrial translation and negatively affects OXPHOS functionality (A) 35S metabolic labeling assay of mitochondrial (left) and cytosolic (right) translation on COMI cells after 24-h treatment with Q/D. One representative result is shown; n = 3 biological replicates. (B) Effects of increasing concentrations of Q/D on COX1, COX4, SDHA, and β-tubulin proteins in COMI and VIPI cells after 48-h treatment, as assayed by immunoblotting. One representative result is shown; n = 2 biological replicates. (C) Effects of Q/D on COX1 and COX4 mRNA levels on COMI and VIPI cells after 48-h treatment, assessed by qRT-PCR. Data are presented as fold change over control. n = 4–5 biological replicates, mean ± SD. Unpaired two-tailed t test. (D) Effects of Q/D on the functionality of OXPHOS complexes, as assessed using BN-PAGE and an in-gel activity assay on COMI and VIPI cells after 48, 72, and 96 h of drug treatment. Coomassie staining served as the loading control. Shown are representative results of 2 biological replicates. (E) Oxygen consumption of COMI and VIPI cells upon treatment with Q/D for 48 h, as measured using Oxygraph-2k. Cells were evaluated for routine (R), complex I (CI), complexes I and II (CI&II), uncoupled (ETS), and complex II (CII) respiration. Shown are representative results of 3 biological replicates. (F) Quantification of the changes in mitochondrial membrane potential (MMP), as assessed by JC-1 staining in COMI cells. FCCP treatment was used as a positive control; n = 4 biological replicates, mean ± SD. p < 0.05, unpaired two-tailed t test compared with the non-treated control. (G) Effects of increasing concentrations of Q/D on L-lactate production in COMI and VIPI cells after 48 h of Q/D treatment. The L-lactate levels were normalized to the number of cells; n = 3 technical replicates, mean ± SD. p < 0.05, ∗∗p < 0.01, ∗∗∗p < 0.001, unpaired two-tailed t test. Shown are representative results of 3 biological replicates. See also Figure S5.
Figure 6
Figure 6
Genetic inhibition of mitochondrial translation suppresses GSC growth, recapitulating Q/D effects (A) Competition assay in VIPI cells transduced with viruses expressing sgRNAs for target genes. Data were normalized to day 1. n = 4 biological replicates, mean ± SD. (B) Percentage of insertions or deletions (indels) analyzed by decomposition (tracking of indels by decomposition [TIDE]) analysis in Cas9-expressing COMI and VIPI cells following lentiviral transduction of the sgRNAs selected in (A) (sgTUFM_1 and sgMRPS18A_1). n = 3–4 biological replicates, mean ± SD. (C) Effects of TUFM and MRPS18A knockout on TUFM, MRPS18A, and β-tubulin proteins in COMI and VIPI cells, as assayed by immunoblotting. One representative result is shown; n = 2 biological replicates. (D) Effects of TUFM and MRPS18A knockout on COX1, COX4, and β-tubulin proteins in COMI and VIPI cells, as assayed by immunoblotting. One representative result is shown; n = 2 biological replicates. (E) Effects of TUFM and MRPS18A knockout on COMI and VIPI cells grown in suspension. Shown are example images from days 0, 4, 10, and 15; scale bar, 200 μm. (F) Sphere area measured over the course of the 15-day experiment. The data were normalized to day 0. n = 15 technical replicates, mean ± SEM. One representative experiment is shown; n = 3 biological replicates. (G) Effects of TUFM and MRPS18A knockout on COMI and VIPI proliferation when grown as adherent cultures. The data were normalized to day 0. n = 3 biological replicates; mean ± SD. (H) Quantification of the number of spheres greater than 100 μm for COMI and VIPI cells; n = 20 technical replicates; mean ± SEM. ∗∗∗∗p < 0.0001, unpaired two-tailed t test. One representative result is shown; n = 3 biological replicates.

References

    1. Aibara S., Andréll J., Singh V., Amunts A. Rapid Isolation of the Mitoribosome from HEK Cells. J. Vis. Exp. 2018;140:57877. - PMC - PubMed
    1. Amunts A., Brown A., Toots J., Scheres S.H.W., Ramakrishnan V. Ribosome. The structure of the human mitochondrial ribosome. Science. 2015;348:95–98. - PMC - PubMed
    1. Angeletti F., Fossati G., Pattarozzi A., Würth R., Solari A., Daga A., Masiello I., Barbieri F., Florio T., Comincini S. Inhibition of the Autophagy Pathway Synergistically Potentiates the Cytotoxic Activity of Givinostat (ITF2357) on Human Glioblastoma Cancer Stem Cells. Front. Mol. Neurosci. 2016;9:107. - PMC - PubMed
    1. Ashton T.M., McKenna W.G., Kunz-Schughart L.A., Higgins G.S. Oxidative Phosphorylation as an Emerging Target in Cancer Therapy. Clin. Cancer Res. 2018;24:2482–2490. - PubMed
    1. Auffinger B., Tobias A.L., Han Y., Lee G., Guo D., Dey M., Lesniak M.S., Ahmed A.U. Conversion of differentiated cancer cells into cancer stem-like cells in a glioblastoma model after primary chemotherapy. Cell Death Differ. 2014;21:1119–1131. - PMC - PubMed

Publication types