. 2021 Apr 27;35(4):109048.
doi: 10.1016/j.celrep.2021.109048.

Reactive astrocytes facilitate vascular repair and remodeling after stroke

Affiliations

Reactive astrocytes facilitate vascular repair and remodeling after stroke

Michael R Williamson et al. Cell Rep. .

Abstract

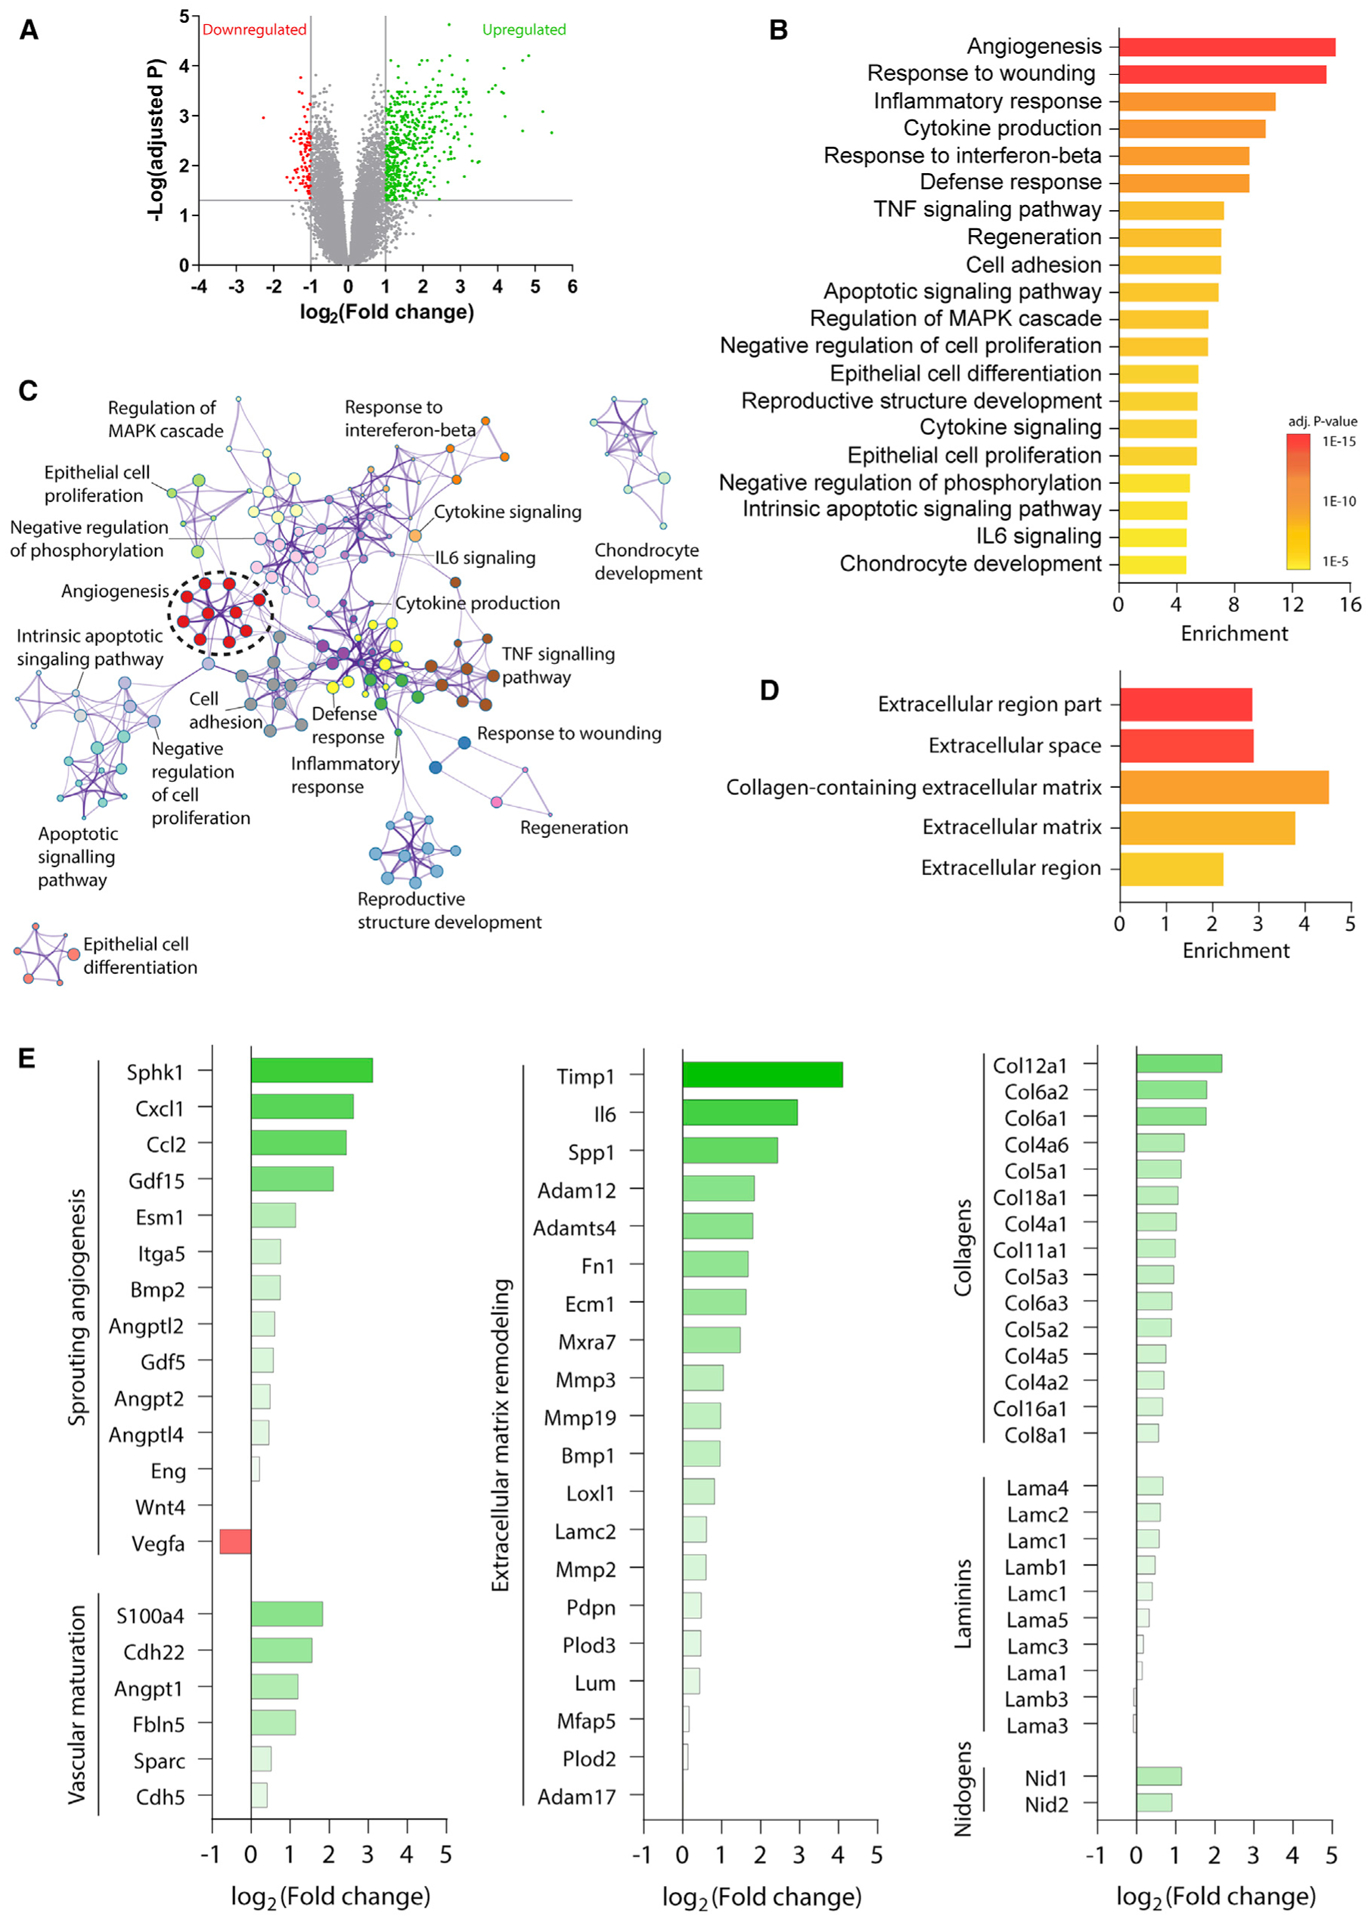
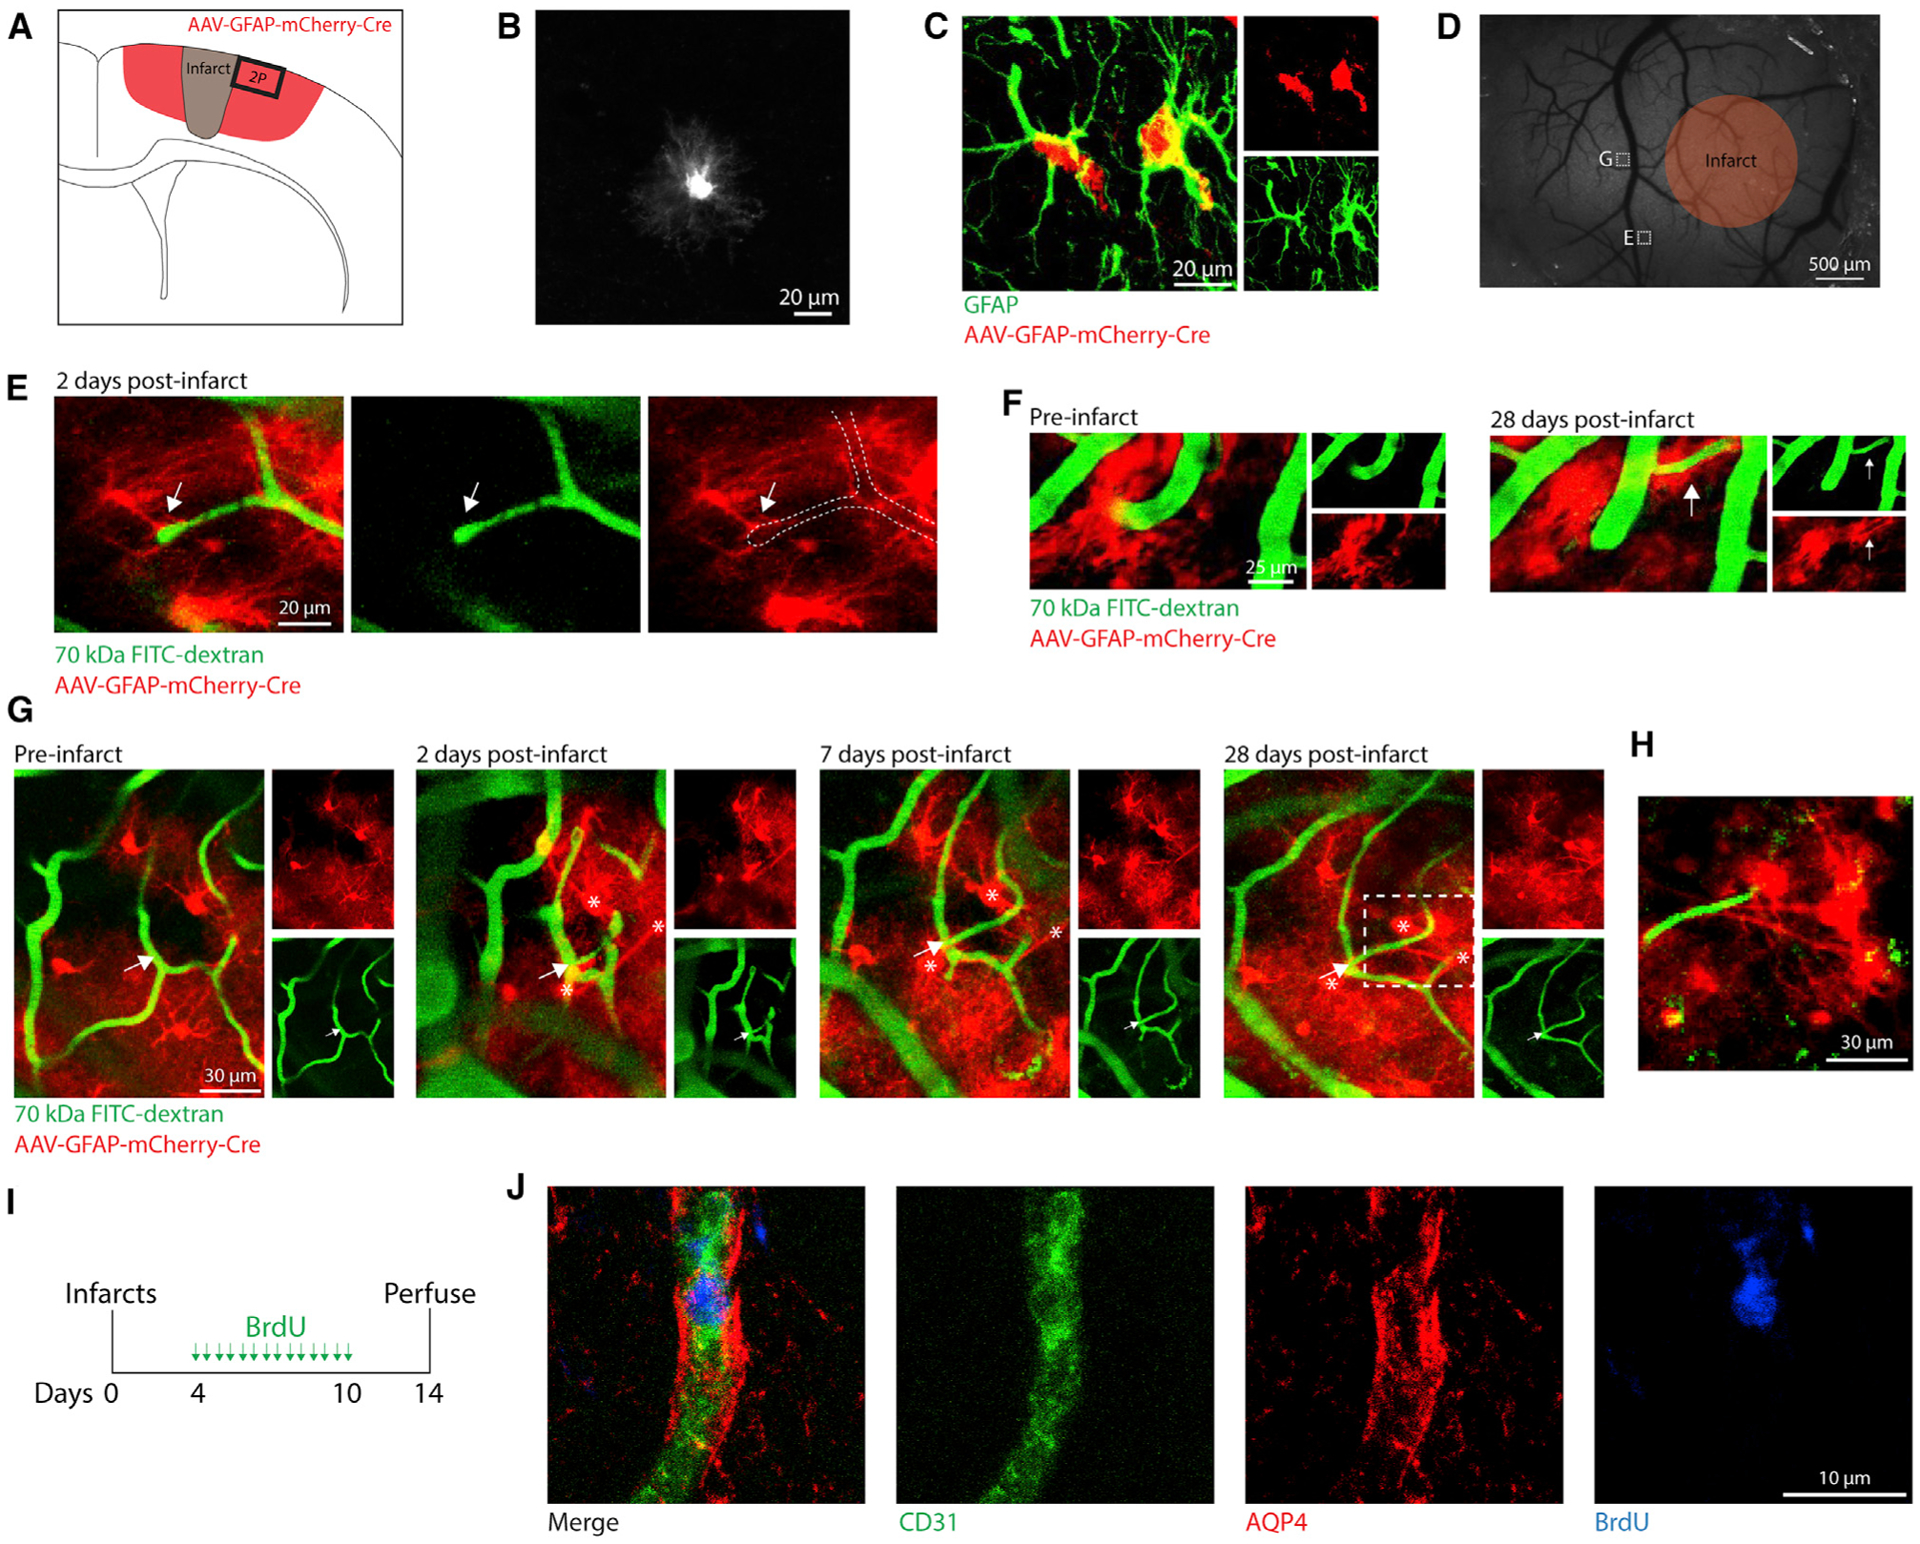
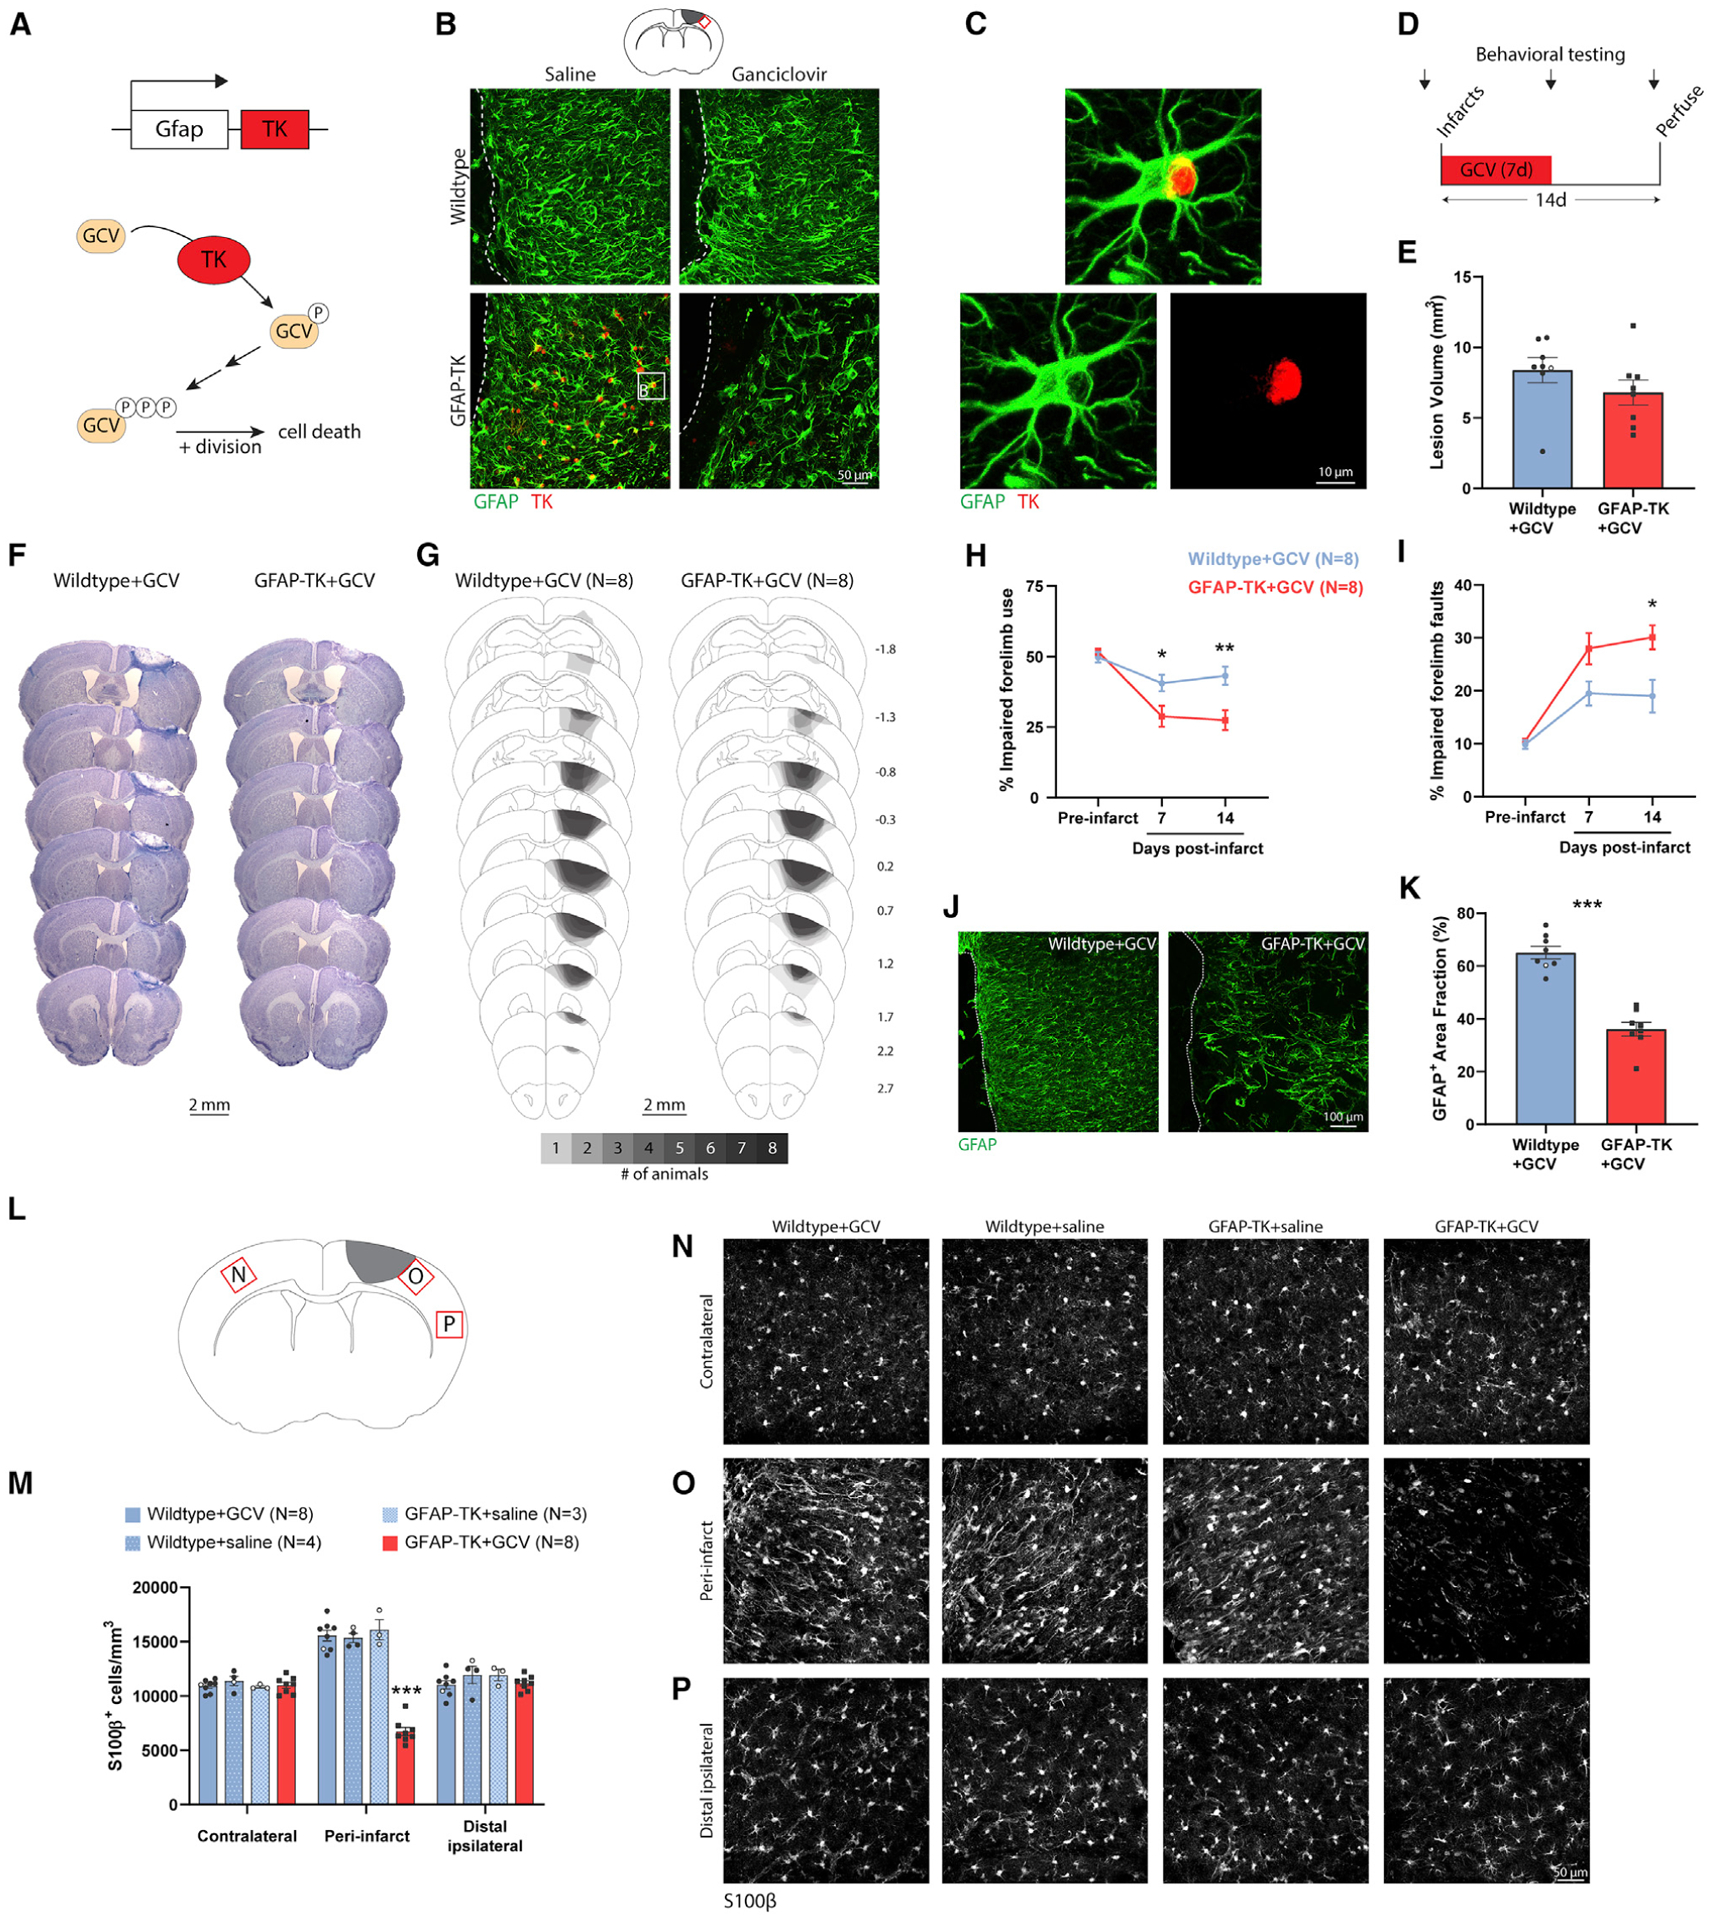
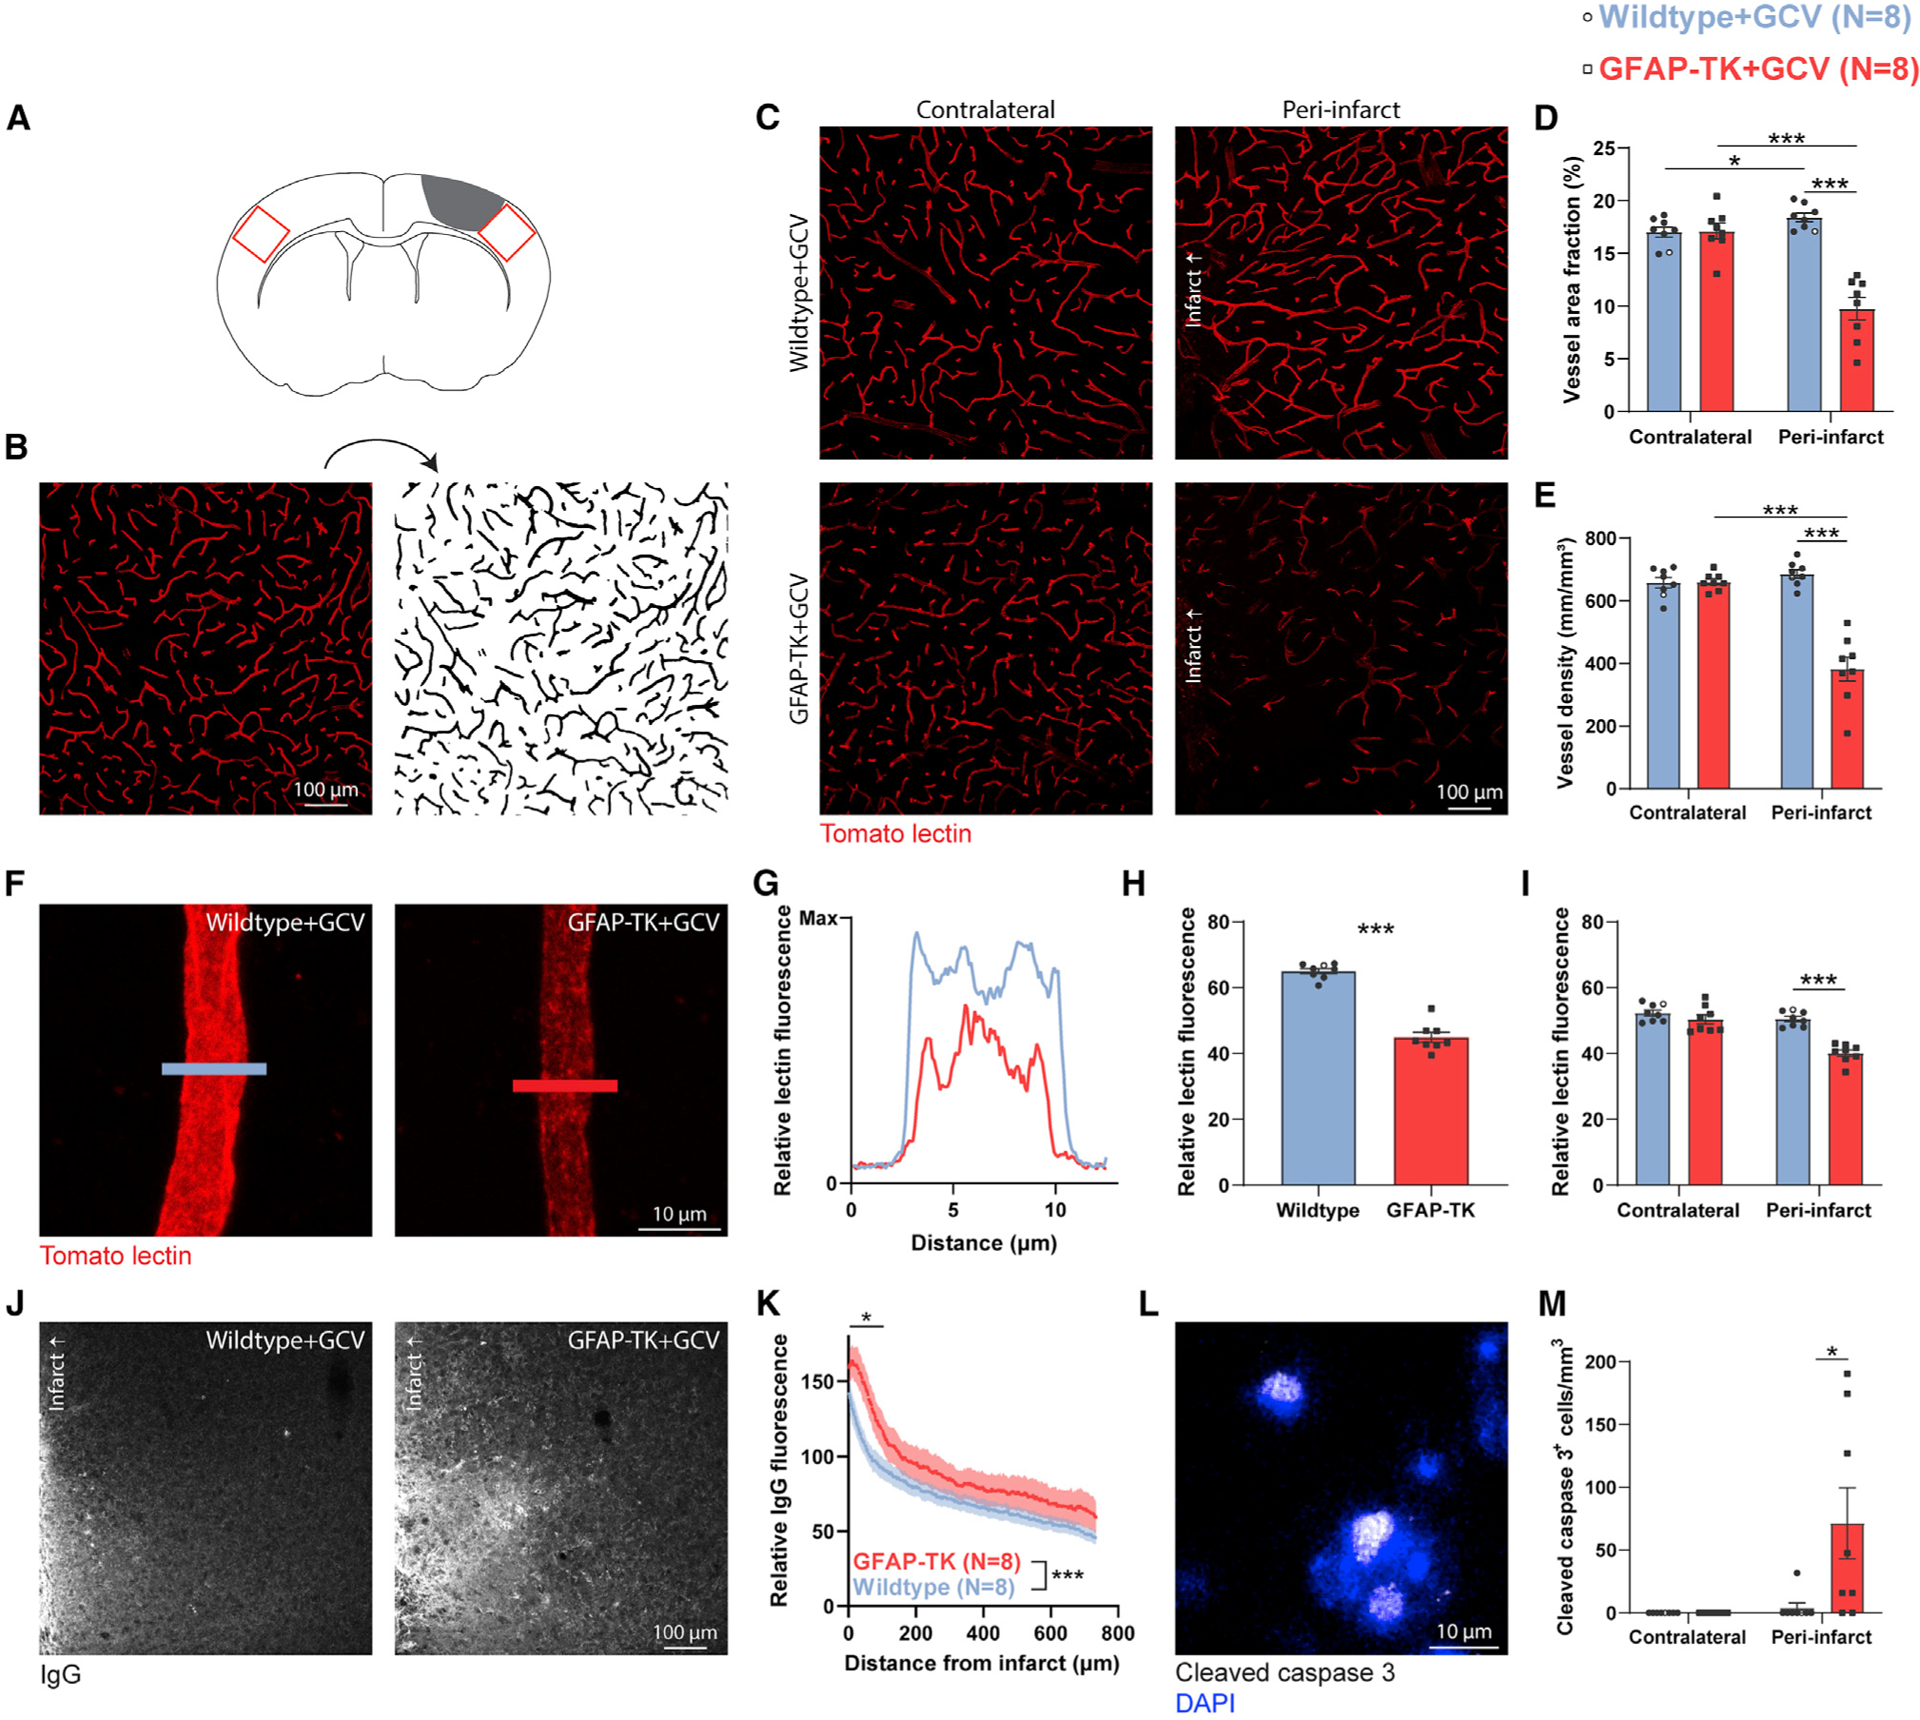
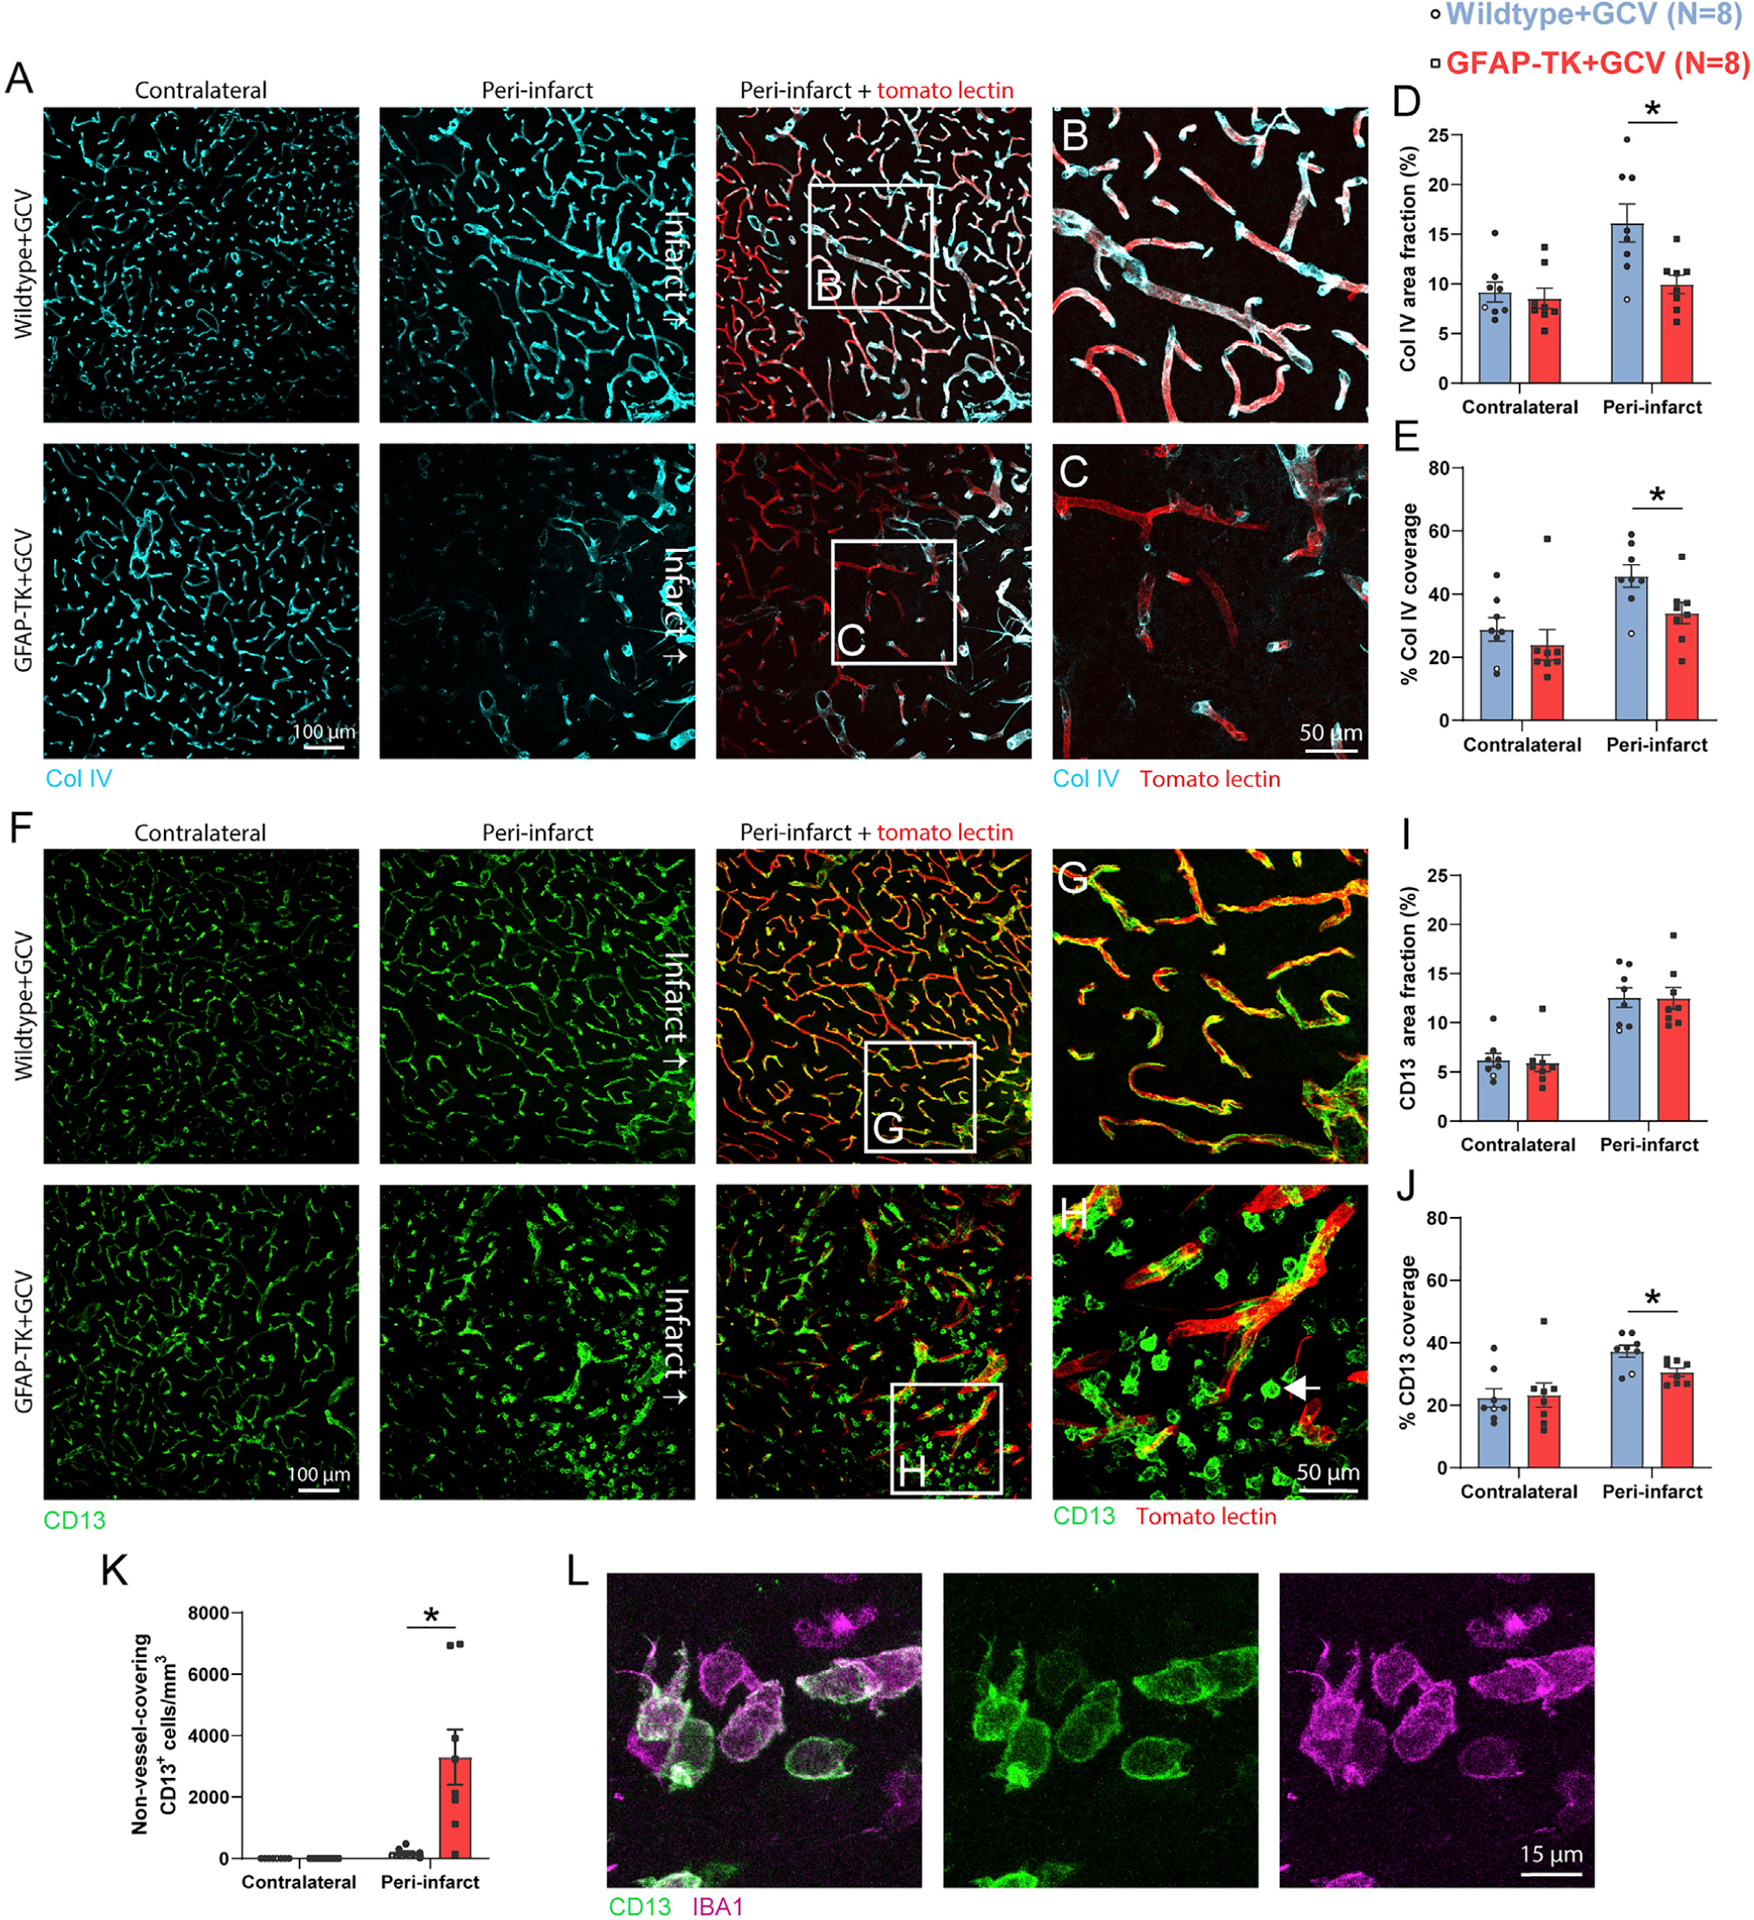
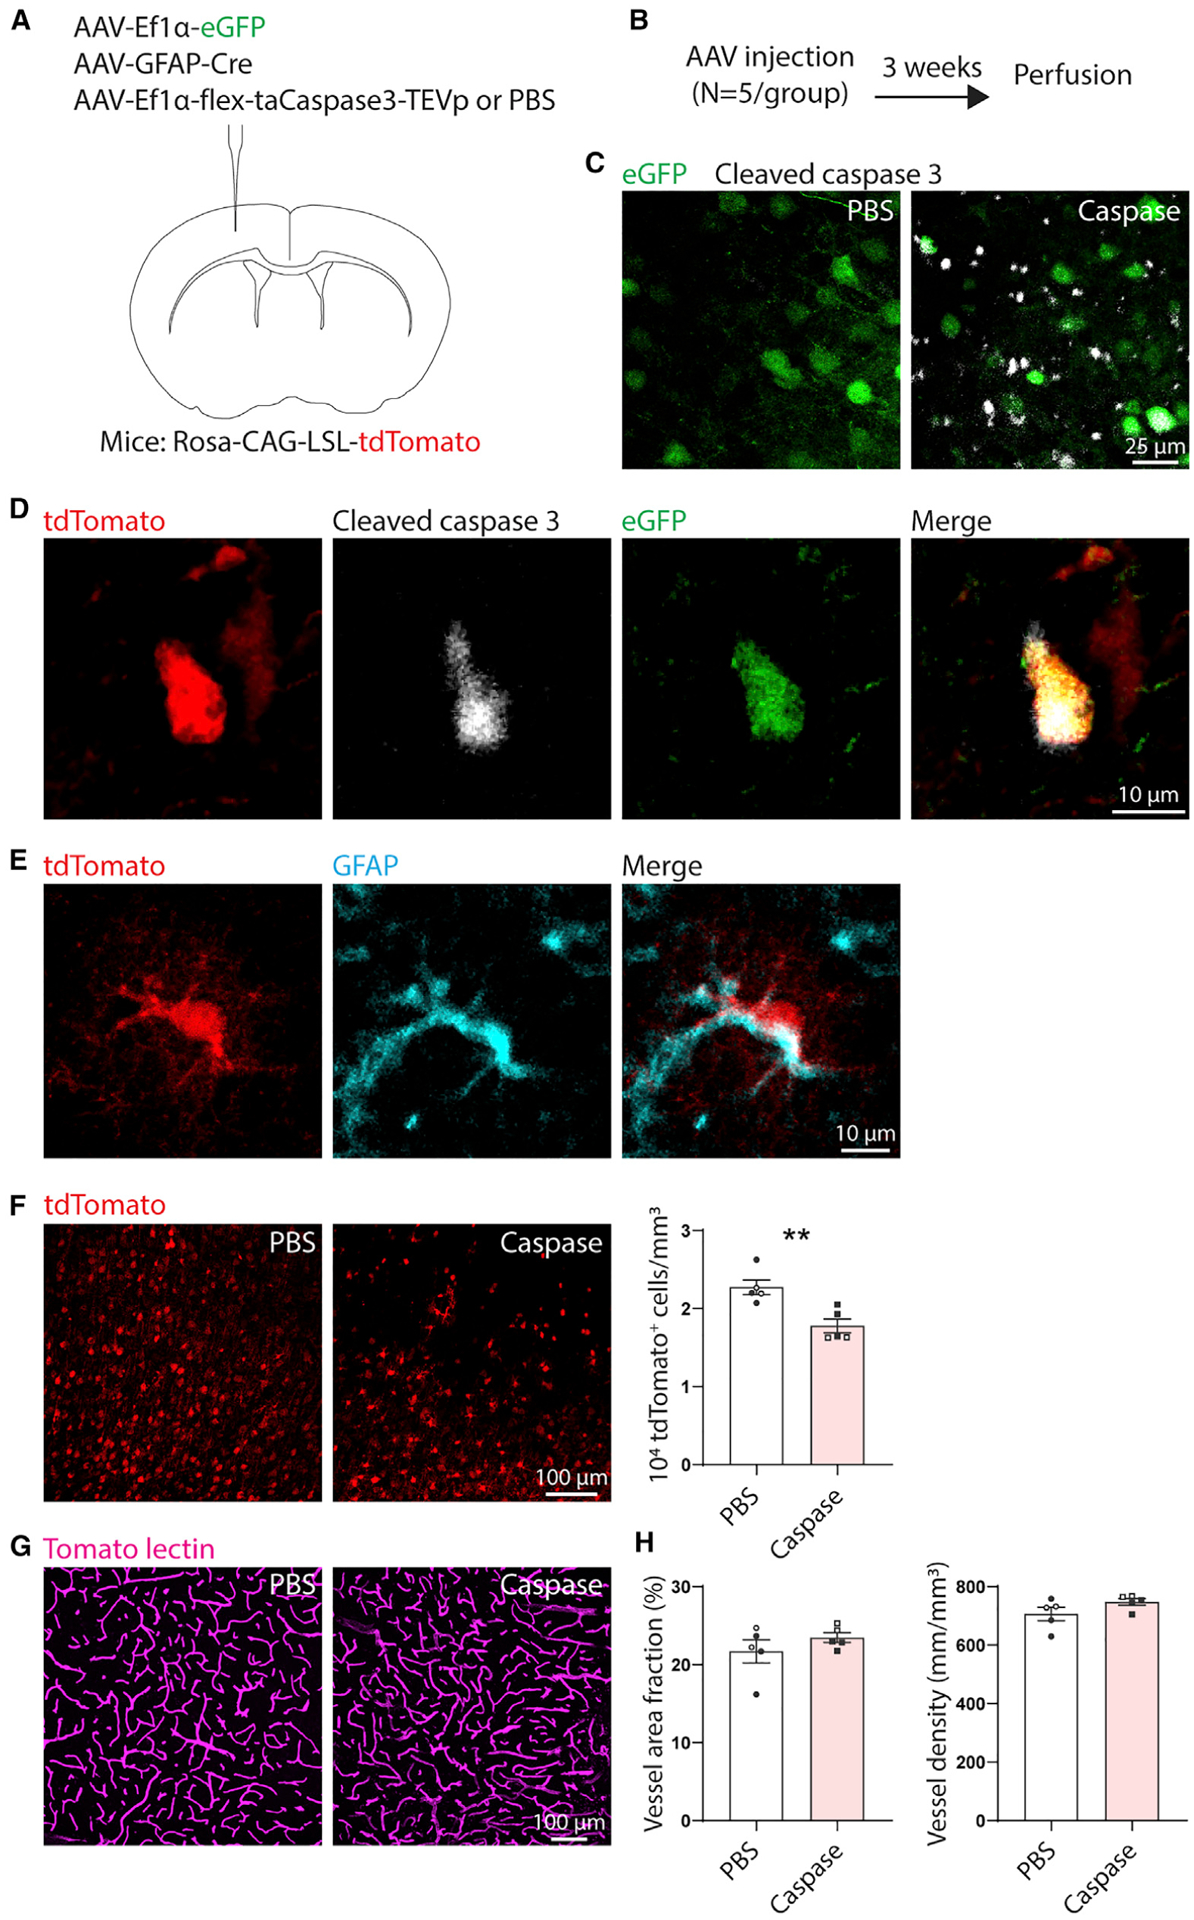
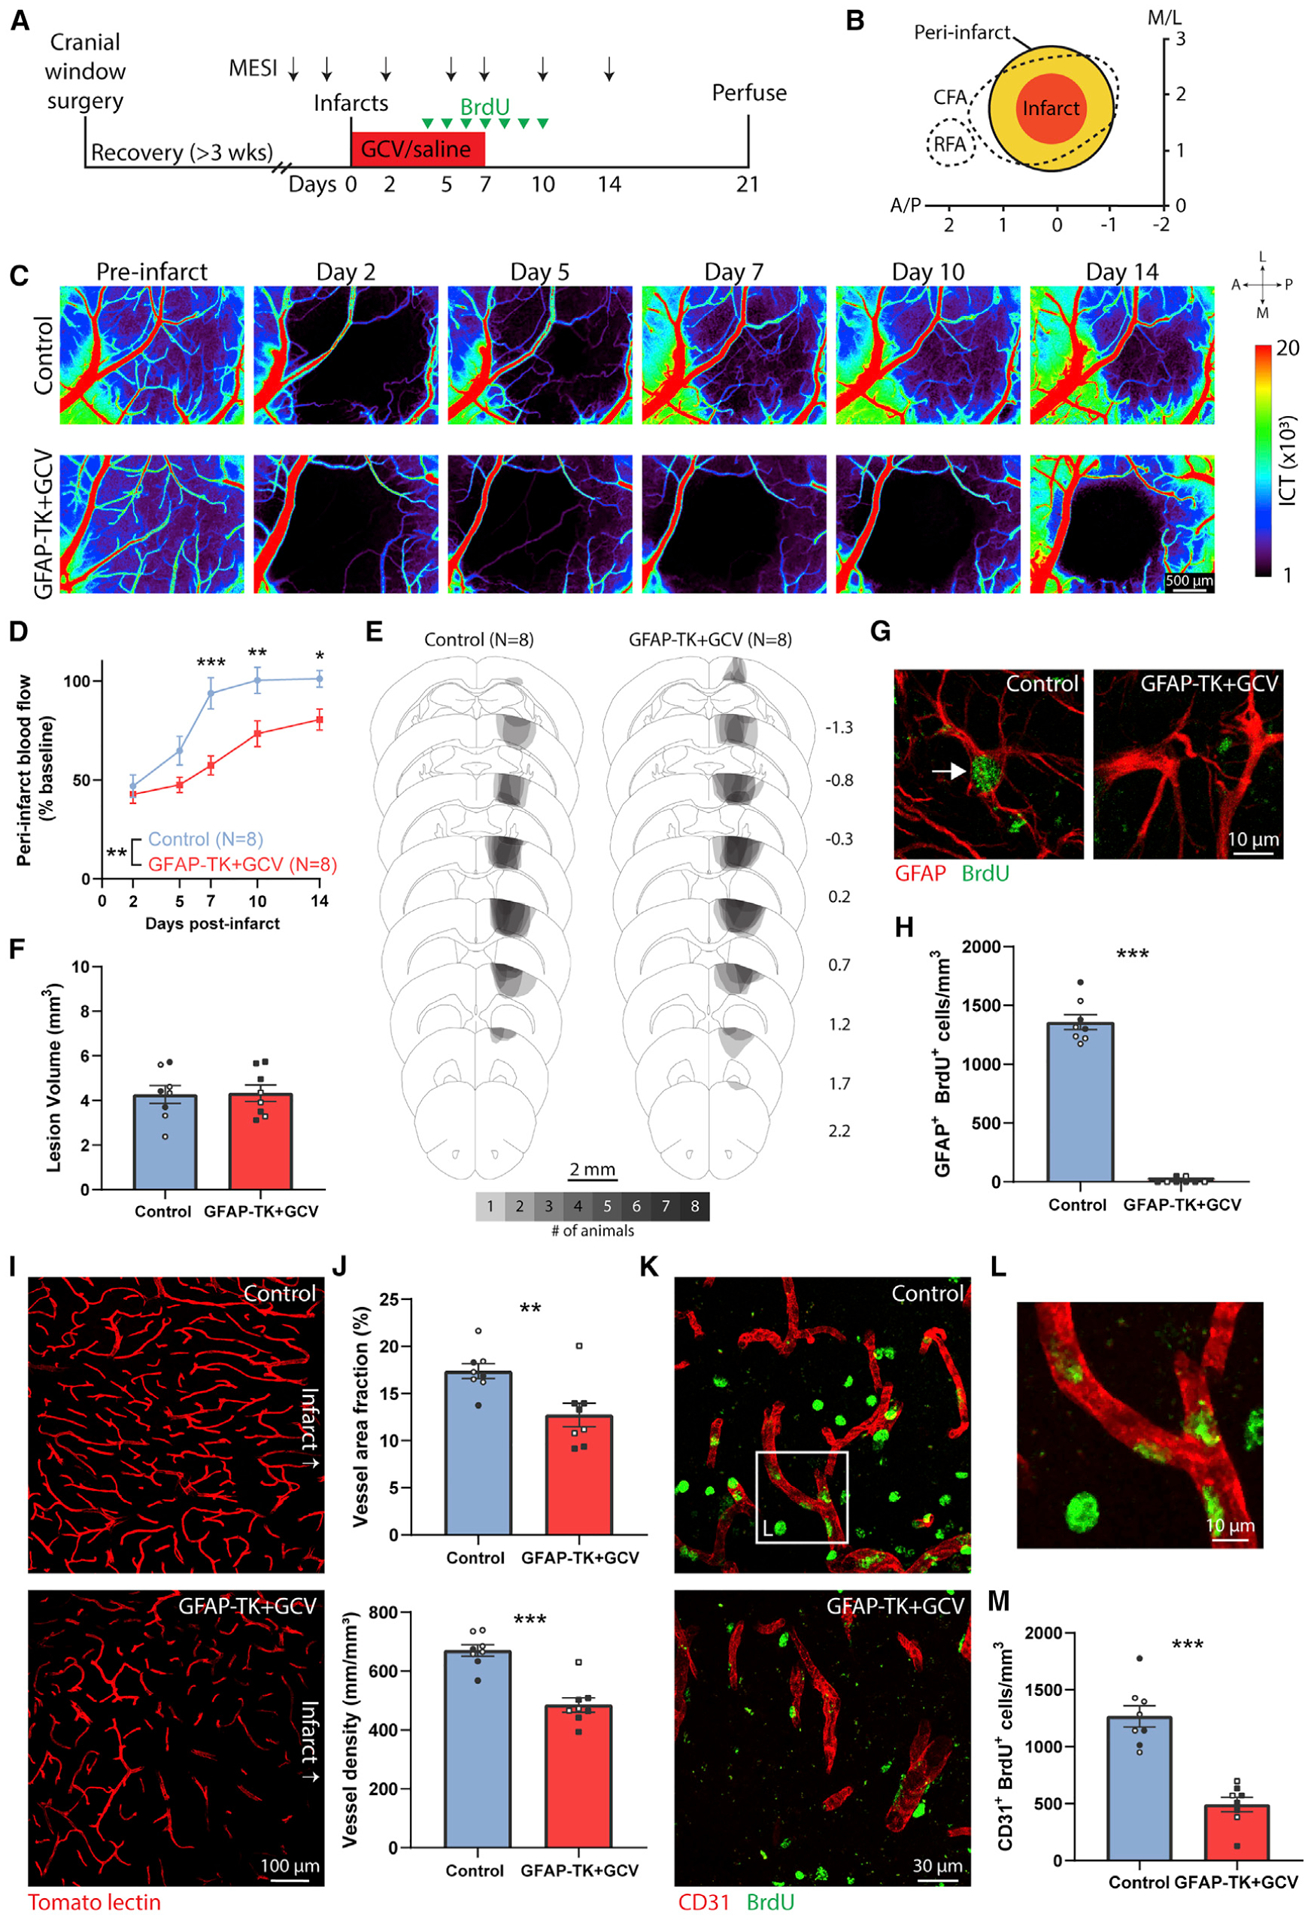
Brain injury causes astrocytes to assume a reactive state that is essential for early tissue protection, but how reactive astrocytes affect later reparative processes is incompletely understood. In this study, we show that reactive astrocytes are crucial for vascular repair and remodeling after ischemic stroke in mice. Analysis of astrocytic gene expression data reveals substantial activation of transcriptional programs related to vascular remodeling after stroke. In vivo two-photon imaging provides evidence of astrocytes contacting newly formed vessels in cortex surrounding photothrombotic infarcts. Chemogenetic ablation of a subset of reactive astrocytes after stroke dramatically impairs vascular and extracellular matrix remodeling. This disruption of vascular repair is accompanied by prolonged blood flow deficits, exacerbated vascular permeability, ongoing cell death, and worsened motor recovery. In contrast, vascular structure in the non-ischemic brain is unaffected by focal astrocyte ablation. These findings position reactive astrocytes as critical cellular mediators of functionally important vascular remodeling during neural repair.

Keywords: angiogenesis; astrocytes; blood-brain barrier; neural repair; recovery; revascularization; stroke; vascular remodeling.


Conflict of interest statement

Declaration of interests The authors declare no competing interests.

Figures

Figure 1.
Figure 1.. Stroke activates transcriptional programs relevant for vascular remodeling in reactive astrocytes
(A) Volcano plot of gene expression in astrocytes after stroke relative to sham procedures. Genes with expression increased log2 fold change >1 and adjusted p < 0.05 are shown in green. Genes with expression decreased log2 fold change less than −1 and adjusted p < 0.05 are shown in red. (B) Top 20 enriched biological process and function gene ontology term clusters among upregulated genes. Terms are sorted by enrichment and color coded by p value. (C) Enrichment network plot of the top enriched gene ontology term clusters among upregulated genes. Enriched terms are indicated as nodes. Nodes are color coded by cluster membership. Nodes are connected based on gene member similarities. (D) Top five enriched cellular component terms for protein products of upregulated genes in reactive astrocytes. (E) Relative expression of genes associated with intercellular regulation of sprouting angiogenesis, vascular maturation, extracellular matrix remodeling, and extracellular matrix components. Genes associated with intercellular regulation of these processes were defined as those that code for proteins that are secreted, involved in the production of secreted molecules, or located on the cell surface. Data are expressed as log2 fold change in astrocytes from stroke versus sham animals.
Figure 2.
Figure 2.. Astrocytes interact with remodeling vessels after stroke
(A) Illustration of AAV-mediated labeling and imaging. (B) In vivo two-photon (2P) image of an AAV-labeled cell with characteristic astrocyte morphology (pre-stroke). (C) Confocal image validating AAV-mediated labeling of astrocytes with immunohistochemistry. (D) Wide-field speckle contrast image of the brain surface. Orange region represents the approximate boundaries of the infarct core. White boxes indicate 2P-imaged regions corresponding to labeled images. (E) 2P image from 2 days post-stroke of a vascular sprout contacted by a nearby astrocyte (arrow). This region was only imaged at 2 days post-stroke. (F) 2P images showing a vessel that reoriented and increased diameter after stroke ensheathed by astrocytes (arrow). (G) 2P images showing a new capillary segment (arrow) formed after stroke contacted by astrocytes (*). (H) 2P image corresponding to the dashed box in (G) showing astrocytes extending processes that terminate on the new vessel segment. (I) Experimental design for labeling proliferating vessels after stroke. (J) Confocal images showing a new vessel (CD31+BrdU+) ensheathed by astrocytic endfeet (AQP4+). All CD31+BrdU+ new vessels analyzed (76/76 new vessels from six mice) were surrounded by AQP4+ endfeet.
Figure 3.
Figure 3.. Chemogenetic ablation of a subset of reactive astrocytes worsens behavioral function after cortical infarcts
(A) Schematic illustrating how Gfap promoter-driven expression of thymidine kinase (TK) permits ganciclovir (GCV)-conditional ablation of dividing cells. (B) Confocal images from peri-infarct cortex illustrating conditional ablation of a subset of astrocytes in peri-infarct cortex specific to GFAP-TK mice given GCV. Dashed lines indicate the lesion border. The sampling region is indicated by the red box in the diagram at top. Images are from 10 days post-stroke. GCV or vehicle (saline) was delivered via osmotic pump for the first 7 days post-stroke. White box in the lower left image corresponds to the image in (C). (C) High-magnification image of a GFAP+TK+ astrocyte in a GFAP-TK mouse given saline. (D) Experimental timeline. n = 8 mice/group (wild-type versus GFAP-TK). (E) Lesion volume measured at 14 days was not different between groups (t(14) = 1.27, p = 0.225). (F) Representative Nissl-stained coronal sections from 14 days post-stroke. (G) Schematic lesion reconstruction. Numbers on right indicate distance (mm) relative to bregma. (H and I) Astrocyte ablation worsened motor function as measured with the cylinder (H) and grid walking tests (I). *p < 0.05, **p < 0.01, Holm-Sidak’s tests comparing groups at each time point. (J and K) Confocal images (J) and quantification (K) of peri-infarct GFAP expression, confirming ablation of a subset of astrocytes in GFAP-TK mice given GCV. ***t(14) = 8.17, p < 0.0001. (L) Schematic showing sampling regions for (N)–(P). (M) Quantification of S100β+ astrocyte density by region at 14 days post-stroke. Astrocyte ablation was specific to GFAP-TK+GCV mice. ***p < 0.0001, Tukey tests compared with other groups in the peri-infarct region. (N–P) Confocal images of S100β+ astrocytes in contralateral cortex (N), peri-infarct cortex (O), and ipsilateral cortex ~2 mm from the infarct border (P, “distal ipsilateral”). Data are presented as mean ± SEM. When replicates are shown, data points representing males are shown as filled symbols; data points representing females are shown as open symbols.
Figure 4.
Figure 4.. Astrocyte ablation impairs vascular remodeling and exacerbates vascular permeability, which is associated with chronic cell death
(A) Sampling regions for images from peri-infarct and homotopic contralateral cortex (red boxes). (B) Example of processing and binarization of a confocal image of tomato lectin-labeled vasculature. (C–E) Confocal images (C) and quantification (D and E) of vasculature from 14 days post-stroke show that astrocyte ablation markedly impaired vascular remodeling in peri-infarct cortex, as measured by reduced vascular area fraction and length. *p < 0.05, ***p < 0.001, t tests (n = 8 mice/group). (F) Representative high-magnification images of lectin-labeled vessels. (G) Lectin fluorescence intensity measured across line profiles as indicated in (F). (H and I) Quantification of glycocalyx coverage as lectin fluorescence from line profiles (H) and within vessel masks (I). ***t(14) ≥ 8.1, p < 0.0001. (J and K) Representative confocal images (J) and quantification (K) of IgG demonstrate increased vascular permeability in peri-infarct cortex of GFAP-TK mice. Two-way ANOVA showed significant effects of distance (F(484,6790) = 11.6, p < 0.0001) and group (F(1, 6790) = 836.3, p < 0.0001). Comparison between mean fluorescence in 50-μm bins showed a significant difference between groups within 100 μm from the infarct border (*t(14) ≥ 2.2, p ≤ 0.043, t tests). (L and M) Confocal image (L) and quantification (M) of cleaved caspase-3+ cells. Astrocyte ablation significantly increased the number of apoptotic cleaved caspase-3+ cells in peri-infarct cortex at 14 days post-stroke. *U = 11, p = 0.018, Mann-Whitney U test. No cleaved caspase-3+ cells were observed in homotopic contralateral cortex. Data are presented as mean ± SEM. When replicates are shown, data points representing males are shown as filled symbols; data points representing females are shown as open symbols.
Figure 5.
Figure 5.. Astrocyte ablation reduces basement membrane and mural cell coverage of vasculature in peri-infarct cortex
(A) Representative confocal images of collagen IV in peri-infarct and contralateral cortex 14 days post-stroke. (B and C) High-magnification images from regions indicated in (A). (D and E) Collagen IV area fraction (D) and vessel coverage (E) were significantly reduced in peri-infarct cortex of GFAP-TK+GCV mice (n = 8/group). *t(14) ≥ 2.38, p ≤ 0.032, t tests. (F) Representative confocal images of pericytes (CD13+) in peri-infarct and contralateral cortex. (G and H) High-magnification images from regions indicated in (F). Large numbers of CD13+ cells not covering vessels were observed (arrow in H; quantified in K). (I) Peri-infarct CD13+ area fraction was not reduced by astrocyte ablation (t(14) = 0.04, p = 0.967). (J) However, peri-infarct vascular coverage by pericytes was significantly reduced in GFAP-TK+GCV mice. *t(14) = 2.92, p = 0.011. (K) Quantification of non-vessel-covering CD13+ cells, which were IBA1+ (L), consistent with a myeloid cell phenotype. *t(7.0) = 3.5, p = 0.010, Welch’s corrected t test. (L) Confocal images of non-vessel-associated CD13+ IBA1+ cells from peri-infarct cortex of a GFAP-TK+GCV mouse. Data are presented as mean ± SEM. Data points representing males are shown as filled symbols; data points representing females are shown as open symbols.
Figure 6.
Figure 6.. Genetic ablation of astrocytes in the otherwise intact brain does not affect vascular structure
(A) AAV injection diagram. n = 5 Rosa-CAG-LSL-tdTomato mice per group (PBS or caspase). Mice in both groups were intracranially injected with AAV-EF1α-EGFP to label the injection site and AAV-GFAP-Cre to express Cre in astrocytes. Mice in the caspase group also received AAV-EF1α-flex-taCaspase3-TEVp to induce Cre-dependent expression of cleaved caspase-3, which causes apoptotic cell death. Control mice were injected with an equal volume of PBS instead of AAV-EF1α-flex-taCaspase3-TEVp. (B) Experimental timeline. (C) Confocal images showing expression of cleaved caspase-3 labeled by immunohistochemistry in mice injected with AAV-EF1α-flex-taCaspase3-TEVp (caspase), but not PBS. Images were taken at the injection site (EGFP label). (D) Example of a tdTomato+ cleaved caspase-3+EGFP+ cell (caspase group). Images are 5-μm maximum projections. (E) Example of a tdTomato+ GFAP+ cell, confirming Cre-mediated recombination in astrocytes. (F) The number of tdTomato+ cells was reduced in the caspase group, confirming ablation. Images are 6-μm maximum projections. **t(8) = 3.82, p = 0.005, t test. (G) Representative maximum projection confocal images of tomato lectin-labeled vasculature at the injection site from caspase AAV- and PBS-injected animals. (H) Ablation of astrocytes did not affect vascular area fraction or density (t(8) ≤ 1.6, p ≥ 0.146, t tests). Data are presented as mean ± SEM. Data points representing males are shown as filled symbols; data points representing females are shown as open symbols.
Figure 7.
Figure 7.. Astrocyte ablation limits restoration of blood flow and reduces vessel proliferation in peri-infarct cortex
(A) Experimental timeline. n = 8 control mice (n = 5 wild-type+GCV, n = 3 GFAP-TK+saline), n = 8 GFAP-TK+GCV mice. (B) Schematic illustrating photothrombotic infarct placement relative to caudal (CFA) and rostral (RFA) forelimb areas in motor cortex. The infarct core was defined using the region of day 2 parenchymal blood flow with less than 20% of baseline parenchymal blood flow. Peri-infarct cortex was defined as extending 500 μm from the infarct border. Axes indicate mm relative to bregma. (C) Representative longitudinal MESI blood flow maps. (D) Peri-infarct blood flow deficits were prolonged in GFAP-TK mice given GCV. *p = 0.043, **p = 0.006, ***p = 0.0002, Holm-Sidak’s tests. (E) Schematic lesion reconstruction. Numbers on right indicate distance (mm) relative to bregma. (F) Lesion volume was not different between groups. t(14) = 0.10, p = 0.919, t test. (G) Confirmation of ablation of proliferating astrocytes in peri-infarct cortex of GFAP-TK+GCV mice. Confocal images from peri-infarct cortex showing a GFAP+BrdU+ cell (arrow) in a control mouse and a GFAP+BrdU cell in a GFAP-TK+GCV mouse. (H) Quantification of peri-infarct GFAP+BrdU+ cells showing near complete ablation of proliferating astrocytes. ***U = 0, p = 0.0002, Mann-Whitney U test. (I) Representative confocal images of tomato lectin-labeled vessels in peri-infarct cortex. (J) Peri-infarct vessel area fraction and density were significantly reduced in mice with ablated astrocytes. **t(14) = 3.14, p = 0.007; ***t(14) = 5.93, p < 0.0001, t tests. (K) Representative confocal images (5-μm maximum projections) of CD31+ vasculature and BrdU in peri-infarct cortex. (L) High-magnification example of BrdU+CD31+ cells from the region indicated by the white box in (K). (M) The number of BrdU+CD31+ vessels was significantly reduced in GFAP-TK+GCV mice. ***t(14) = 6.84, p < 0.0001, t test. Data are presented as mean ± SEM. When replicates are shown, data points representing males are shown as filled symbols; data points representing females are shown as open symbols.

Similar articles

Cited by

References

    1. Allegra Mascaro AL, Conti E, Lai S, Di Giovanna AP, Spalletti C, Alia C, Panarese A, Scaglione A, Sacconi L, Micera S, et al. (2019). Combined rehabilitation promotes the recovery of structural and functional features of healthy neuronal networks after stroke. Cell Rep. 28, 3474–3485.e6. - PubMed
    1. Anderson MA, Burda JE, Ren Y, Ao Y, O’Shea TM, Kawaguchi R, Coppola G, Khakh BS, Deming TJ, and Sofroniew MV (2016). Astrocyte scar formation aids central nervous system axon regeneration. Nature 532, 195–200. - PMC - PubMed
    1. Androvic P, Kirdajova D, Tureckova J, Zucha D, Rohlova E, Abaffy P, Kriska J, Valny M, Anderova M, Kubista M, and Valihrach L (2020). Decoding the transcriptional response to ischemic stroke in young and aged mouse brain. Cell Rep. 31, 107777. - PubMed
    1. Attwell D, Buchan AM, Charpak S, Lauritzen M, Macvicar BA, and Newman EA (2010). Glial and neuronal control of brain blood flow. Nature 468, 232–243. - PMC - PubMed
    1. Baskin YK, Dietrich WD, and Green EJ (2003). Two effective behavioral tasks for evaluating sensorimotor dysfunction following traumatic brain injury in mice. J. Neurosci. Methods 129, 87–93. - PubMed

Publication types

LinkOut - more resources