. 2021 Apr 27;35(4):109032.
doi: 10.1016/j.celrep.2021.109032.

Erosion of human X chromosome inactivation causes major remodeling of the iPSC proteome

Affiliations

Erosion of human X chromosome inactivation causes major remodeling of the iPSC proteome

Alejandro J Brenes et al. Cell Rep. .

Abstract

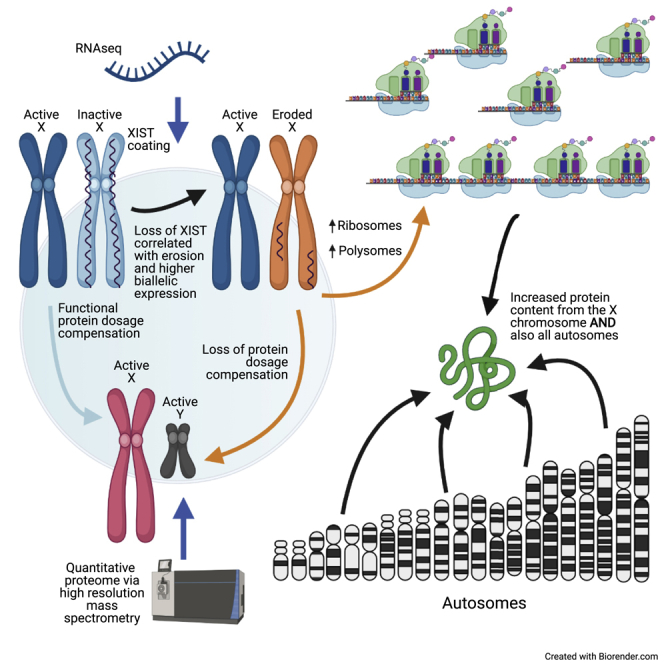
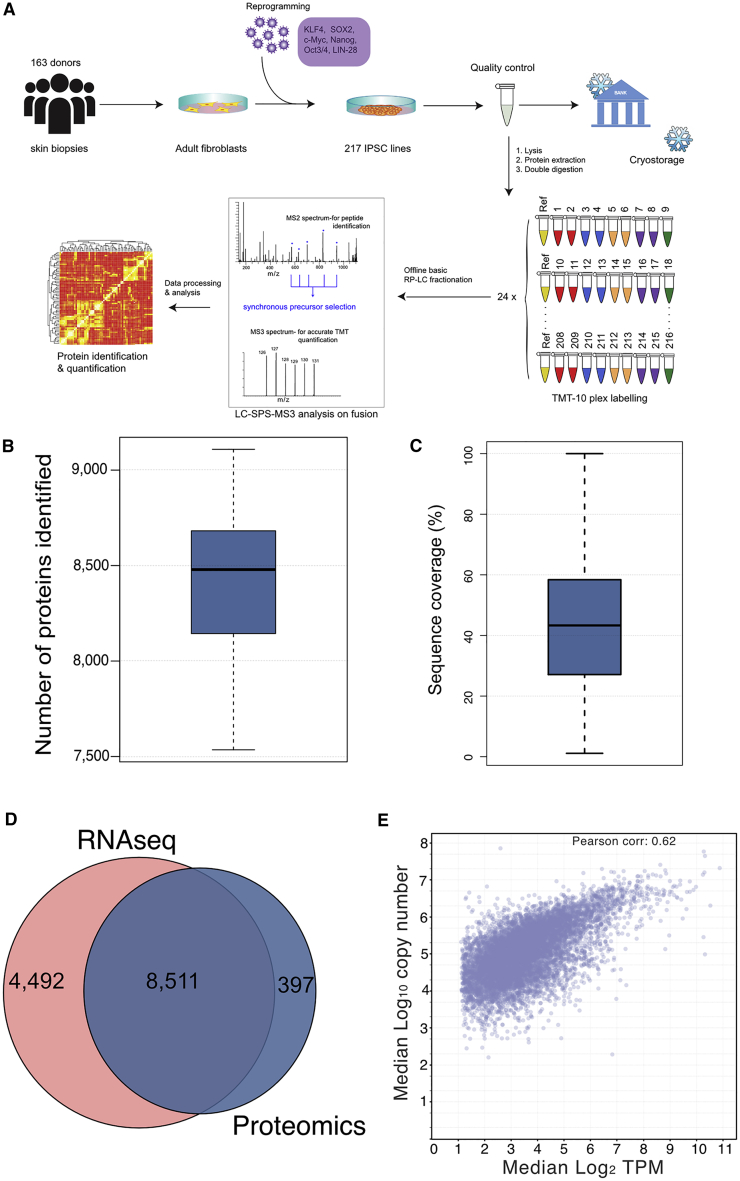
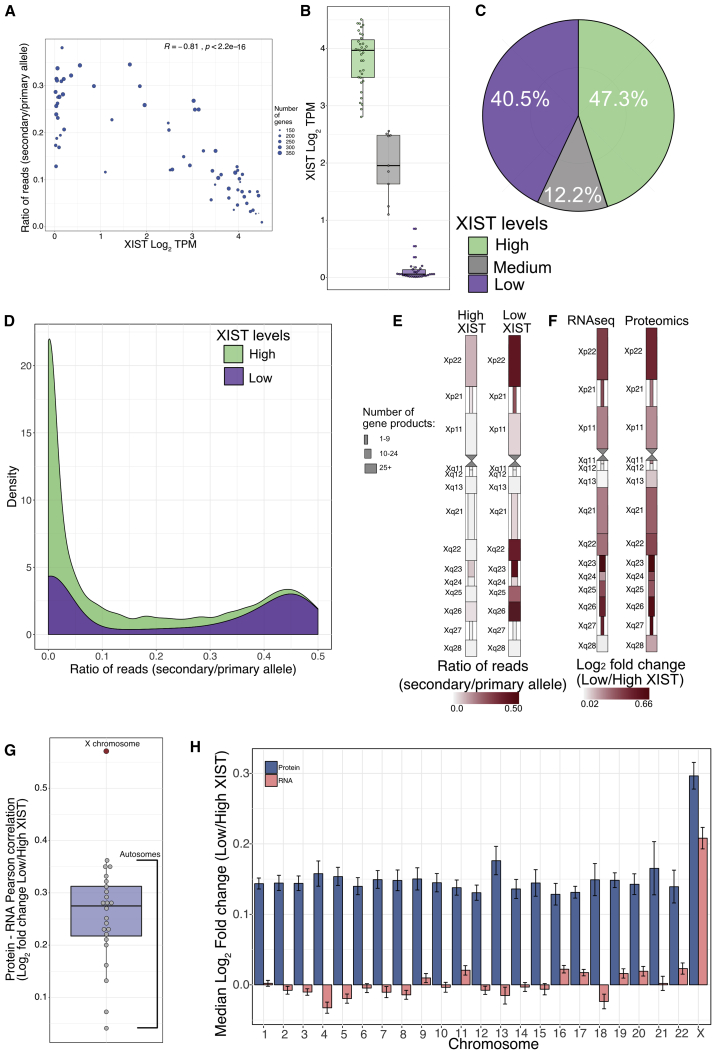
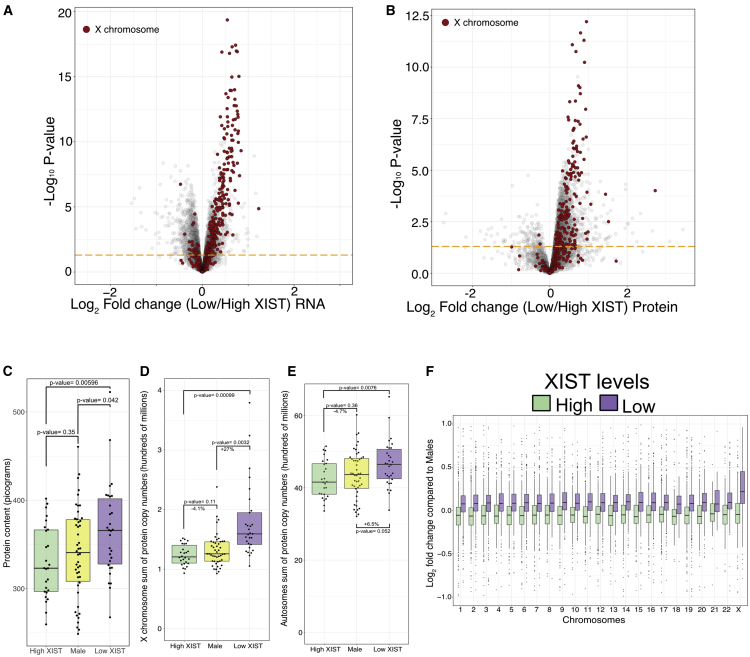
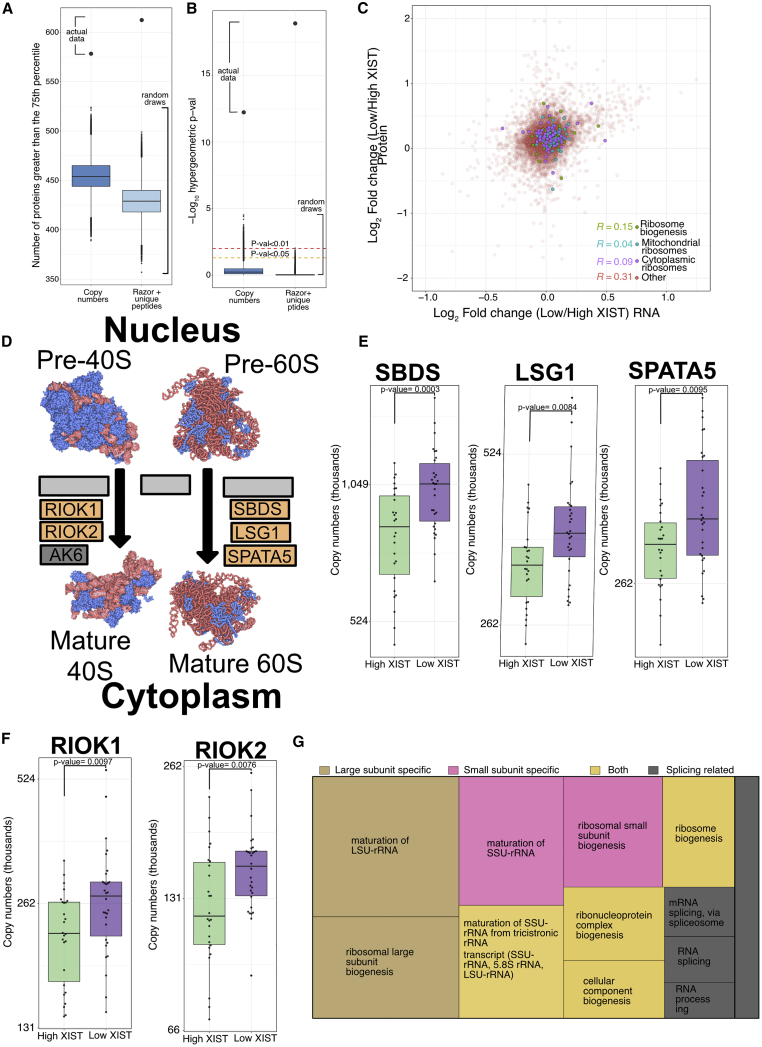
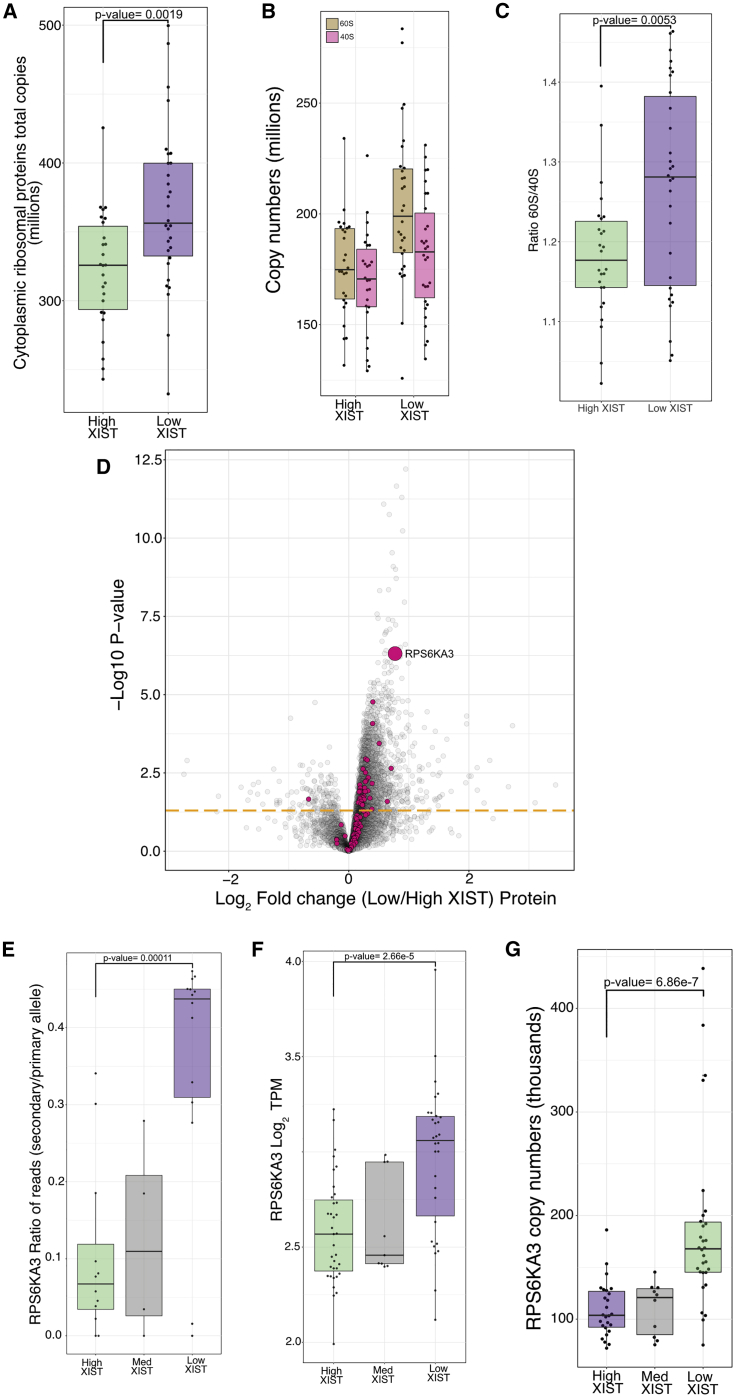
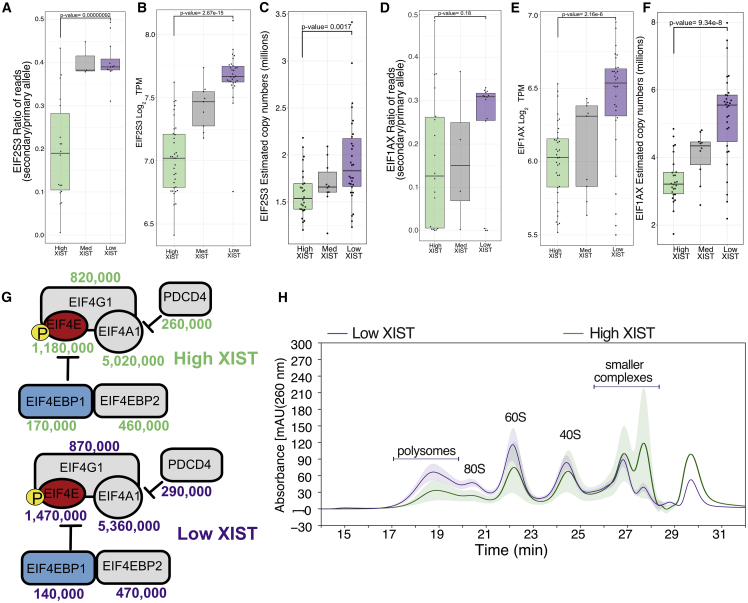
X chromosome inactivation (XCI) is a dosage compensation mechanism in female mammals whereby transcription from one X chromosome is repressed. Analysis of human induced pluripotent stem cells (iPSCs) derived from female donors identified that low levels of XIST RNA correlated strongly with erosion of XCI. Proteomic analysis, RNA sequencing (RNA-seq), and polysome profiling showed that XCI erosion resulted in amplified RNA and protein expression from X-linked genes, providing a proteomic characterization of skewed dosage compensation. Increased protein expression was also detected from autosomal genes without an mRNA increase, thus altering the protein-RNA correlation between the X chromosome and autosomes. XCI-eroded lines display an ∼13% increase in total cell protein content, with increased ribosomal proteins, ribosome biogenesis and translation factors, and polysome levels. We conclude that XCI erosion in iPSCs causes a remodeling of the proteome, affecting the expression of a much wider range of proteins and disease-linked loci than previously realized.

Keywords: RNA-seq; X chromosome inactivation; dosage compensation; erosion of X chromosome inactivation; gene expression; iPSC; mass spectrometry; proteome; proteomics; transcriptome.


Conflict of interest statement

Declaration of interests D.S. now works for GSK.

Figures

None
Graphical abstract
Figure 1
Figure 1
Comprehensive coverage For all boxplots, the top and bottom hinges represent the 1st and 3rd quartiles. The top whisker extends from the hinge to the largest value no further than 1.5 × interquartile range (IQR) from the hinge; the bottom whisker extends from the hinge to the smallest value at most 1.5 × IQR of the hinge. (A) The HipSci proteomics workflow from reprogramming to identification and quantification. (B) Boxplot showing the number of proteins identified per line across the 56 filtered (see STAR Methods) female iPSC lines. (C) Boxplot showing the sequence coverage for all proteins detected within the dataset. (D) Pie chart showing the overlap between quantified gene products in the proteomics and RNA-seq datasets. (E) Scatterplot comparing the median log2 transcripts per million (TPM) versus the median log10 copy number for all gene products.
Figure 2
Figure 2
XIST and XCI For all boxplots, the bottom and top hinges represent the 1st and 3rd quartiles. The top whisker extends from the hinge to the largest value no further than 1.5 × IQR from the hinge; the bottom whisker extends from the hinge to the smallest value at most 1.5 × IQR of the hinge. (A) Scatterplot showing the ratio of reads derived from the secondary allele (lowest expressed allele) compared to the primary allele (highest expressed allele) for all X-linked transcripts versus the log2 XIST TPM for all healthy female lines. The size of the circle is determined by the number of transcripts used for the analysis. (B) Boxplot showing log2 TPM for the long non-coding RNA XIST across all 3 populations, namely, low, medium, and high XIST. (C) Pie chart showing the percentage of healthy female lines within each XIST-stratified population. (D) Stacked density plot for all X-linked gene products across all lines showing the ratio of reads mapped to the secondary allele compared to the primary allele for both the high and low XIST populations. (E) X chromosome map showing the ratio of reads derived from the secondary allele compared to the primary allele across chromosomal bands for both the high and low XIST populations. The size of the rectangles represents the number of gene products per band. (F) X chromosome map showing the log2 fold change (low/high XIST) across chromosomal bands for both the RNA-seq and proteomic datasets. The size of the rectangles represents the number of gene products per band. (G) Boxplot showing the Pearson correlation coefficient comparing log2 fold change (low/high XIST) at the RNa-seq and proteomics level for all chromosomes. Autosomes are colored in gray; the X chromosome is colored in red. (H) Bar plot showing the median log2 fold change (low/high XIST) for all gene products aggregated at the chromosome level for both RNA-seq and proteomics. The error bars represent the SEM.
Figure 3
Figure 3
Multi-omic overview For all boxplots, the bottom and top hinges represent the 1st and 3rd quartiles. The top whisker extends from the hinge to the largest value no further than 1.5 × IQR from the hinge; the bottom whisker extends from the hinge to the smallest value at most 1.5 × IQR of the hinge. (A) Volcano plot showing the log2 fold change (low/high XIST) on the x axis, with the −log10 p value on the y axis for the RNA-seq dataset. X chromosome transcripts are highlighted in red; autosome transcripts are colored gray. All transcripts above the orange line have a p value lower than 0.05. (B) Volcano plot showing the log2 fold change (low/high XIST) on the x axis, with the −log10 p value on the y axis for the proteomic dataset. X chromosome proteins are highlighted in red; autosomal proteins are colored gray. All proteins above the orange line have a p value lower than 0.05. (C) Boxplot showing the estimated protein content (see STAR Methods) for the high XIST, low XIST, and male populations. (D) Boxplot showing the sum of protein copy numbers across the X chromosome for the high XIST, low XIST, and male lines. (E) Boxplot showing the sum of protein copy numbers across all autosomes for the high XIST, low XIST, and male lines. (F) Boxplot showing the median protein log2 fold change (high XIST/Males and low XIST/Males) across all chromosomes.
Figure 4
Figure 4
Ribosome biogenesis For all boxplots, the bottom and top hinges represent the 1st and 3rd quartiles. The top whisker extends from the hinge to the largest value no further than 1.5 × IQR from the hinge; the bottom whisker extends from the hinge to the smallest value at most 1.5 × IQR of the hinge. (A) Boxplot showing the number of proteins with copy numbers greater than the 75th percentile and Razor + unique peptides greater than the 75th percentile for the simulations and the actual experimental data (see STAR Methods). (B) Boxplot showing the hypergeometric p value for proteins with copy numbers greater than the 75th percentile and Razor + unique peptides greater than the 75th percentile for the simulations and the actual experimental data (see STAR Methods). (C) Scatterplot showing the log2 fold change (low/high XIST) at the protein and RNA level. Ribosome biogenesis and cytoplasmic and mitochondrial ribosomal proteins are highlighted, and Pearson correlation coefficients are provided. (D) Schematic showing the cytoplasmic ribosome biogenesis proteins with proteins significantly increased in expression highlighted in orange. (E) Boxplot showing the protein copy numbers for SBDS, LSG1, and SPATA5 within the low and high XIST populations. (F) Boxplot showing the protein copy numbers for RIOK1 and RIOK2 within the low and high XIST populations. (G) Treemap plot showing the results of a biological process overrepresentation test focused on ribosome biogenesis proteins. The rectangle size is proportional to the enrichment level of the specific terms.
Figure 5
Figure 5
Ribosomes and translational initiation For all boxplots, the bottom and top hinges represent the 1st and 3rd quartiles. The top whisker extends from the hinge to the largest value no further than 1.5 × IQR from the hinge; the bottom whisker extends from the hinge to the smallest value at most 1.5 × IQR of the hinge. (A) Boxplot showing the copy numbers for the sum of all cytoplasmic ribosomal proteins within the high and low XIST populations. (B) Boxplot showing the copy numbers for the sum of all 60S (large ribosomal subunit) and 40S (small ribosomal subunit) proteins within the high and low XIST populations. (C) Boxplot showing the ratio of the sum of 60S to 40S ribosomal proteins within the high and low XIST populations. (D) Volcano plot showing the protein log2 fold change (low/high XIST) on the x axis, with the −log10 p value on the y axis. Ribosomal proteins and ribosomal S6 kinases are highlighted in pink; all other proteins are colored gray. All proteins above the orange line have a p value lower than 0.05. (E) Boxplot showing the ratio of reads mapped to the secondary allele compared to the primary allele for RPS6KA3 within the High, Medium and Low XIST populations. (F) Boxplot showing the log2 TPM of RPS6KA3 within the high, medium, and low XIST populations. (G) Boxplot showing the protein copy numbers of RPS6KA3 within the high, medium, and low XIST populations.
Figure 6
Figure 6
Translational machinery For all boxplots, the bottom and top hinges represent the 1st and 3rd quartiles. The top whisker extends from the hinge to the largest value no further than 1.5 × IQR from the hinge; the bottom whisker extends from the hinge to the smallest value at most 1.5 × IQR of the hinge. (A) Boxplot showing the ratio of reads mapped to the secondary allele (lowest expressed allele) compared to the primary allele (highest expressed allele) of EIF2S3 within the high, medium, and low XIST populations. (B) Boxplot showing the log2 TPM for EIF2S3 within the high, medium, and low XIST populations. (C) Boxplot showing the protein copy numbers for EIF2S3 within the high, medium, and low XIST populations. (D) Boxplot showing the ratio of reads mapped to the secondary allele compared to the primary allele for EIF1AX within the high, medium, and low XIST populations. (E) Boxplot showing the log2 TPM of EIF1AX within the high, medium, and low XIST populations. The bottom and top hinges represent the 1st and 3rd quartiles. (F) Boxplot showing the protein copy numbers of EIF1AX within the high, medium, and low XIST populations. (G) Schematic showing the protein copy numbers for the eIF4F complex and its inhibitors displayed for both the high and low XIST populations. Proteins represented by red boxes are significantly increased, light blue boxes are significantly decreased, and elements in gray boxes remain unchanged. (H) Ribo-Mega-SEC-derived line plot showing the mean high and low XIST polysome profile, with the colored ribbon representing the standard deviation.

Similar articles

Cited by

References

    1. Amid C., Alako B.T.F., Balavenkataraman Kadhirvelu V., Burdett T., Burgin J., Fan J., Harrison P.W., Holt S., Hussein A., Ivanov E. The European Nucleotide Archive in 2019. Nucleic Acids Res. 2020;48:D70–D76. - PMC - PubMed
    1. Anguera M.C., Sadreyev R., Zhang Z., Szanto A., Payer B., Sheridan S.D., Kwok S., Haggarty S.J., Sur M., Alvarez J. Molecular signatures of human induced pluripotent stem cells highlight sex differences and cancer genes. Cell Stem Cell. 2012;11:75–90. - PMC - PubMed
    1. Augui S., Nora E.P., Heard E. Regulation of X-chromosome inactivation by the X-inactivation centre. Nat. Rev. Genet. 2011;12:429–442. - PubMed
    1. Balaton B.P., Brown C.J. Escape Artists of the X Chromosome. Trends Genet. 2016;32:348–359. - PubMed
    1. Belling K., Russo F., Jensen A.B., Dalgaard M.D., Westergaard D., Rajpert-De Meyts E., Skakkebæk N.E., Juul A., Brunak S. Klinefelter syndrome comorbidities linked to increased X chromosome gene dosage and altered protein interactome activity. Hum. Mol. Genet. 2017;26:1219–1229. - PMC - PubMed

Publication types

LinkOut - more resources