. 2021 Apr 27;35(4):109034.
doi: 10.1016/j.celrep.2021.109034.

Post-Golgi carriers, not lysosomes, confer lysosomal properties to pre-degradative organelles in normal and dystrophic axons

Affiliations

Post-Golgi carriers, not lysosomes, confer lysosomal properties to pre-degradative organelles in normal and dystrophic axons

Pearl P Y Lie et al. Cell Rep. .

Abstract

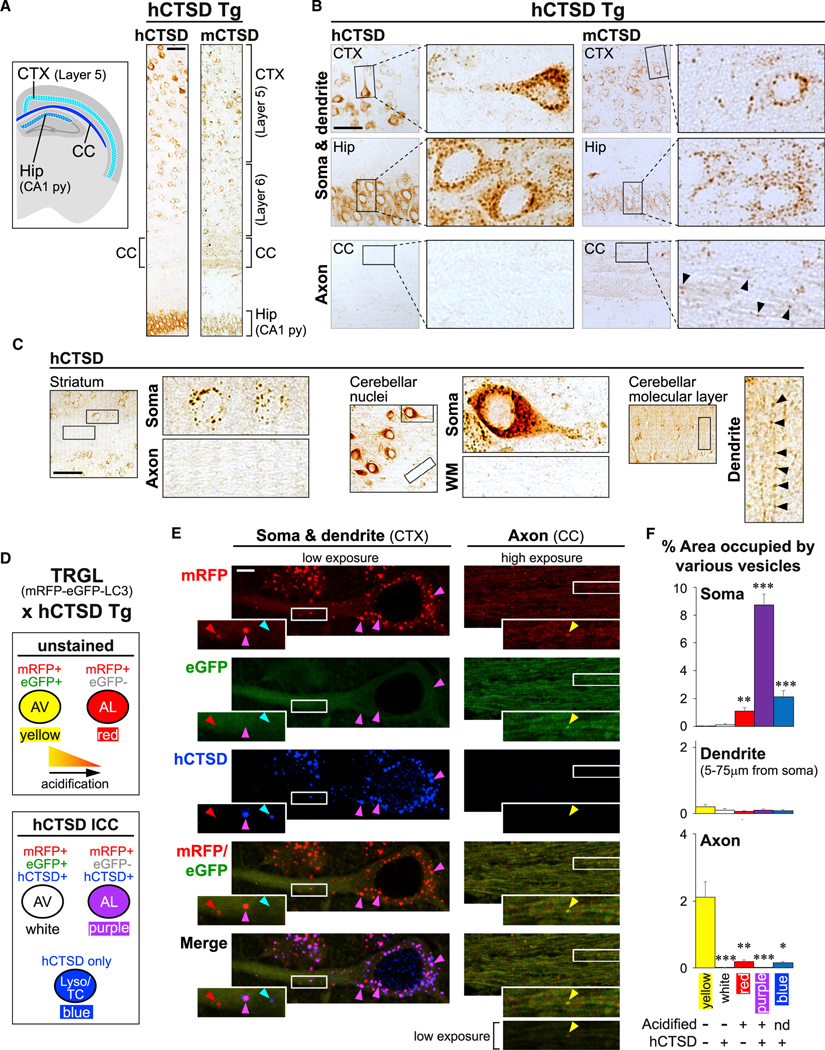
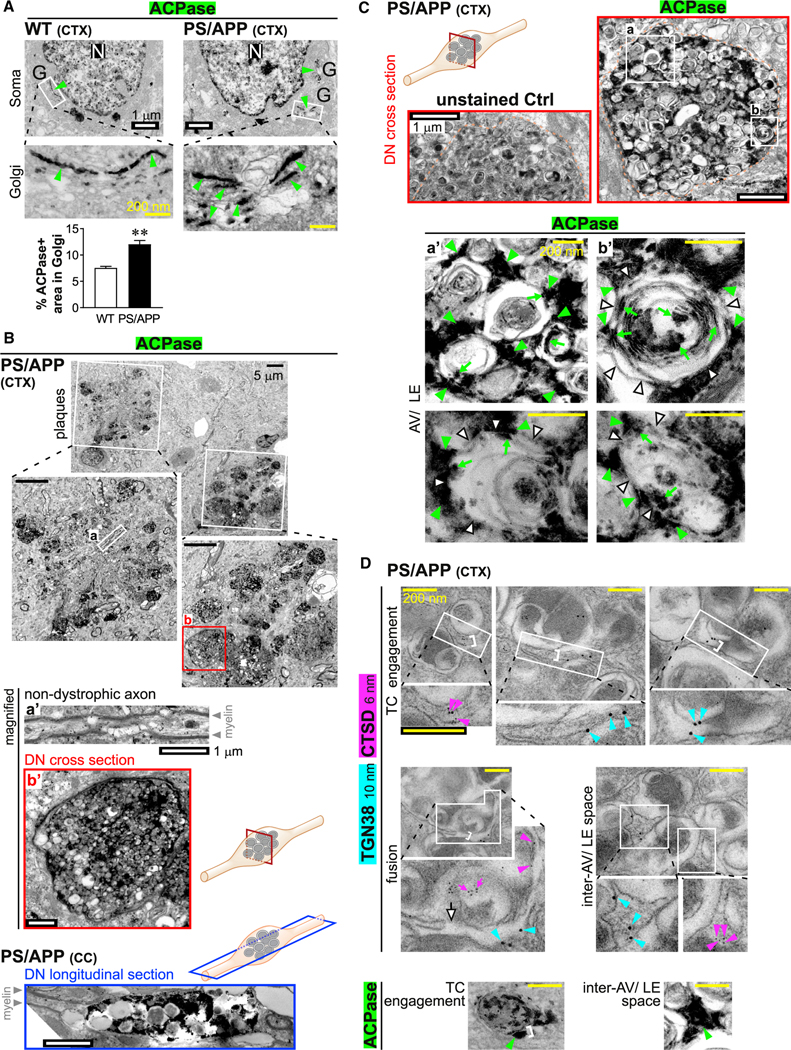
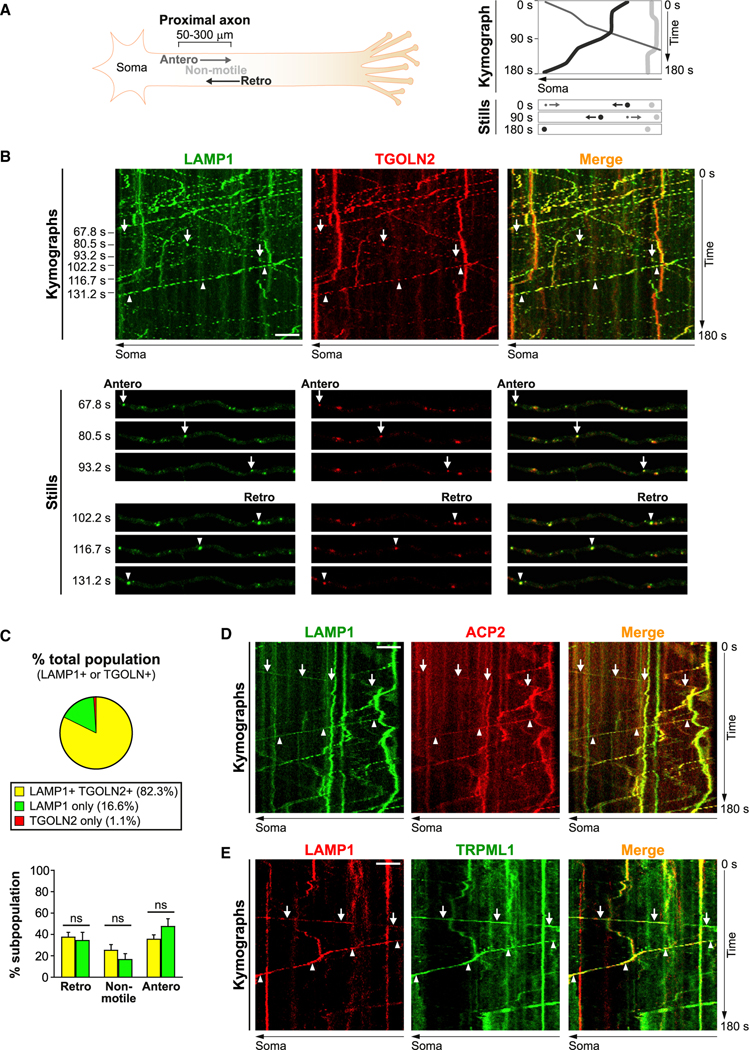
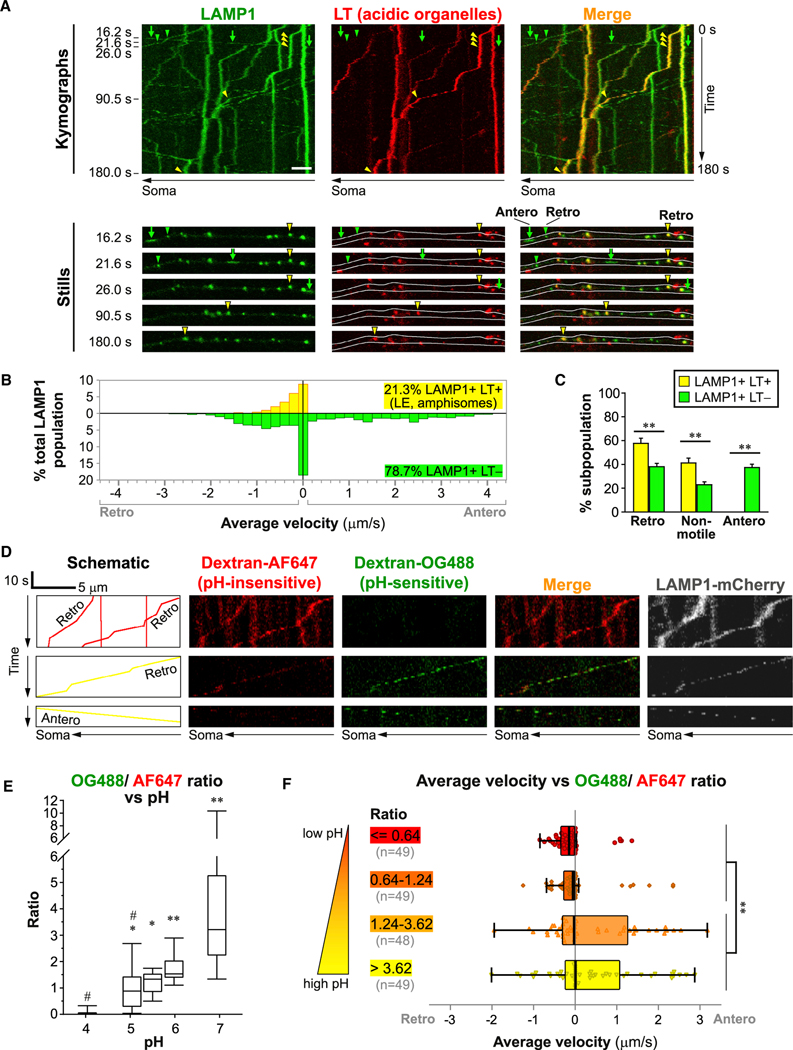
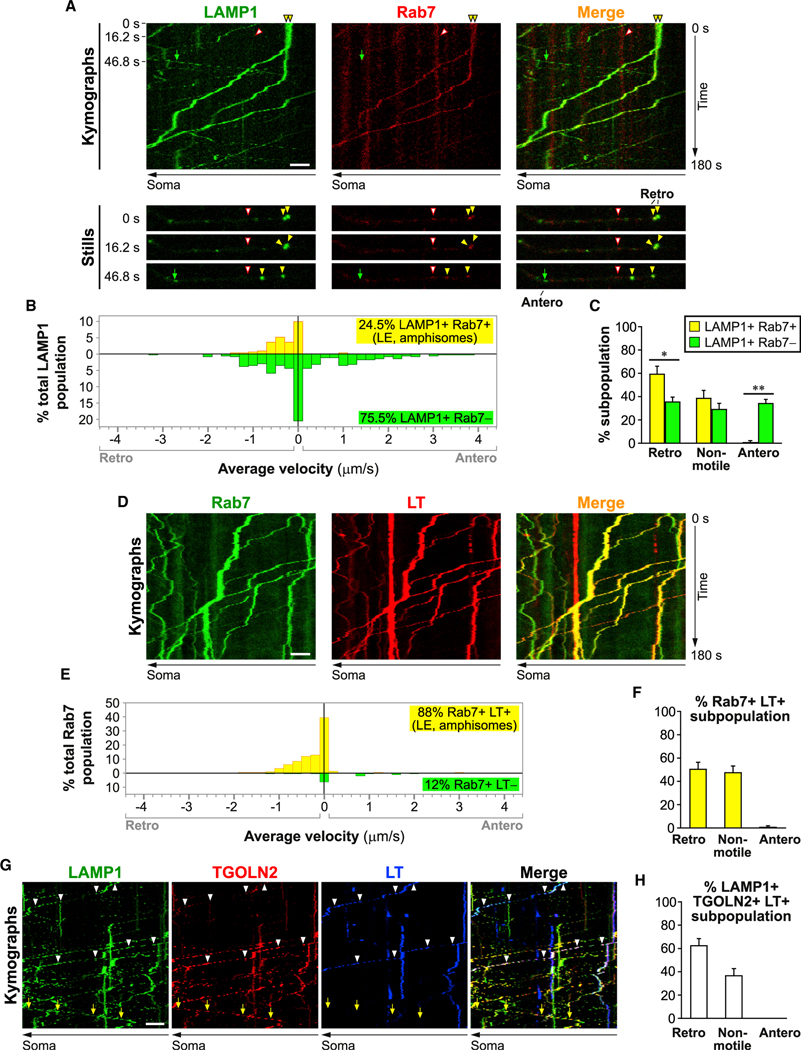
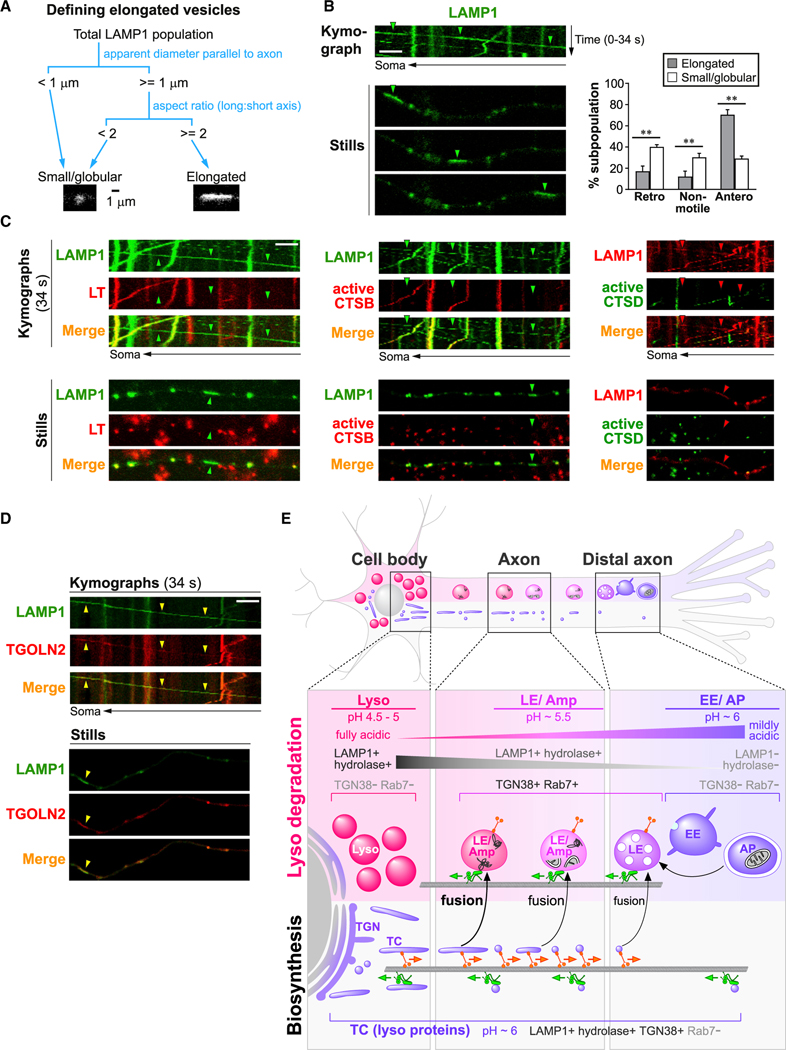
Lysosomal trafficking and maturation in neurons remain poorly understood and are unstudied in vivo despite high disease relevance. We generated neuron-specific transgenic mice to track vesicular CTSD acquisition, acidification, and traffic within the autophagic-lysosomal pathway in vivo, revealing that mature lysosomes are restricted from axons. Moreover, TGN-derived transport carriers (TCs), not lysosomes, supply lysosomal components to axonal organelles. Ultrastructurally distinctive TCs containing TGN and lysosomal markers enter axons, engaging autophagic vacuoles and late endosomes. This process is markedly upregulated in dystrophic axons of Alzheimer models. In cultured neurons, most axonal LAMP1 vesicles are weakly acidic TCs that shuttle lysosomal components bidirectionally, conferring limited degradative capability to retrograde organelles before they mature fully to lysosomes within perikarya. The minor LAMP1 subpopulation attaining robust acidification are retrograde Rab7+ endosomes/amphisomes, not lysosomes. Restricted lysosome entry into axons explains the unique lysosome distribution in neurons and their vulnerability toward neuritic dystrophy in disease.

Keywords: LAMP1; acidification; autophagic vacuole; axonal transport; late endosome; lysosome; post-Golgi traffic; transport carrier.


Conflict of interest statement

Declaration of interests The authors declare no competing interests.

Figures

Figure 1.
Figure 1.. Fully mature autolysosomes and lysosomes are restricted from axons in vivo
(A–C) Human CTSD transgenic (hCTSD Tg) mouse model expressing hCTSD specifically in neurons. (A) Schematic shows brain regions of interest. Tiled images on the right show DAB immunostaining against hCTSD or endogenous mouse CTSD (mCTSD) in hCTSD Tg brain sections. Scale bar, 100 μm. CTX, cortex; CC, corpus callosum; Hip, hippocampus; py, pyramidal cell layer. (B and C) Images showing hCTSD or mCTSD signals in specified brain regions. Magnified views of boxed areas are shown next to each low-magnification image. Arrowheads mark punctate signals within neurites. Scale bars, 100 μm. WM, white matter. (D–F) Double transgenic TRGL × hCTSD Tg mouse model expressing mRFP-eGFP-LC3 and hCTSD specifically in neurons. (D) Key for (E) and (F) explaining colors of different vesicle types after merging mRFP (red), eGFP (green, quenched by acidification), and immunostained hCTSD (blue). AV, autophagic vacuole; AL, autolysosome; Lyso, lysosome; TC, transport carrier. (E) Images of mRFP-eGFP-LC3 and immunostained hCTSD in CTX and CC of double transgenic brain sections. Magnified views of boxed areas are shown as insets. All axon images are shown at increased brightness (consistent across all channels) except for bottom image (original brightness shown as reference). Scale bar, 5 μm. (F) Graphs showing percentage of area in soma, dendrite, and axon occupied by different vesicle types. Bars, mean ± SEM (n = 28 soma, 25 dendrites, 24 high-magnification axonal images: dimensions = 53 × 18 μm, each contains >20 axonal segments). *p < 0.05, **p < 0.01, ***p < 0.0001, Kruskal-Wallis test followed by Dunn’s multiple comparisons against “yellow.” See also Figure S1.
Figure 2.
Figure 2.. Lysosomes with classic ultrastructure are restricted from axons in vivo
(A–D) Electron micrographs of immunogold labeling of TGN38 (10 nm gold, cyan arrowheads) alone or co-labeled with CTSD or hCTSD (6 nm gold, magenta arrowheads) in wild-type and hCTSD Tg mouse brains, respectively. (A) Top left, overview of a soma within the cortex (CTX). Magnified view of white box (inset) and additional image on right show Golgi cisternae and associated vesicles. Black boxes (a, b) are magnified below (a’, b’). Scale bars, white = 500 nm; black = 100 nm. N, nucleus; Lyso, lysosome; LE, late endosome, MVB, multivesicular body. (B, D) Low-magnification top images show regions within myelinated axons in corpus callosum (CC). Magnified views of white boxes and additional high-magnification images show TGN-derived transport carriers (TCs) with TGN38 and CTSD labeling. Scale bars, 100 nm. (C) Quantification of CTSD and TGN38 immunogold densities on various organelles. Bars, mean ± SEM (n = no. of organelles indicated above bars; pooled data from single and double labeling). **p < 0.01, Kruskal-Wallis test followed by Dunn’s multiple comparisons against mitochondria (Mito) as negative Ctrl. AV, autophagic vacuole. (E–H) Electron micrographs of histochemical ACPase labeling (green arrowheads/asterisks) in wild-type mouse brains. (E) Overview of a somal region within the CTX with magnified view of white boxes in insets and an additional image on right showing an ACPase signal in lysosomes and Golgi. Scale bars, 500 nm. (F) Tiled images on top show overview of a somal region with the attached neurite. White boxes (a–d) are magnified below (a’–d’). Scale bars, 500 nm. (G and H) Low-magnification images on top show regions within myelinated axons in CC. Magnified views of white boxes and additional high-magnification images show TCs and AVs with an ACPase signal. Scale bars,100 nm. (H) White arrows, double membrane of AVs; green arrowheads, ACPase engaged to exterior of AVs; green asterisks, ACPase incorporated into AVs. See also Figure S2.
Figure 3.
Figure 3.. TGN-derived transport carriers (TCs), not lysosomes, accumulate in dystrophic axons in PS/APP mouse brains
Electron micrographs of (A–C) histochemical ACPase labeling and (D) immunogold labeling of TGN38 and CTSD in PS/APP mouse brains. (A) Top images show overviews of soma in wild-type (WT) and PS/APP cortex (CTX). White boxes (magnified below) mark Golgi stacks with an ACPase signal (green arrowheads). Scale bars, white = 1 μm; yellow = 200 nm. N, nucleus; G, Golgi. Graph shows percentage of area in Golgi occupied by ACPase. Bar, mean ± SEM (n = 46 WT somas; 37 PS/APP somas). **p < 0.01, Student’s t test. (B) Top image shows overview of a neuropil region in PS/APP CTX with a plaque-associated ACPase signal. Plaques marked by white boxes are magnified below. Boxed regions (a) and (b) are further magnified below: (a’) shows a non-dystrophic axon; (b’) shows a dystrophic neurite (DN) (cross-section; corresponding to red box in schematic). Bottom image shows a DN (longitudinal section; corresponding to blue box in schematic) in PS/APP corpus callosum (CC). Scale bars, black, 5 μm; white, 1 μm. (C) Top low-magnification electron micrographs show unstained Ctrl and ACPase-labeled DN (cross-sections; corresponding to red box in schematic) in PS/APPCTX. Orange dotted lines mark boundaries of DN. Boxes (a, b) are magnified in (a’, b’). High-magnification images show an ACPase signal associated with accumulated autophagic vacuoles (AVs) and late endosomes (LEs). White arrowheads, AVs/LEs limiting membrane; green arrowheads, ACPase engaged to exterior of AVs/LEs; green arrows, ACPase incorporated within AVs/LEs. Scale bars, white, 1 μm; yellow, 200 nm. (D) Immunogold labeling of TGN38 (10 nm gold; cyan arrowheads) and CTSD (6 nm gold; magenta arrowheads) in TCs engaged to or fusing with accumulated AVs/LEs within DN. White brackets show the consistent width (~50 nm) of tubulovesicular TCs. Each white box is magnified in the image below (all magnified views are at the same magnification). Scale bars, 200 nm. White arrow, TC-AV membrane fusion; magenta arrows, incorporated CTSD. Bottom images show similar profiles with histochemical ACPase labeling (green arrowheads; previously shown in Figure 2H and Figure 3C a’).
Figure 4.
Figure 4.. LAMP1 co-transports with other lysosomal proteins bidirectionally in axons
(A) Schematic of axonal time-lapse imaging experiments followed by analyses of kymographs. Antero, anterograde; retro, retrograde. (B–E) Time-lapse imaging in axonal segments of neurons co-expressing LAMP1-YFP and TGOLN2-mCherry (B-C), LAMP1-YFP and ACP2-mCherry (D), or LAMP1-mCherry and TRPML1-eGFP (E). (B, D, E) Representative kymographs and still images. Complete arrows and arrowheads respectively denote anterograde and retrograde motility. Scale bar, 5 μm. (C) Top panel, pie chart showing percentage of vesicles with LAMP1 and/or TGOLN2 positivity (mean of 10 cells). Bottom panel, percentage of retrograde, non-motile (<0.1 μm/s) and anterograde vesicles in each LAMP1 vesicle subpopulation. Bars, mean ± SEM (n = 10 cells; ns, not significant, Mann-Whitney U test). See also Figures S3, S4, and S6.
Figure 5.
Figure 5.. Acidic LAMP1 vesicles undergo retrograde axonal transport
Time-lapse imaging in axonal segments of neurons expressing LAMP1-YFP co-labeled with LysoTracker (LT)-Red (A–C) or expressing LAMP1-mCherry co-labeled with dextran-Oregon Green 488 (OG488) and dextran-Alexa Fluor 647 (AF647) (D–F). (A) Representative kymographs and still images. Scale bar, 5 μm. White outlines in stills mark the axonal profile. Complete arrows and arrowheads respectively denote anterograde (Antero) and retrograde (Retro) motility. (B) Histogram showing the distribution of average velocities in LAMP1 vesicle subpopulations (n = 1,048 vesicles in 19 cells). (C) Percentage of retrograde, non-motile (<0.1 μm/s) and anterograde vesicles in each LAMP1 vesicle subpopulation. Bars, mean ± SEM (n = 19 cells; **p < 0.01, Mann-Whitney U test). (D) Schematic and kymographs showing trajectories of several representative vesicles. Identical adjustments have been applied to all dextran images. (E) Box-and-whisker plots showing effect on OG488/AF647 ratio in endocytically derived organelles in soma of neurons equilibrated to designated pH (n ≥ 8 cells; *p < 0.05, **p < 0.01 against “pH 4,” #p < 0.01 against “pH 7,” Kruskal-Wallis test followed by Dunn’s multiple comparisons). (F) Box-and-whisker plots with individual data points showing average velocity versus OG488/AF647 ratio (n = 195 vesicles from 11 cells; **p < 0.01, Kolmogorov-Smirnov test). See also Figures S3–S6.
Figure 6.
Figure 6.. Axonal late endosomes are acidic and undergo retrograde axonal transport
Time-lapse imaging in axonal segments of neurons expressing LAMP1-YFP and Rab7-DsRed (A–C), or expressing Rab7-eGFP co-labeled with LysoTracker (LT)-Red (D–F), or co-expressing LAMP1-YFP, TGOLN2-mCherry, and co-labeled with LT-Deep Red (G and H). (A, D, and G) Representative kymographs and still images. Scale bar, 5 μm. Complete arrows, anterograde; closed arrowheads, retrograde: open arrowheads, non-motile. (B and E) Histograms showing the distribution of average velocities in LAMP1 vesicle subpopulations (n = 335 vesicles in 7 cells) and Rab7 vesicle subpopulations (n = 208 vesicles in 10 cells). Retro, retrograde; Antero, anterograde. (C, F, and H) Percentage of retrograde, non-motile (<0.1 μm/s) and anterograde vesicles in specified LAMP1 vesicle subpopulations (C) (n = 7 cells), Rab7+ LT+ vesicle subpopulation (F) (n = 10 cells) and LAMP1+ TGOLN+ LT+ vesicle subpopulation (H) (n = 14 cells). Bars, mean ± SEM (*p < 0.05, **p < 0.01, Mann-Whitney U test). See also Figures S3–S6.
Figure 7.
Figure 7.. Elongated LAMP1 vesicles are anterograde biased and enzymatically inactive
(A) Schematic showing criteria for classification of LAMP1 vesicles into small/globular and elongated categories. (B–D) Time-lapse imaging in axonal segments of neurons expressing LAMP1-YFP or LAMP1-mCherry, either co-expressing other fluorescently tagged lysosomal proteins or co-labeled with vital dyes as specified. Representative kymographs and still images are shown. Arrowheads show examples of elongated and anterograde vesicles. Scale bars, 5 μm. LT, LysoTracker-Red labeled; active CTSB, Magic Red-cathepsin B labeled; active CTSD, Bodipy-Pepstatin A labeled. (B) Graph on right shows percentage of retrograde (retro), non-motile (<0.1 μm/s), and anterograde (antero) vesicles in each LAMP1 vesicle subpopulation. Bars, mean ± SEM (n = 8 cultures with a total of 114 elongated and 2,295 small/globular LAMP1 vesicles; **p < 0.01, Mann-Whitney U test). See also Figures S5 and S6 and Table S1. (E) Hypothetical model showing maturation, trafficking, and interactions of organelles of autophagy/endo-lysosomal and biosynthetic pathways in axons. Immature early endosomes (EE) and autophagosomes (AP) are concentrated in distal axon and mature into late endosomes (LEs) and amphisomes (Amp), which undergo continuous maturation and retrograde transport while gaining lysosomal components from bidirectional TGN-derived transport carriers (TCs). LEs/amphisomes attain partial acidification and degradative capability before reaching full maturation into lysosomes (Lyso) in perikarya. Organelle colors depict lumenal acidification (purple, mildly acidic; pink, moderately acidic; magenta, fully acidic).

Similar articles

Cited by

References

    1. Abeliovich A, and Gitler AD (2016). Defects in trafficking bridge Parkinson’s disease pathology and genetics. Nature 539, 207–216. - PubMed
    1. Andrä K, Abramowski D, Duke M, Probst A, Wiederhold KH, Bürki K, Goedert M, Sommer B, and Staufenbiel M. (1996). Expression of APP in transgenic mice: a comparison of neuron-specific promoters. Neurobiol. Aging 17, 183–190. - PubMed
    1. Ashrafi G, Schlehe JS, LaVoie MJ, and Schwarz TL (2014). Mitophagy of damaged mitochondria occurs locally in distal neuronal axons and requires PINK1 and Parkin. J. Cell Biol 206, 655–670. - PMC - PubMed
    1. Authier F, Posner BI, and Bergeron JJ (1996). Endosomal proteolysis of internalized proteins. FEBS Lett. 389, 55–60. - PubMed
    1. Bagh MB, Peng S, Chandra G, Zhang Z, Singh SP, Pattabiraman N, Liu A, and Mukherjee AB (2017). Misrouting of v-ATPase subunit V0a1 dysregulates lysosomal acidification in a neurodegenerative lysosomal storage disease model. Nat. Commun 8, 14612. - PMC - PubMed

Publication types

LinkOut - more resources