. 2021 Sep 2;28(9):1533-1548.e6.
doi: 10.1016/j.stem.2021.04.004. Epub 2021 Apr 27.

Age-dependent instability of mature neuronal fate in induced neurons from Alzheimer's patients

Affiliations

Age-dependent instability of mature neuronal fate in induced neurons from Alzheimer's patients

Jerome Mertens et al. Cell Stem Cell. .

Abstract

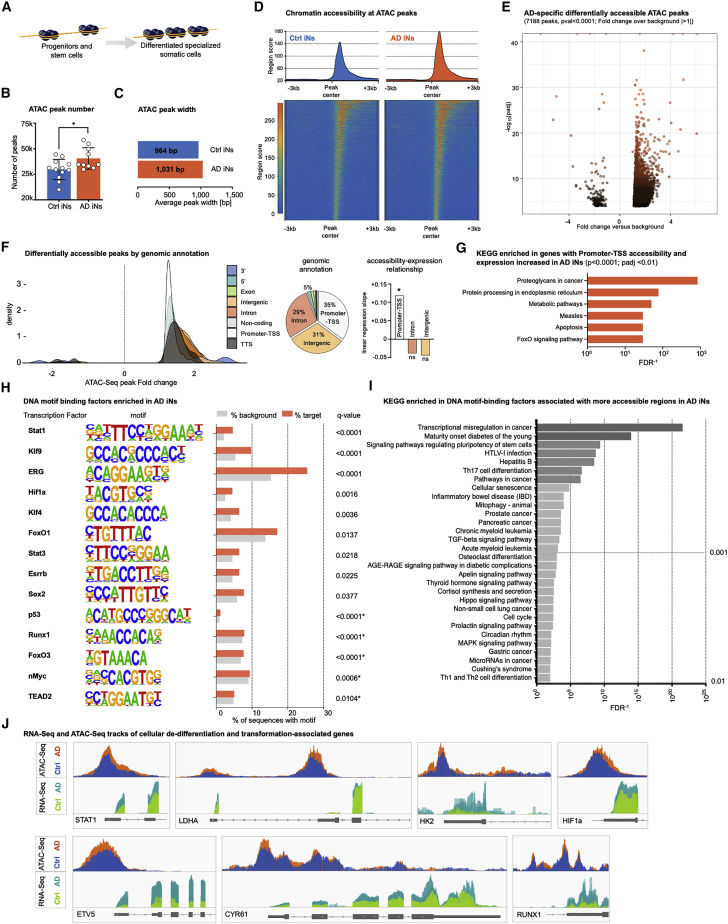
Sporadic Alzheimer's disease (AD) exclusively affects elderly people. Using direct conversion of AD patient fibroblasts into induced neurons (iNs), we generated an age-equivalent neuronal model. AD patient-derived iNs exhibit strong neuronal transcriptome signatures characterized by downregulation of mature neuronal properties and upregulation of immature and progenitor-like signaling pathways. Mapping iNs to longitudinal neuronal differentiation trajectory data demonstrated that AD iNs reflect a hypo-mature neuronal identity characterized by markers of stress, cell cycle, and de-differentiation. Epigenetic landscape profiling revealed an underlying aberrant neuronal state that shares similarities with malignant transformation and age-dependent epigenetic erosion. To probe for the involvement of aging, we generated rejuvenated iPSC-derived neurons that showed no significant disease-related transcriptome signatures, a feature that is consistent with epigenetic clock and brain ontogenesis mapping, which indicate that fibroblast-derived iNs more closely reflect old adult brain stages. Our findings identify AD-related neuronal changes as age-dependent cellular programs that impair neuronal identity.

Keywords: Alzheimer's disease; aging; de-differentiation; induced neurons (iNs); neuronal cell cycle re-entry; rejuvenation.


Conflict of interest statement

Declaration of interests F.H.G. is an advisory board member of Cell Stem Cell.

Figures

None
Graphical abstract
Figure 1
Figure 1
Induced neurons (iNs) from a cohort of AD patients and controls (A and B) Generation of fibroblast-derived iNs (A) from a cohort of mostly sporadic AD patients and age-matched controls (B). (C) Phase contrast and immunofluorescence images for vimentin, βIII-tubulin, and NeuN. Scale bars, 100 μm. (D–G) Quantification of immunofluorescence images for βIII-tubulin/DAPI pre- and post-FACS isolation for PSA-NCAM (D), NeuN/ βIII-tubulin (E), vGlut1/MAP2 (F), and GABA/βIII-tubulin (G) of control and AD iNs; 3 weeks conversion. Circles, subjects. Bars, mean ± SD. (H) Glutamatergic and GABAergic marker gene expression in iNs, fibroblasts, and prefrontal cortex (PFC) samples. Green, low expression, and red, high expression, based on variance stabilizing transformation (vst)-normalized counts. (I) ELISA Aβ42/40 ratios in FACS-purified young (n = 3), old control (n = 10), sporadic AD (n = 9), and familial AD (n = 2) subject-derived iNs; 4 weeks conversion. Bars, mean ± SD.∗∗∗p < 0.0001 (one-way ANOVA). See also Figure S1 and Tables S1 and S2.
Figure 2
Figure 2
AD-specific transcriptome signatures in patient-derived iNs (A) Volcano plot for control versus AD DE genes in fibroblasts (n = 16 versus 17) and iNs (n = 15 versus 13). (B and C) Heatmap for highly significant (padj < 0.01) AD iN DE genes of control and AD iNs (B) and tSNE clustering on the basis of these genes (C). (D) Heatmap showing average gene expression changes of previously published down- and upregulated post-mortem AD gene sets in iNs. (E and F) Gene set enrichment analyses of downregulated (E) and upregulated (F) genes that are commonly changed in the same direction in AD iNs and post-mortem brain. Pie charts depict fractions of overlapping genes, and bar graphs show gene sets from the top 10 (by FDR) of each category. (G) Schematic drawing summarizing single-nucleus RNA-seq (snRNA-seq) AD DE analysis in post-mortem neurons, oligodendrocytes, microglia, astrocytes, and oligodendrocyte precursor cells (OPCs) (Grubman et al., 2019). Venn diagram showing overlapping and cell-type-exclusive AD DE genes for the individual cell types. (H) Comparison of AD iN transcriptomes with snRNA-seq cell types. Heatmap shows the fractions of overlapping cell-type-specific and cell-type-exclusive genes and linear regression slope and fit values. (I) GSEA of down- and upregulated genes that are commonly changed in the same direction in AD iNs and post-mortem snRNA-seq neurons. Bar graphs show gene sets from within the top 10 (by FDR) of each category. See also Figures S1 and S2 and Tables S3 and S4.
Figure 3
Figure 3
AD iNs downregulate mature neuronal features (A) Enriched GO terms in significantly downregulated AD iN genes in redundancy-trimmed semantic space. (B) Top significantly enriched GO terms within significant AD iN downregulated genes and enrichment of the same and similar gene sets in bulk and AD brain data and in snRNA-seq AD neurons. (C) Violin plot showing expression changes in control versus AD iNs of published gene sets that represent mature neuronal identity. Significance values for each gene set are based on comparison with fibroblast and iPSC-iNs from the same cohort (Figures S5H and S5I). (D) Bar graphs showing fold changes and significance of downregulated mature neuronal marker genes in AD versus control iNs. All marker genes are part of mature neuronal gene sets in (C). (E) Neuronal morphology reconstruction images of representative control and AD iN cultures. (F) Morphological complexity scores of control (n = 8) and AD iNs (n = 8). Circles, subjects. Bars, mean ± SD; unpaired t test. (G) Immunostaining for synapsin/PSD-95 co-localization along iN neurites following 4 weeks of conversion. Black arrows, double-labeled punctae; white arrows, single-labeled puncta, white box, magnified field; scale bar, 100 μm. (H) Quantification of synaptic densities by synapsin punctae and synapsin/PSD-95 co-localized punctae in control (n = 7) and AD (n = 7) iNs. Circles, subjects. Bars, mean ± SD, unpaired t test. (I) Ca2+ event number in control (n = 160 cells; five donors) and AD neurons (n = 184 cells; five donors). Violin plot; Kruskal-Wallis test. ∗∗p < 0.01. (J) Ca2+ event distribution of control and AD iN samples. p < 0.05, ∗∗p < 0.01, and ∗∗∗p < 0.001. See also Table S5.
Figure 4
Figure 4
Activation of immature neuronal and cellular transformation-like signatures in AD iNs (A) Enriched GO terms in significantly upregulated AD iN genes in redundancy-trimmed semantic space. (B and C) Top significantly enriched GO terms (B) and KEGG pathways (C) within significant AD iN upregulated genes and enrichment of the same gene sets in post-mortem AD brain data. (D) Violin plots showing expression changes in control versus AD iNs of representative published gene sets. Significance values for each gene set are based on comparison with fibroblast and iPSC-iNs from the same cohort (Figures S5H and S5I). (E) Bar graphs showing the fold changes and significance of upregulated de-differentiation marker genes in AD versus control iNs. All marker genes are part of the dysregulated gene sets in (D). (F) Similarity profiles of AD and control iNs to the neuronal differentiation trajectory represented as linear regression fit and standard error (shaded regions). The neuronal differentiation trajectory is based on longitudinal mRNA-seq of iPSC-derived neural stem cell (NSC) differentiation into neurons (n = 3 iPSC donor lines) (Schafer et al., 2019). (G) Gene interaction map and expression fold changes (bar graphs) of neuronal differentiation trajectory genes. Left and top: up in AD iNs and down in differentiation. Right and bottom: down in AD iNs and up in differentiation. Colored nodes in interaction map indicate cell cycle, synapse, and ion channel genes. See also Figure S3 and Table S5.
Figure 5
Figure 5
AD iNs display markers of hypo-maturity and cell cycle re-entry, but no completed cell cycle (A) Total ROS in FACS-purified control (n = 9) and AD (n = 11) iNs; 4 weeks conversion. Circles, subjects. Bars, mean ± SEM, unpaired t test. (B) Longitudinal mRNA-seq expression levels of CCNB1 and CDK2 during differentiation of NSCs into 14 day neurons. Circles, subjects; linear regression (n = 3 iPSC-NSC lines). (C and D) Immunofluorescence analysis of control (n = 7) and AD (n = 8) iNs for cyclin B1. Quantification of mean fluorescence intensities (MFIs) of cyclin B1 within βIII-tub+ neuron areas. Circles, subjects. Bars, mean ± SEM, unpaired t test (C). Representative immunofluorescence images show intensity and distribution of cyclin B1 immunoreactivity in iNs (D). (E and F) Fluorescence image of control (n = 9) and AD (n = 9) iNs stained for DNA replication following 3 weeks of iN conversion and 72 h of EdU exposure. No βIII-tub+ neurons with EdU+ nuclei (arrow) were detected. Circles, subjects. (G) Expression levels of marker genes LDHA and HK2 during differentiation of iPSC NSCs into 14 day neurons. Circles, subjects; linear regression (n = 3 iPSC lines). (H and I) Immunofluorescence analysis of control (n = 11) and AD (n = 7) iNs for LDHA. Black arrows indicate βIII-tub+ neurons without LDHA, and white arrows indicate βIII-tub/LDHA double-positive neurons (H). MFIs of LDHA signal within βIII-tub+ neuron areas (left) and quantification of strongly double-positive cells (right). Circles, subjects. Bars, mean ± SEM, unpaired t tests (I). p < 0.05, ∗∗p < 0.01, and ∗∗∗p < 0.001. See also Figure S2.
Figure 6
Figure 6
Execution of a malignant epigenetic program underlies hypo-mature neuronal state of AD iNs (A) Schematic for globally open chromatin landscape in stem/progenitor cells and closed chromatin landscape in mature cells. (B and C) Number (B) and width (C) of open chromatin ATAC-seq peaks in control (n = 11) and AD (n = 10) iNs. Circles, donors. Bars, mean ± SD unpaired t test, p < 0.05. (D) Chromatin accessibility region scores centered around peak regions. (E) Volcano plot depicting control (n = 11) versus AD (n = 10) iN differentially accessible ATAC-seq peaks. Plot shows all 7,188 peaks with p < 0.0001 and a fold change | >1|. (F) Density plot for differential accessibility ATAC-seq peak fold changes separated by genomic annotation (left). Pie chart shows peak fractions per annotation (middle). Bar graph shows linear regression slopes between ATAC-seq peak accessibility and RNA-seq expression in promoter-TSS, intronic, and intergenic differential peaks (right). Asterisk, regression p < 0.05. (G) GSEA for genes with significantly increased promoter-TSS peak accessibility and elevated gene expression in AD iNs. Bar graph shows top significantly enriched KEGG pathways. (H) Motif enrichment analysis of AD differentially open peaks. DNA-binding transcription factor names, corresponding stacked motif sequences, bar graph for percentages of target and background sequences with motif, and q values for motif enrichment (q values based on differential peak analysis or with control as background when marked with asterisk). (I) Gene set enrichment analysis of the DNA-binding factors that correspond to all significantly enriched motifs. Bar graph shows top significantly enriched KEGG pathways. (J) RNA-seq and ATAC-seq Genome Browser tracks of representative non-neuronal genes (upregulated expression and increased promoter accessibility in AD iNs) considered incompatible with neuronal identity. See also Figure S4 and Table S6.
Figure 7
Figure 7
AD signature depends on old adult ontogenic identity of iNs that is depleted via iPSC rejuvenation (A) Schematic for generation of iPSC-derived induced neurons (iPSC-iNs) from fibroblast cohort. (B) Phase contrast and immunostaining of iPSC for Nanog and of iPSC-iNs for EGFP, Map2, βIII-tubulin, and NeuN. Scale bars, 100 μm. (C) tSNE plot of transcriptomes from fibroblasts (n = 32), iNs (n = 28; 3 weeks), iPSCs (n = 21), and iPSC-iNs (n = 20; 3 weeks), clustering into four distinct groups. (D) Heatmap showing transcriptome-wide correlation between iNs and iPSC-iNs and adult human cortex-derived excitatory neurons (Ex), inhibitory neurons (In), astrocytes (Ast), oligodendrocytes (Oli), and OPCs (snRNA-seq data; Mathys et al., 2019). (E) Correlation of fibroblasts, iPSCs, iNs, and iPSC-iNs to the merged transcriptomes of seven adult human brain regions from the Allen BrainSpan dataset. (F) Volcano plots depicting control versus AD DE genes in iPSCs (n = 9 versus 12), and iPSC-iNs (n = 8 versus 12). (G) DNAm ages of iNs and fibroblasts compared with the chronological ages of their donors and of hPSCs, NSCs, and neurons compared with time in vitro (Kim et al., 2014) as reference. (H and I) DNAm ages of control and AD iNs compared with the DNAm ages of their parental fibroblasts (H) and DNAm age acceleration between iN and fibroblasts (I). (J) Expression changes of iN upregulated and downregulated iN aging genes (Mertens et al., 2015a) in AD iNs. (K and L) Ontogenic neural identity: iN and iPSC-iN transcriptomes were correlated to the 163 fetal (8–37 post-conceptual week [pcw]) and 52 adult (23–40 years) cortical BrainSpan samples (K). Transcriptome similarity of iNs and iPSC-iNs plotted to human cortical samples ranging from fetal to adult (L). (M) RRHO mapping of the transcriptional overlap between pre-natal versus adult human brain and between iPSC-iNs versus iN differences. See also Figures S5–S7 and Table S7.

References

    1. Allen M., Carrasquillo M.M., Funk C., Heavner B.D., Zou F., Younkin C.S., Burgess J.D., Chai H.-S., Crook J., Eddy J.A. Human whole genome genotype and transcriptome data for Alzheimer’s and other neurodegenerative diseases. Sci. Data. 2016;3:160089. - PMC - PubMed
    1. Alzheimer’s Association 2015 Alzheimer’s disease facts and figures. Alzheimers Dement. 2015;11:332–384. - PubMed
    1. Andreadis A. Tau gene alternative splicing: expression patterns, regulation and modulation of function in normal brain and neurodegenerative diseases. Biochim. Biophys. Acta Bba - Mol Basis Dis. 2005;1739:91–103. - PubMed
    1. Annese A., Manzari C., Lionetti C., Picardi E., Horner D.S., Chiara M., Caratozzolo M.F., Tullo A., Fosso B., Pesole G., D’Erchia A.M. Whole transcriptome profiling of Late-Onset Alzheimer’s Disease patients provides insights into the molecular changes involved in the disease. Sci. Rep. 2018;8:4282. - PMC - PubMed
    1. Arbab M., Baars S., Geijsen N. Modeling motor neuron disease: the matter of time. Trends Neurosci. 2014;37:642–652. - PubMed

Publication types