. 2021 Jun;594(7862):271-276.
doi: 10.1038/s41586-021-03562-8. Epub 2021 Apr 28.

PIK3CA and CCM mutations fuel cavernomas through a cancer-like mechanism

Affiliations

PIK3CA and CCM mutations fuel cavernomas through a cancer-like mechanism

Aileen A Ren et al. Nature. 2021 Jun.

Abstract

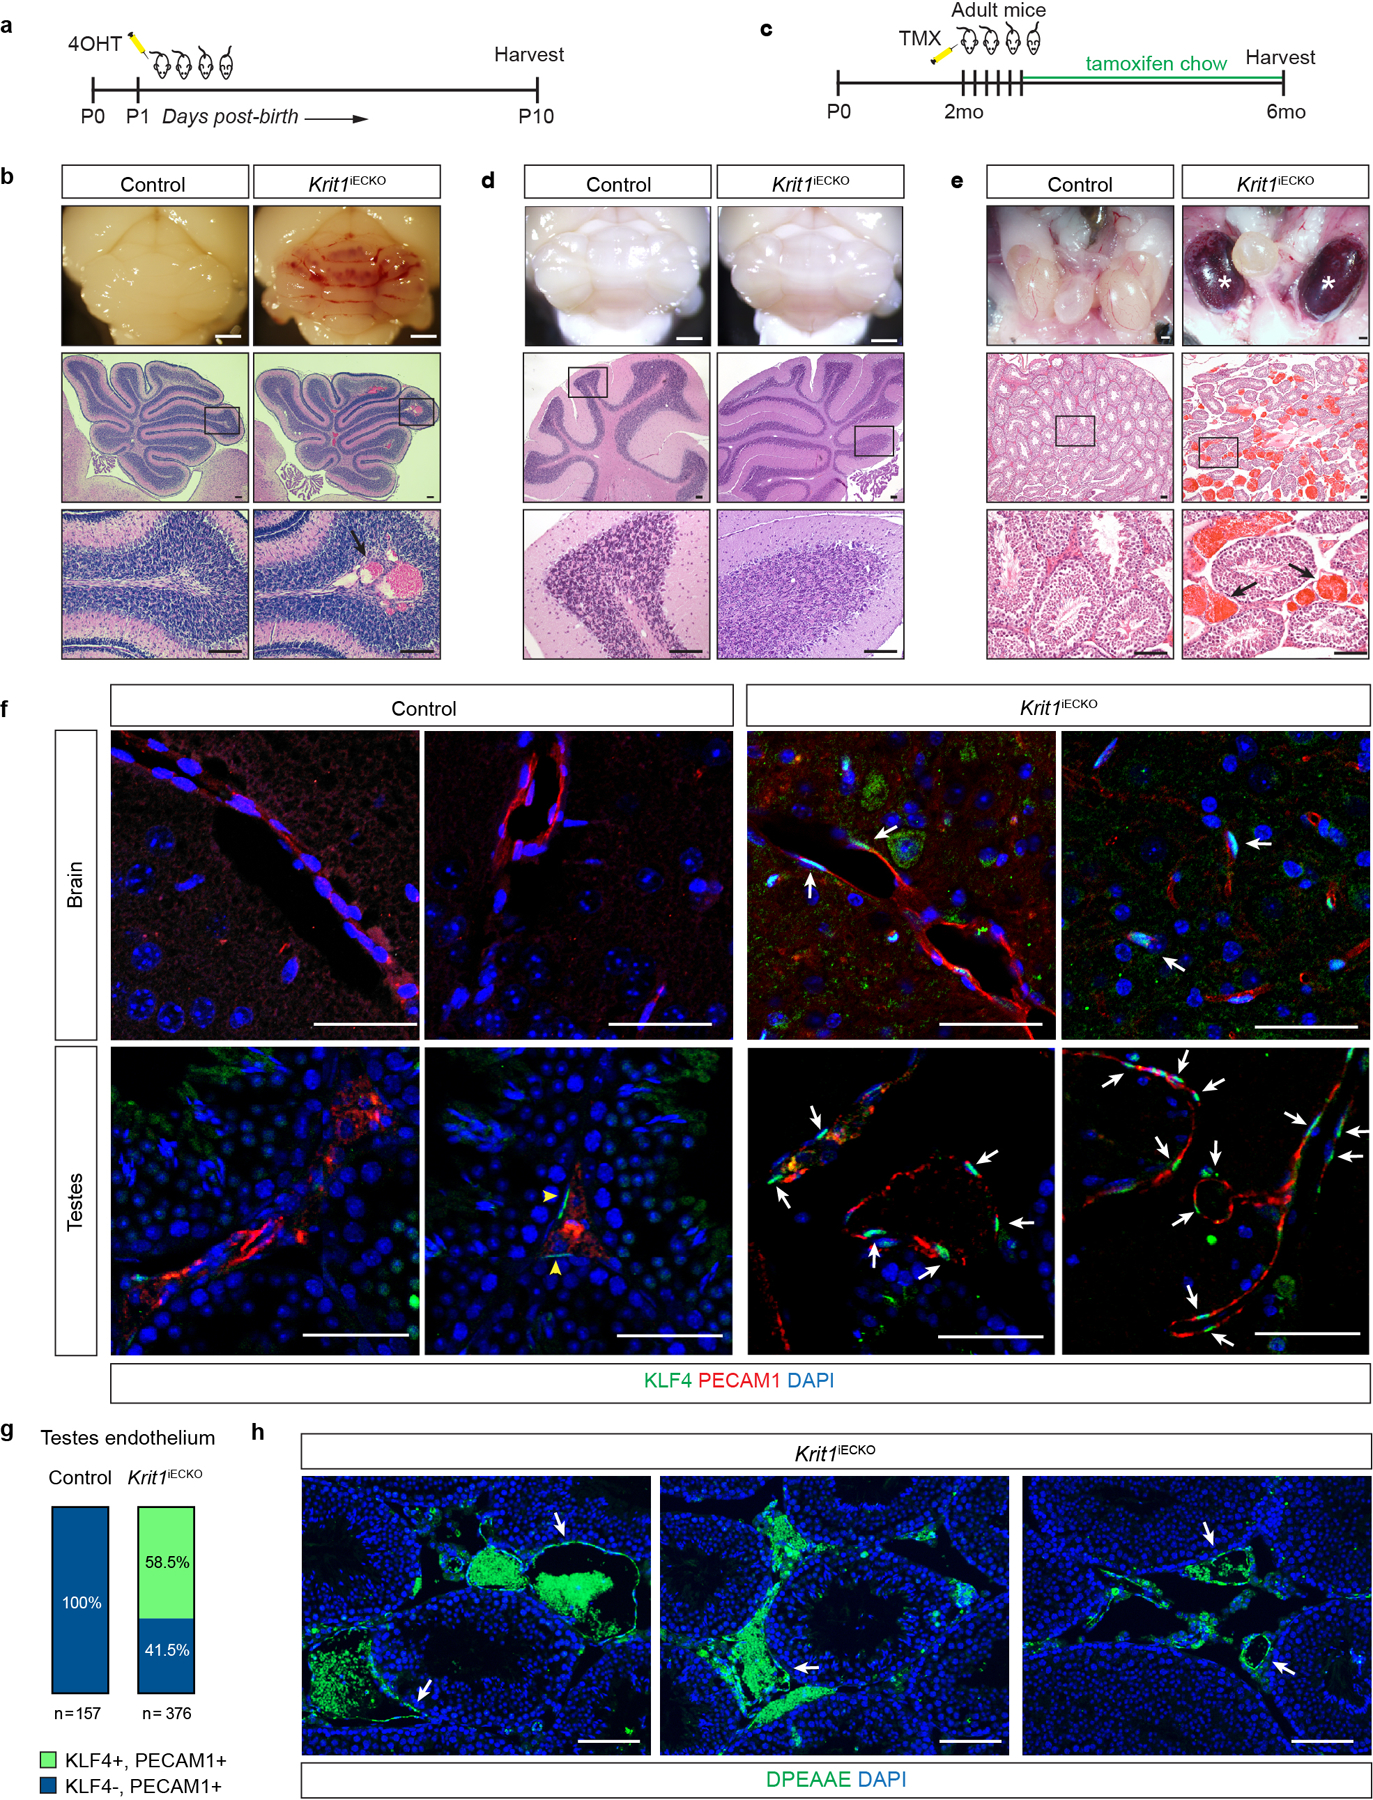
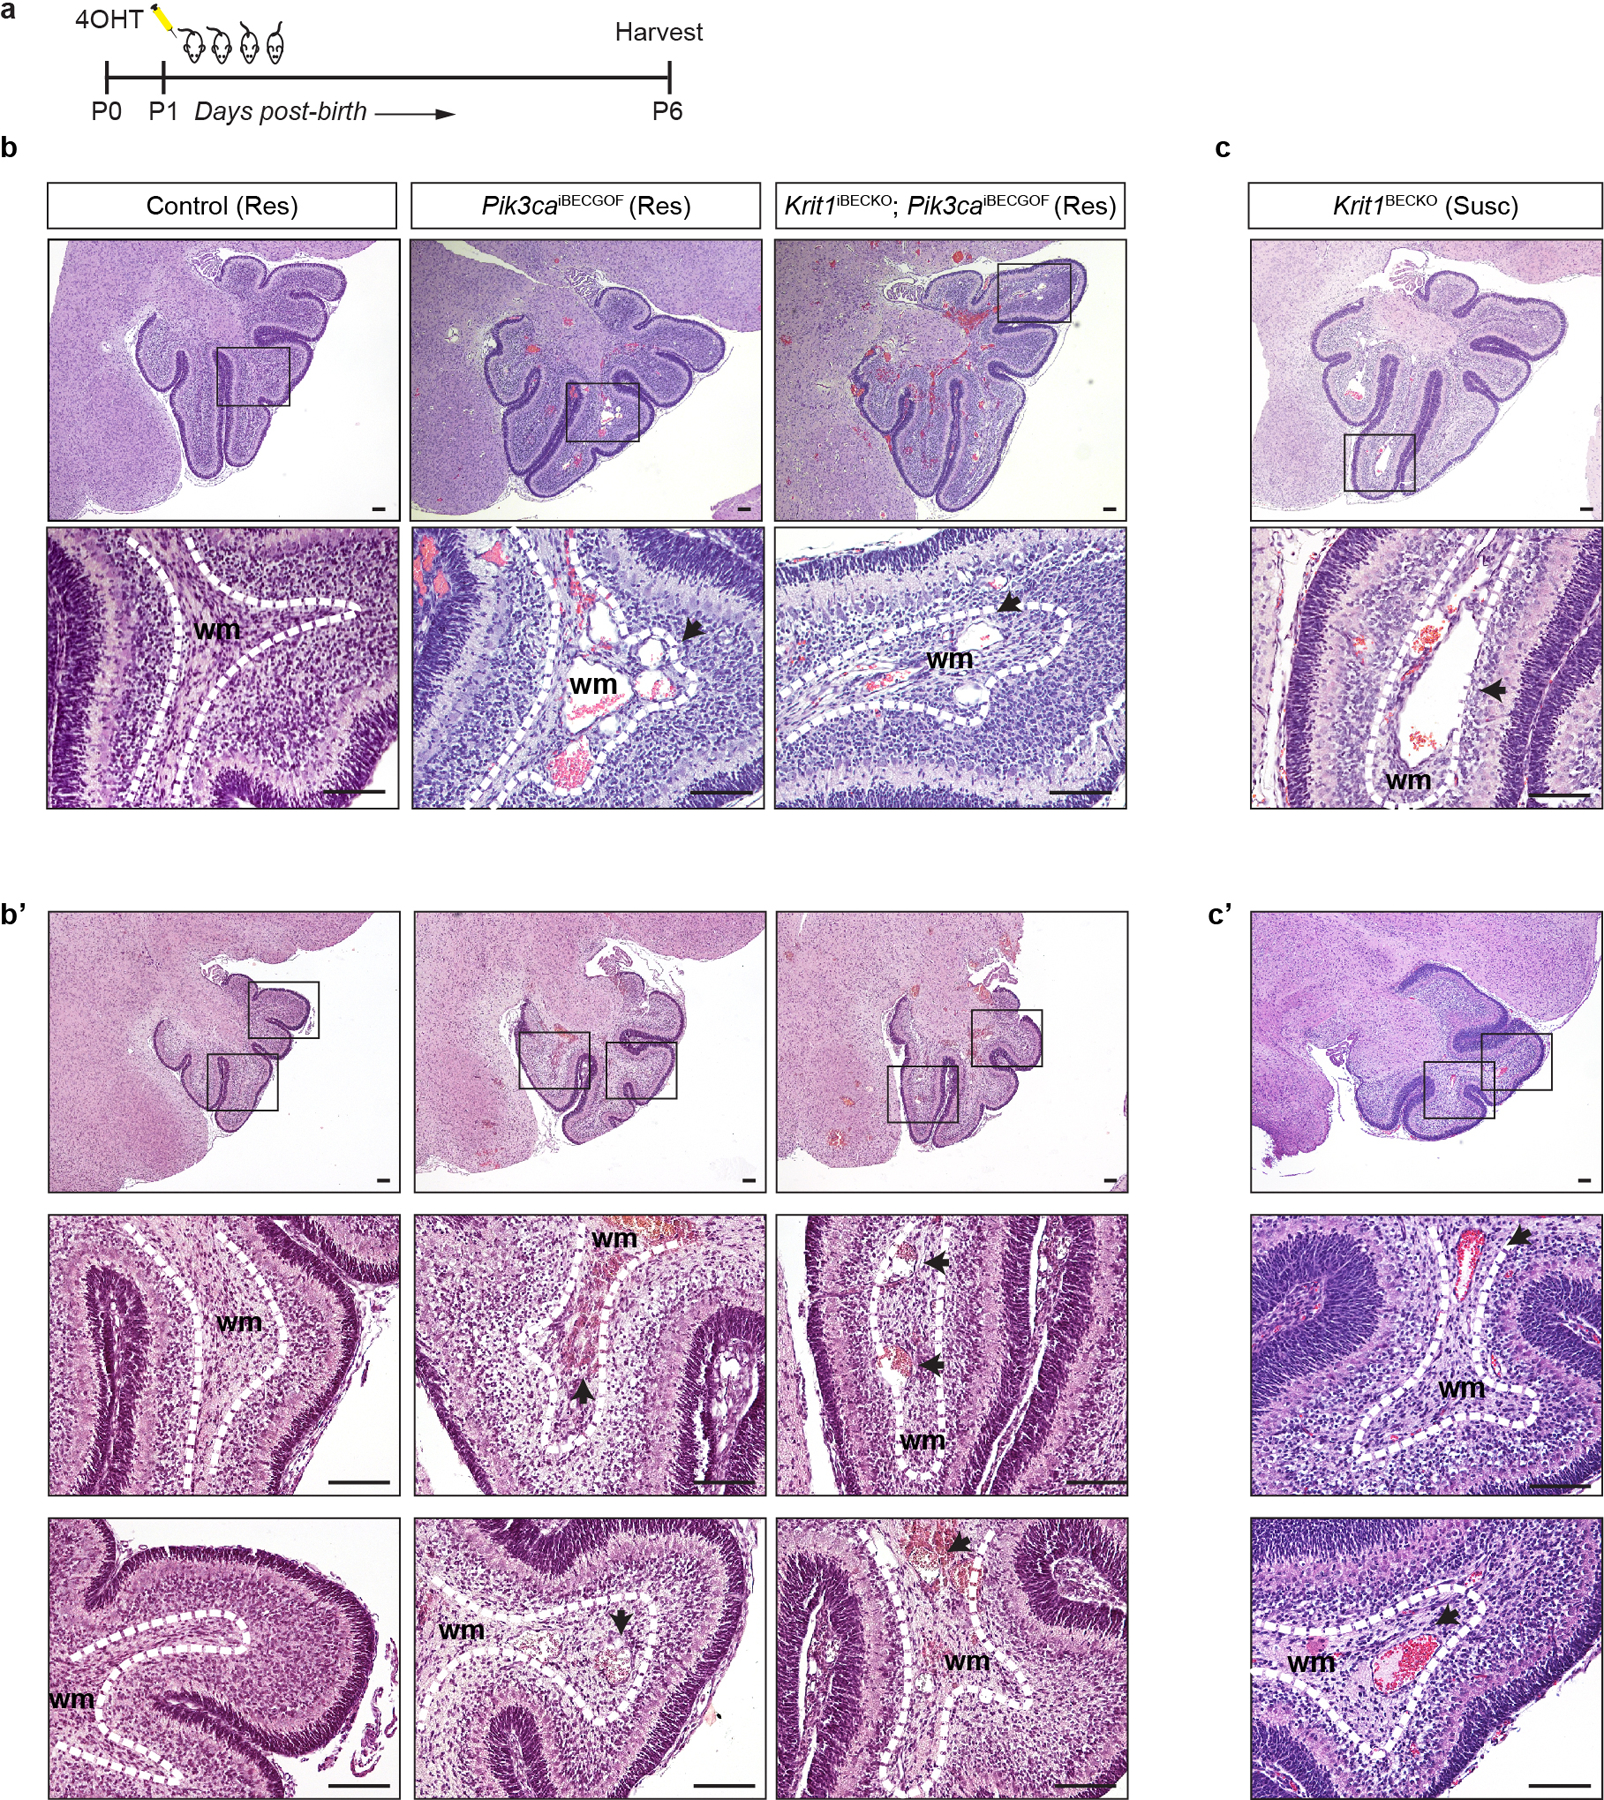
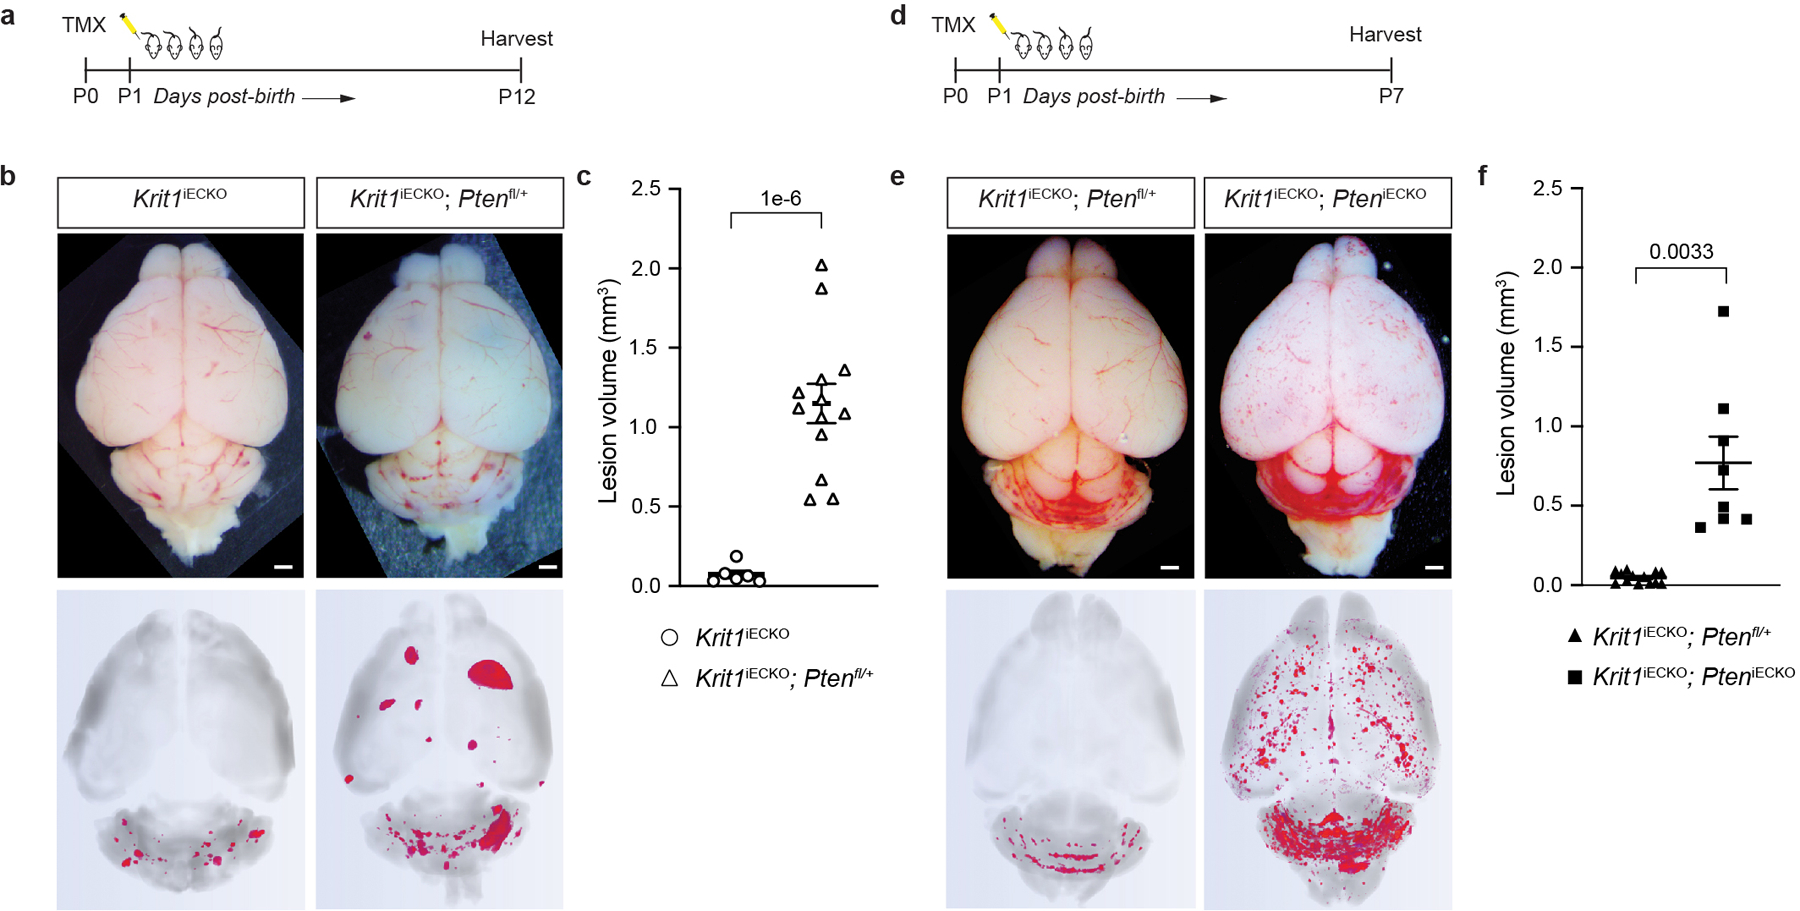
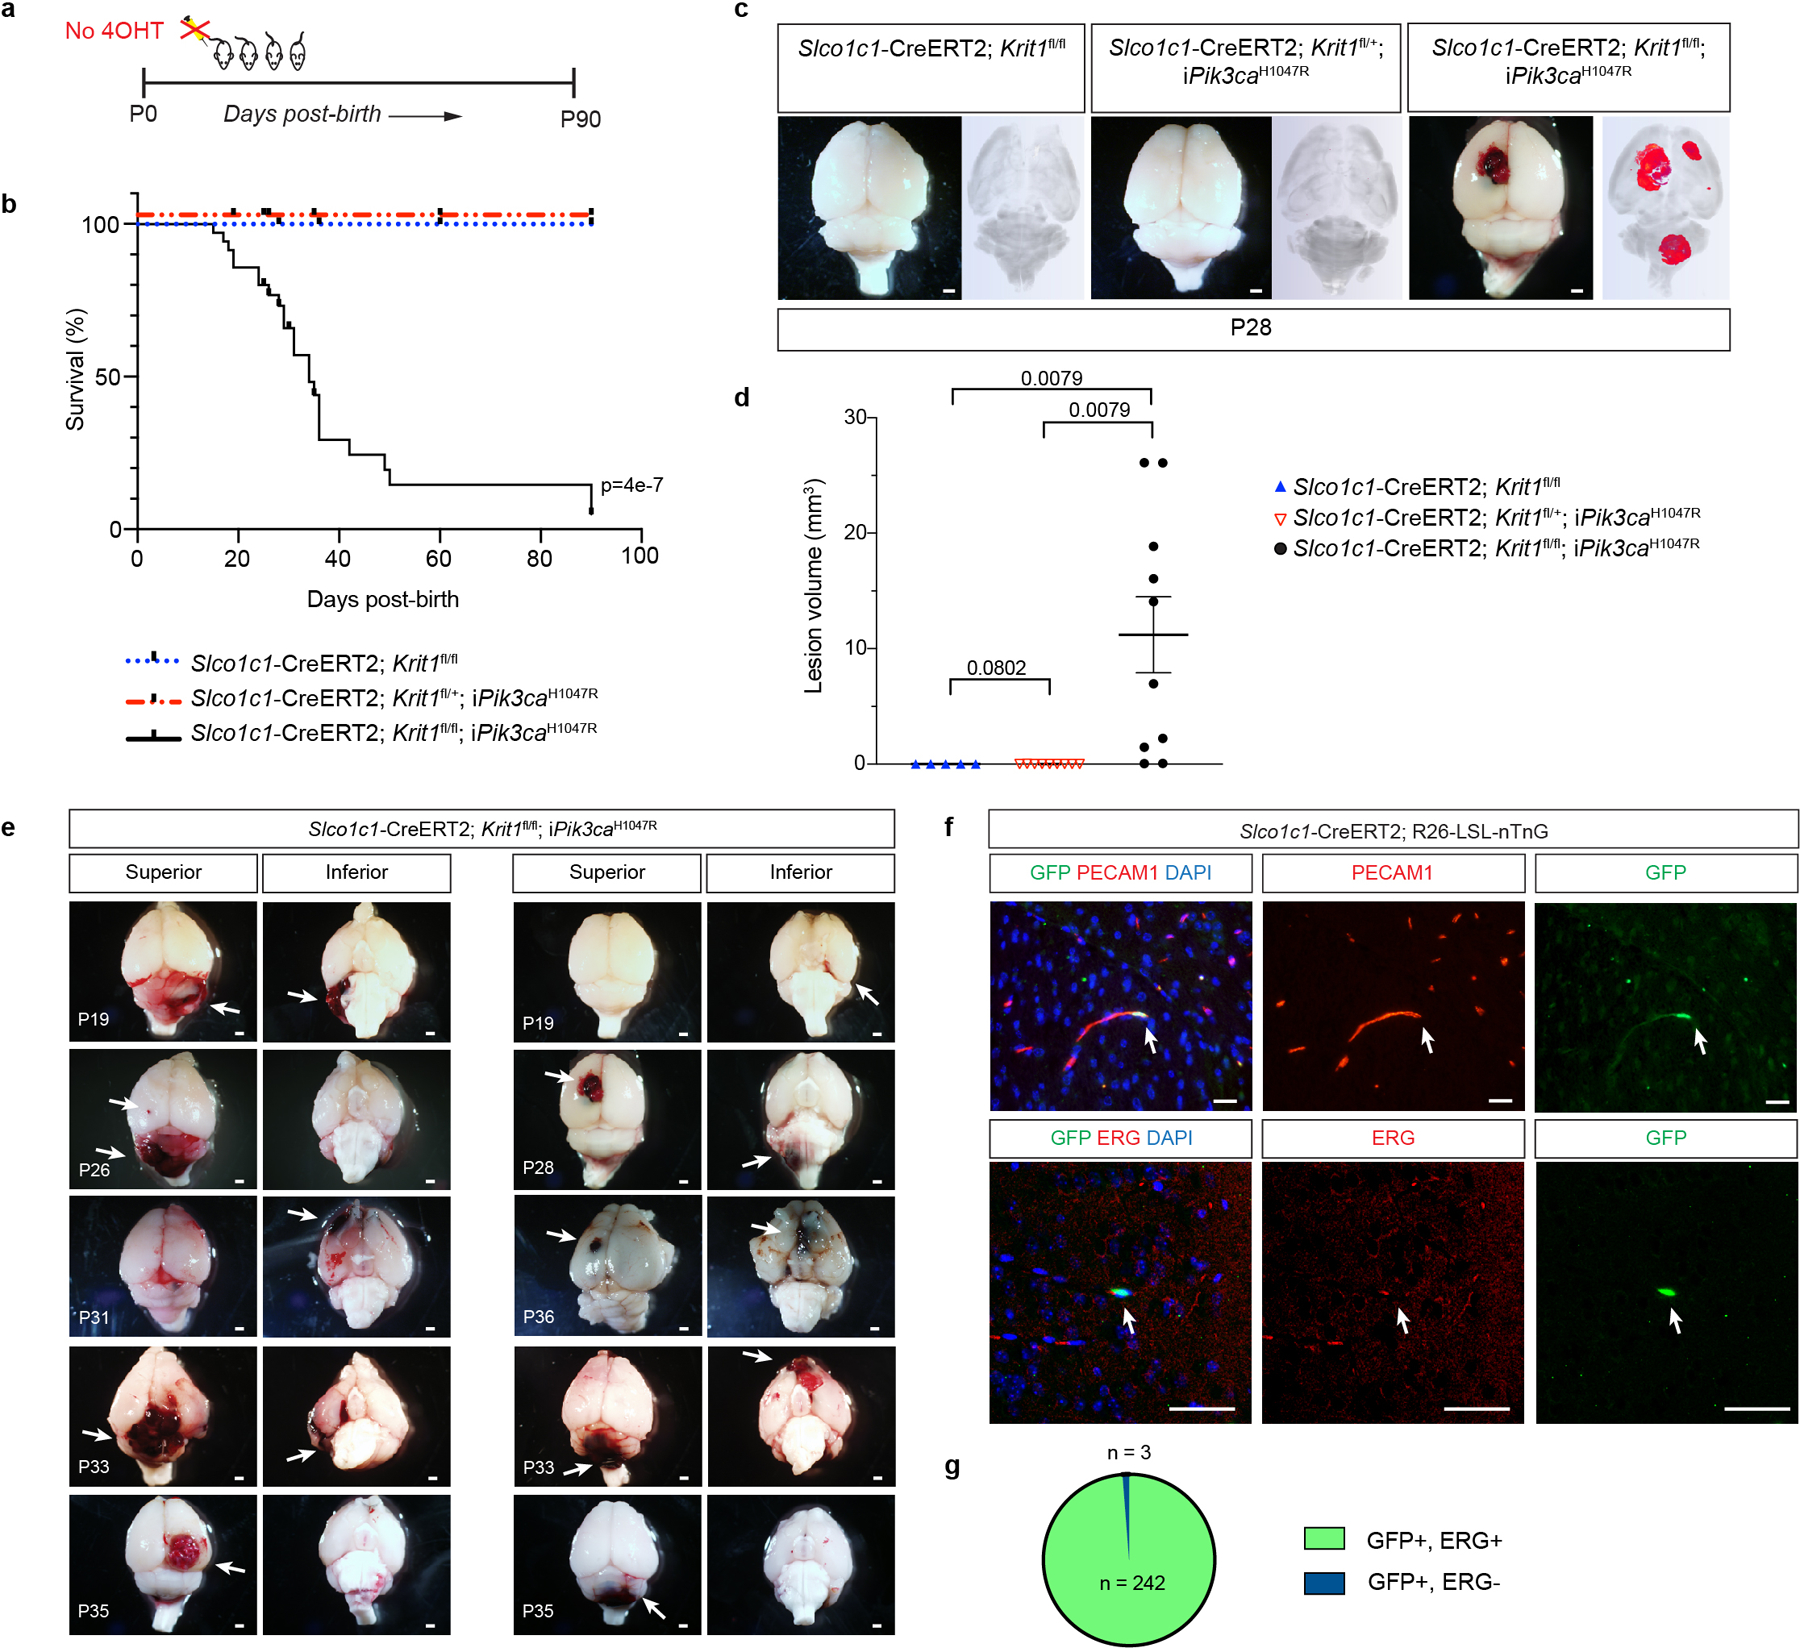
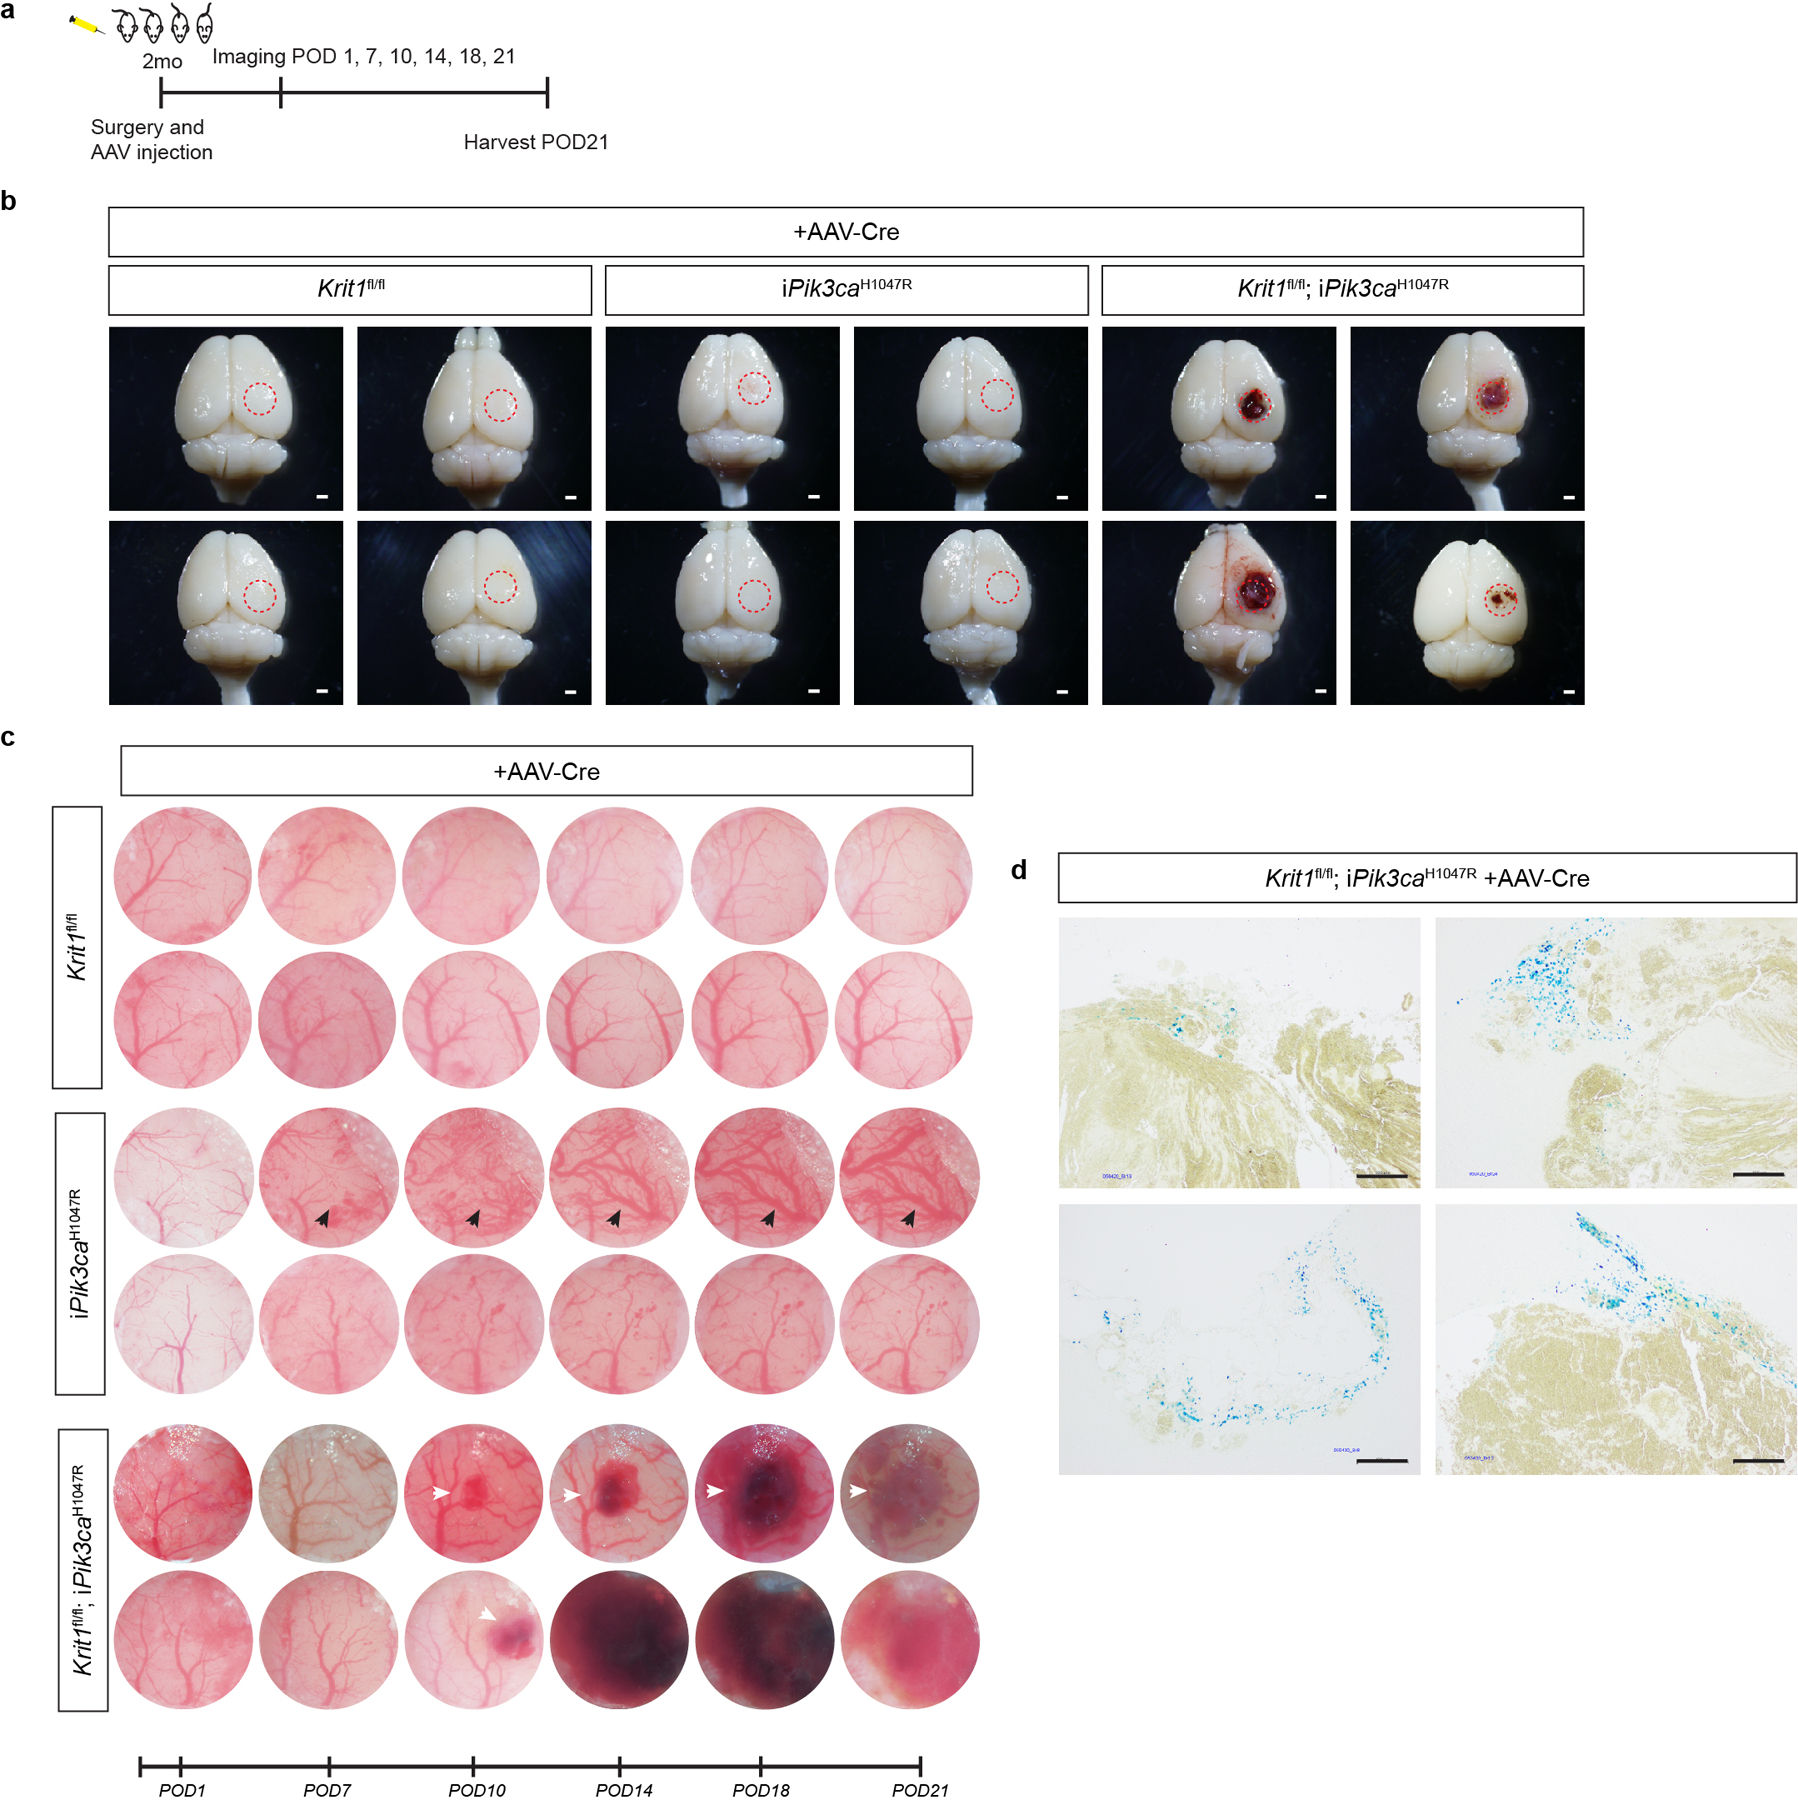
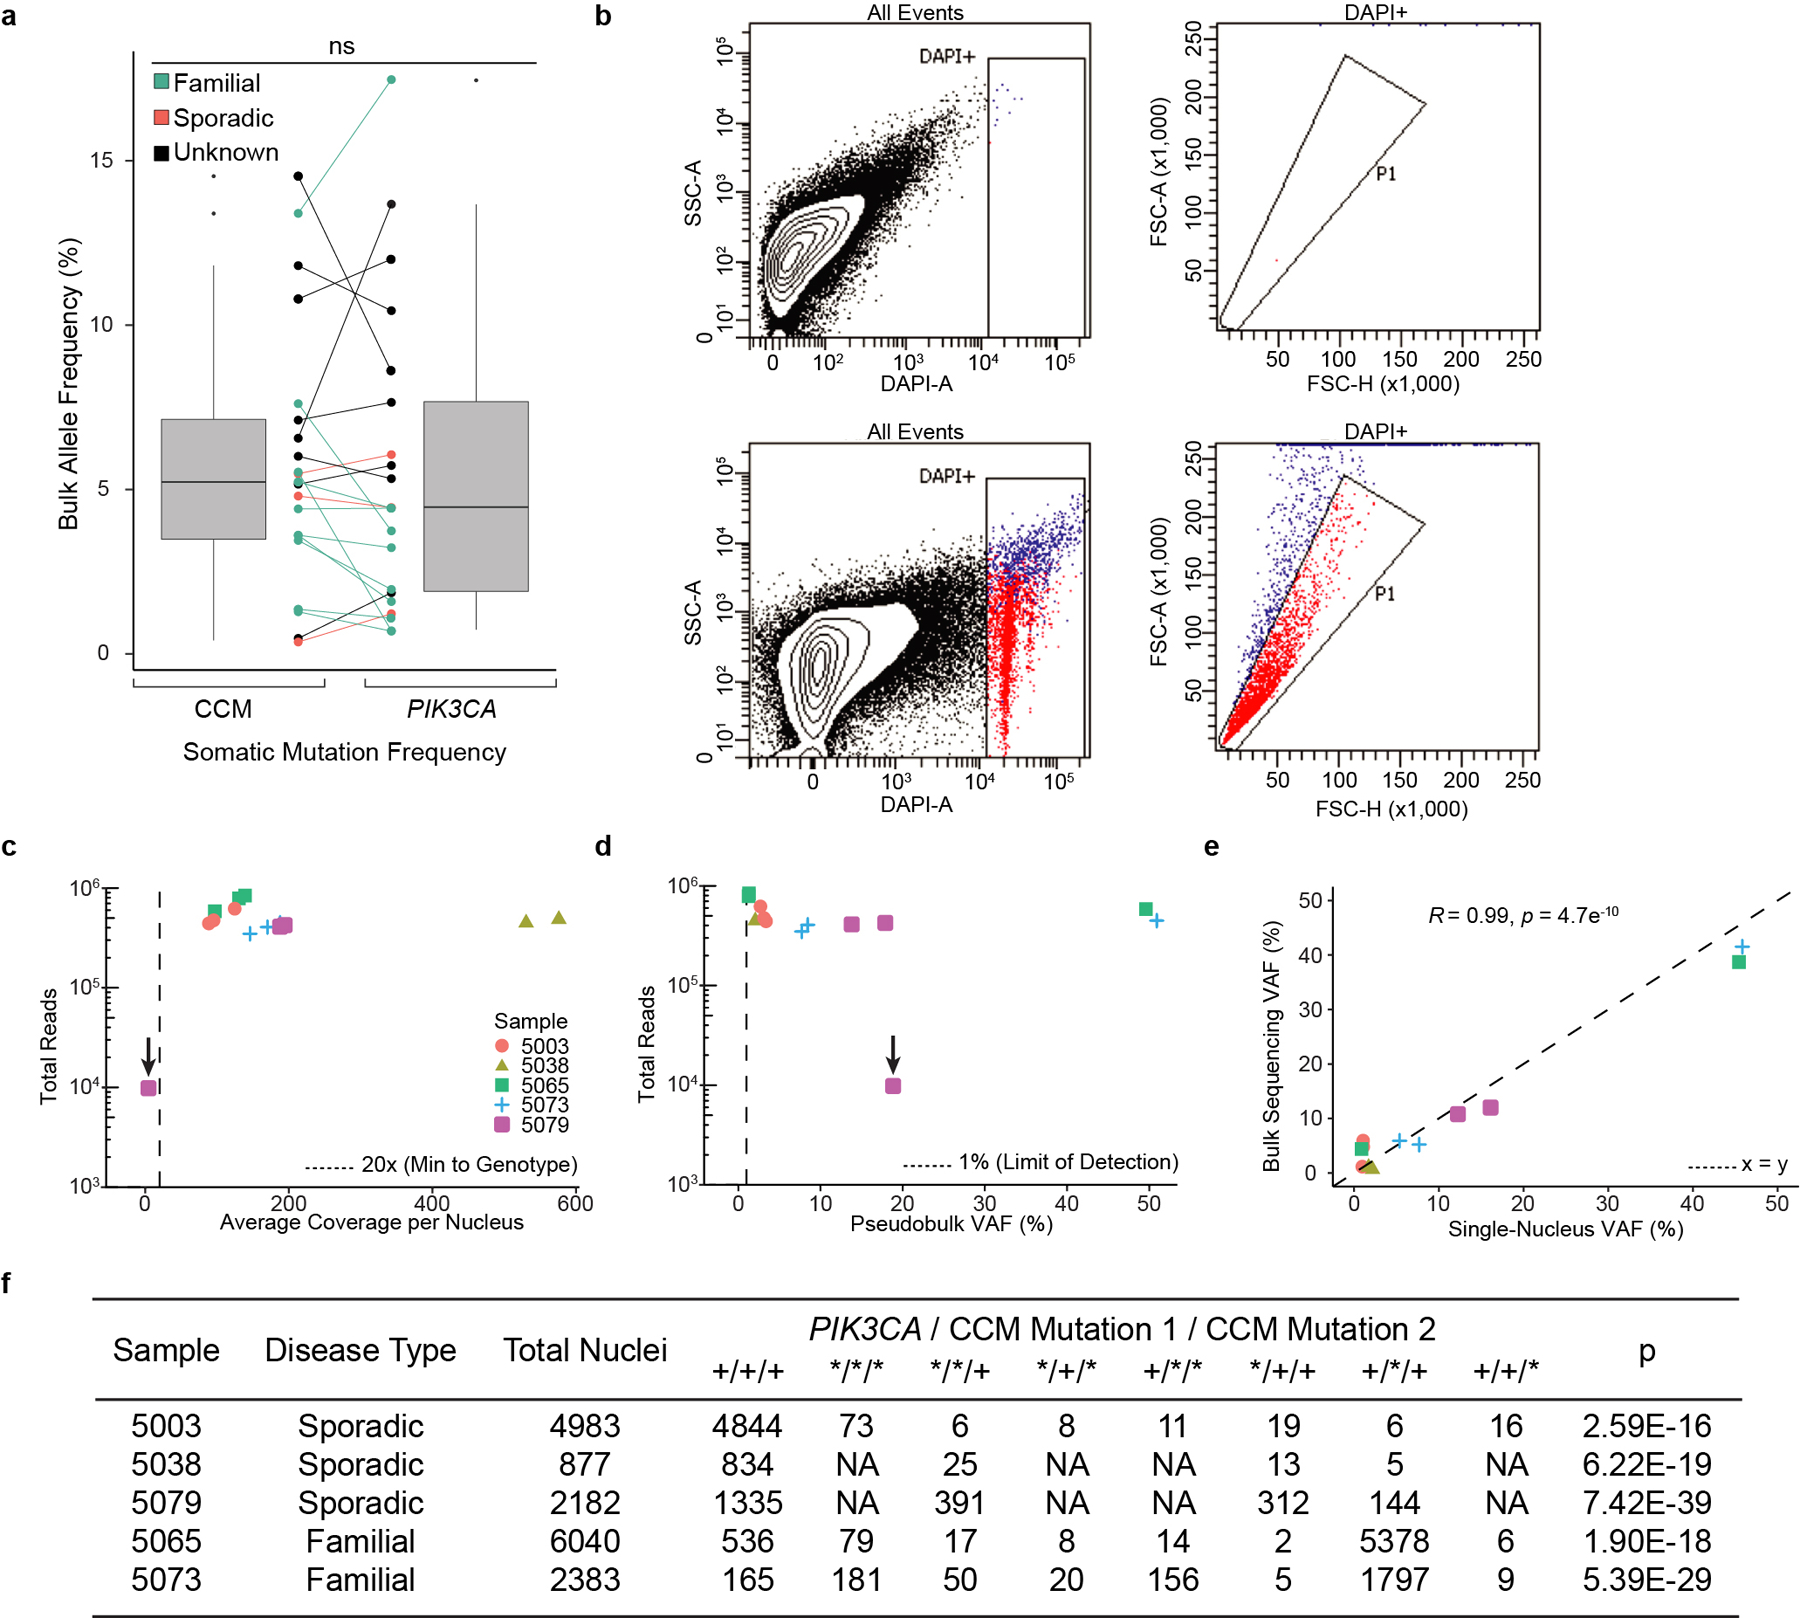
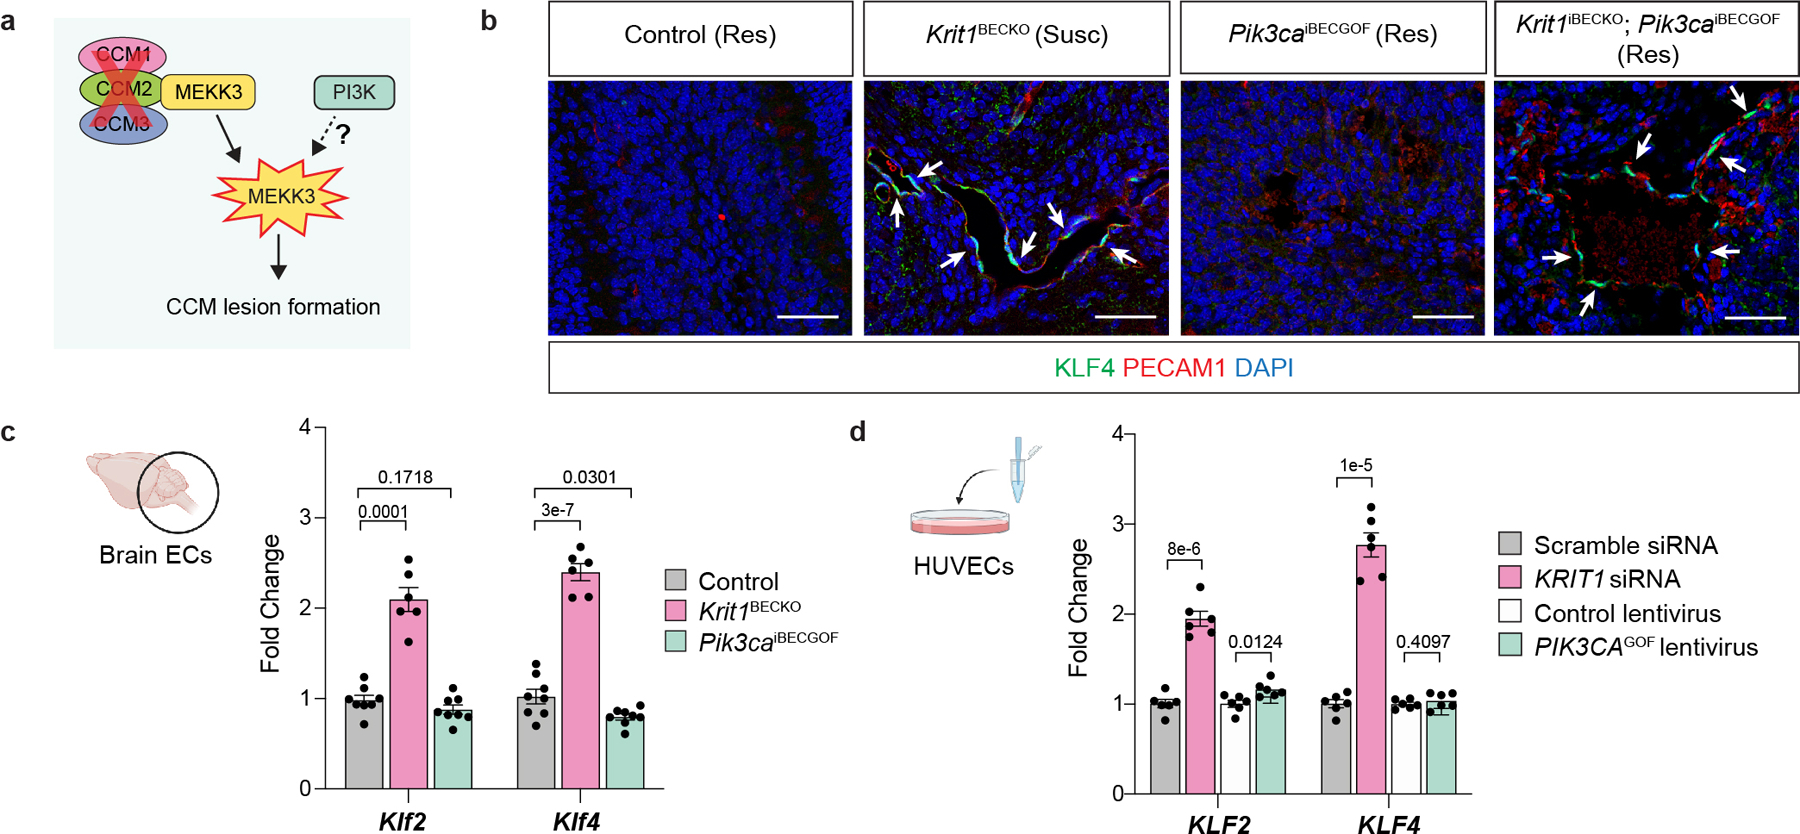
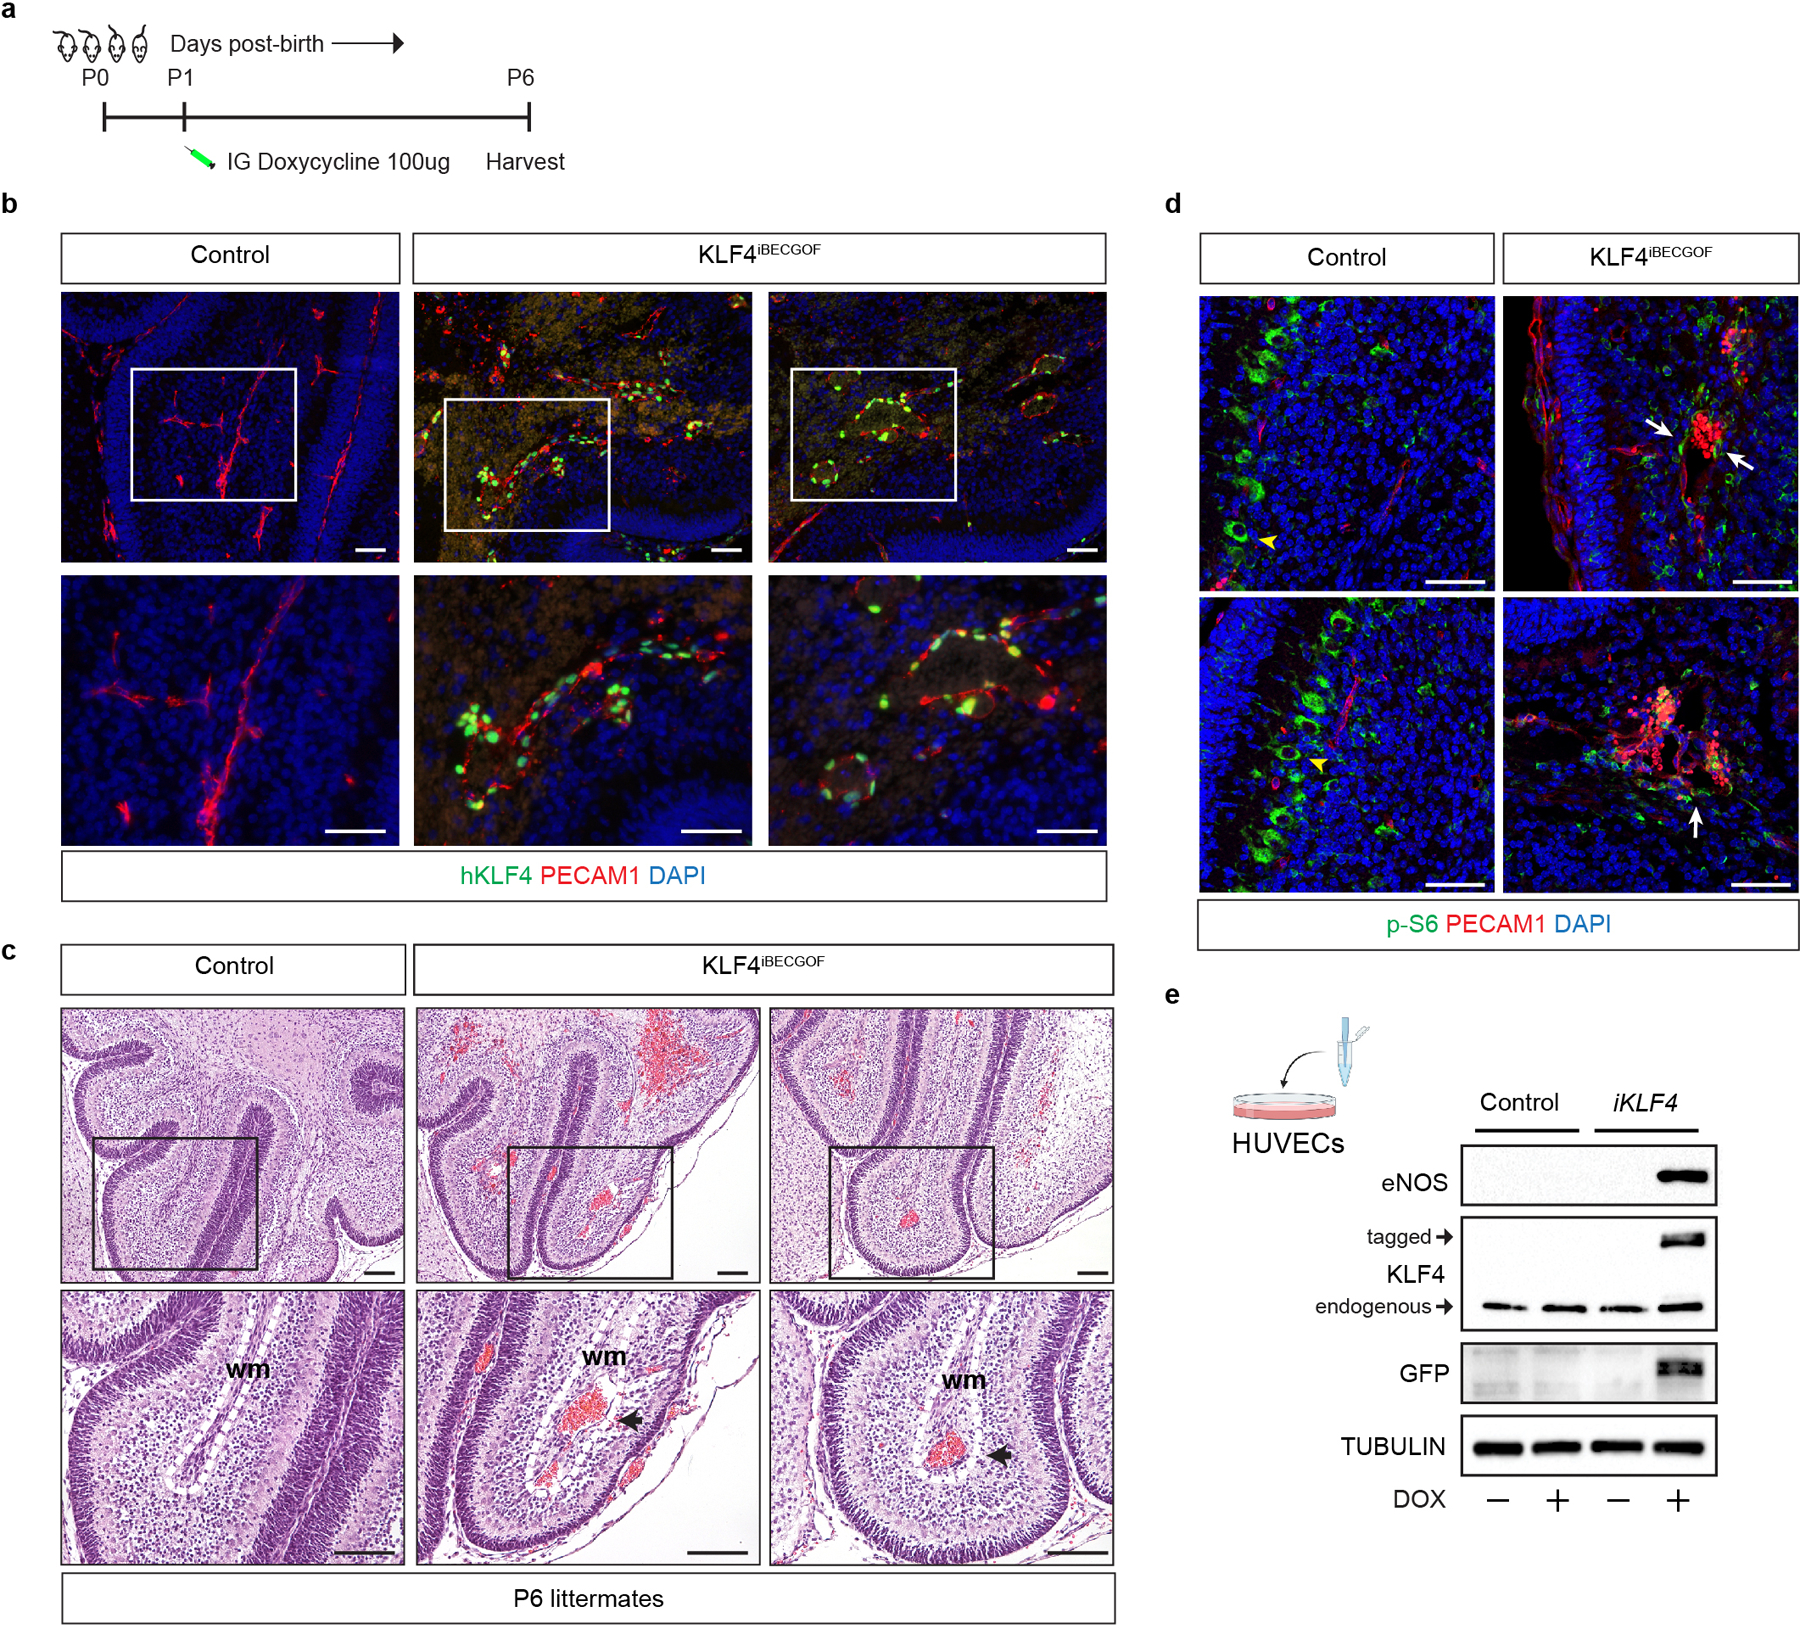
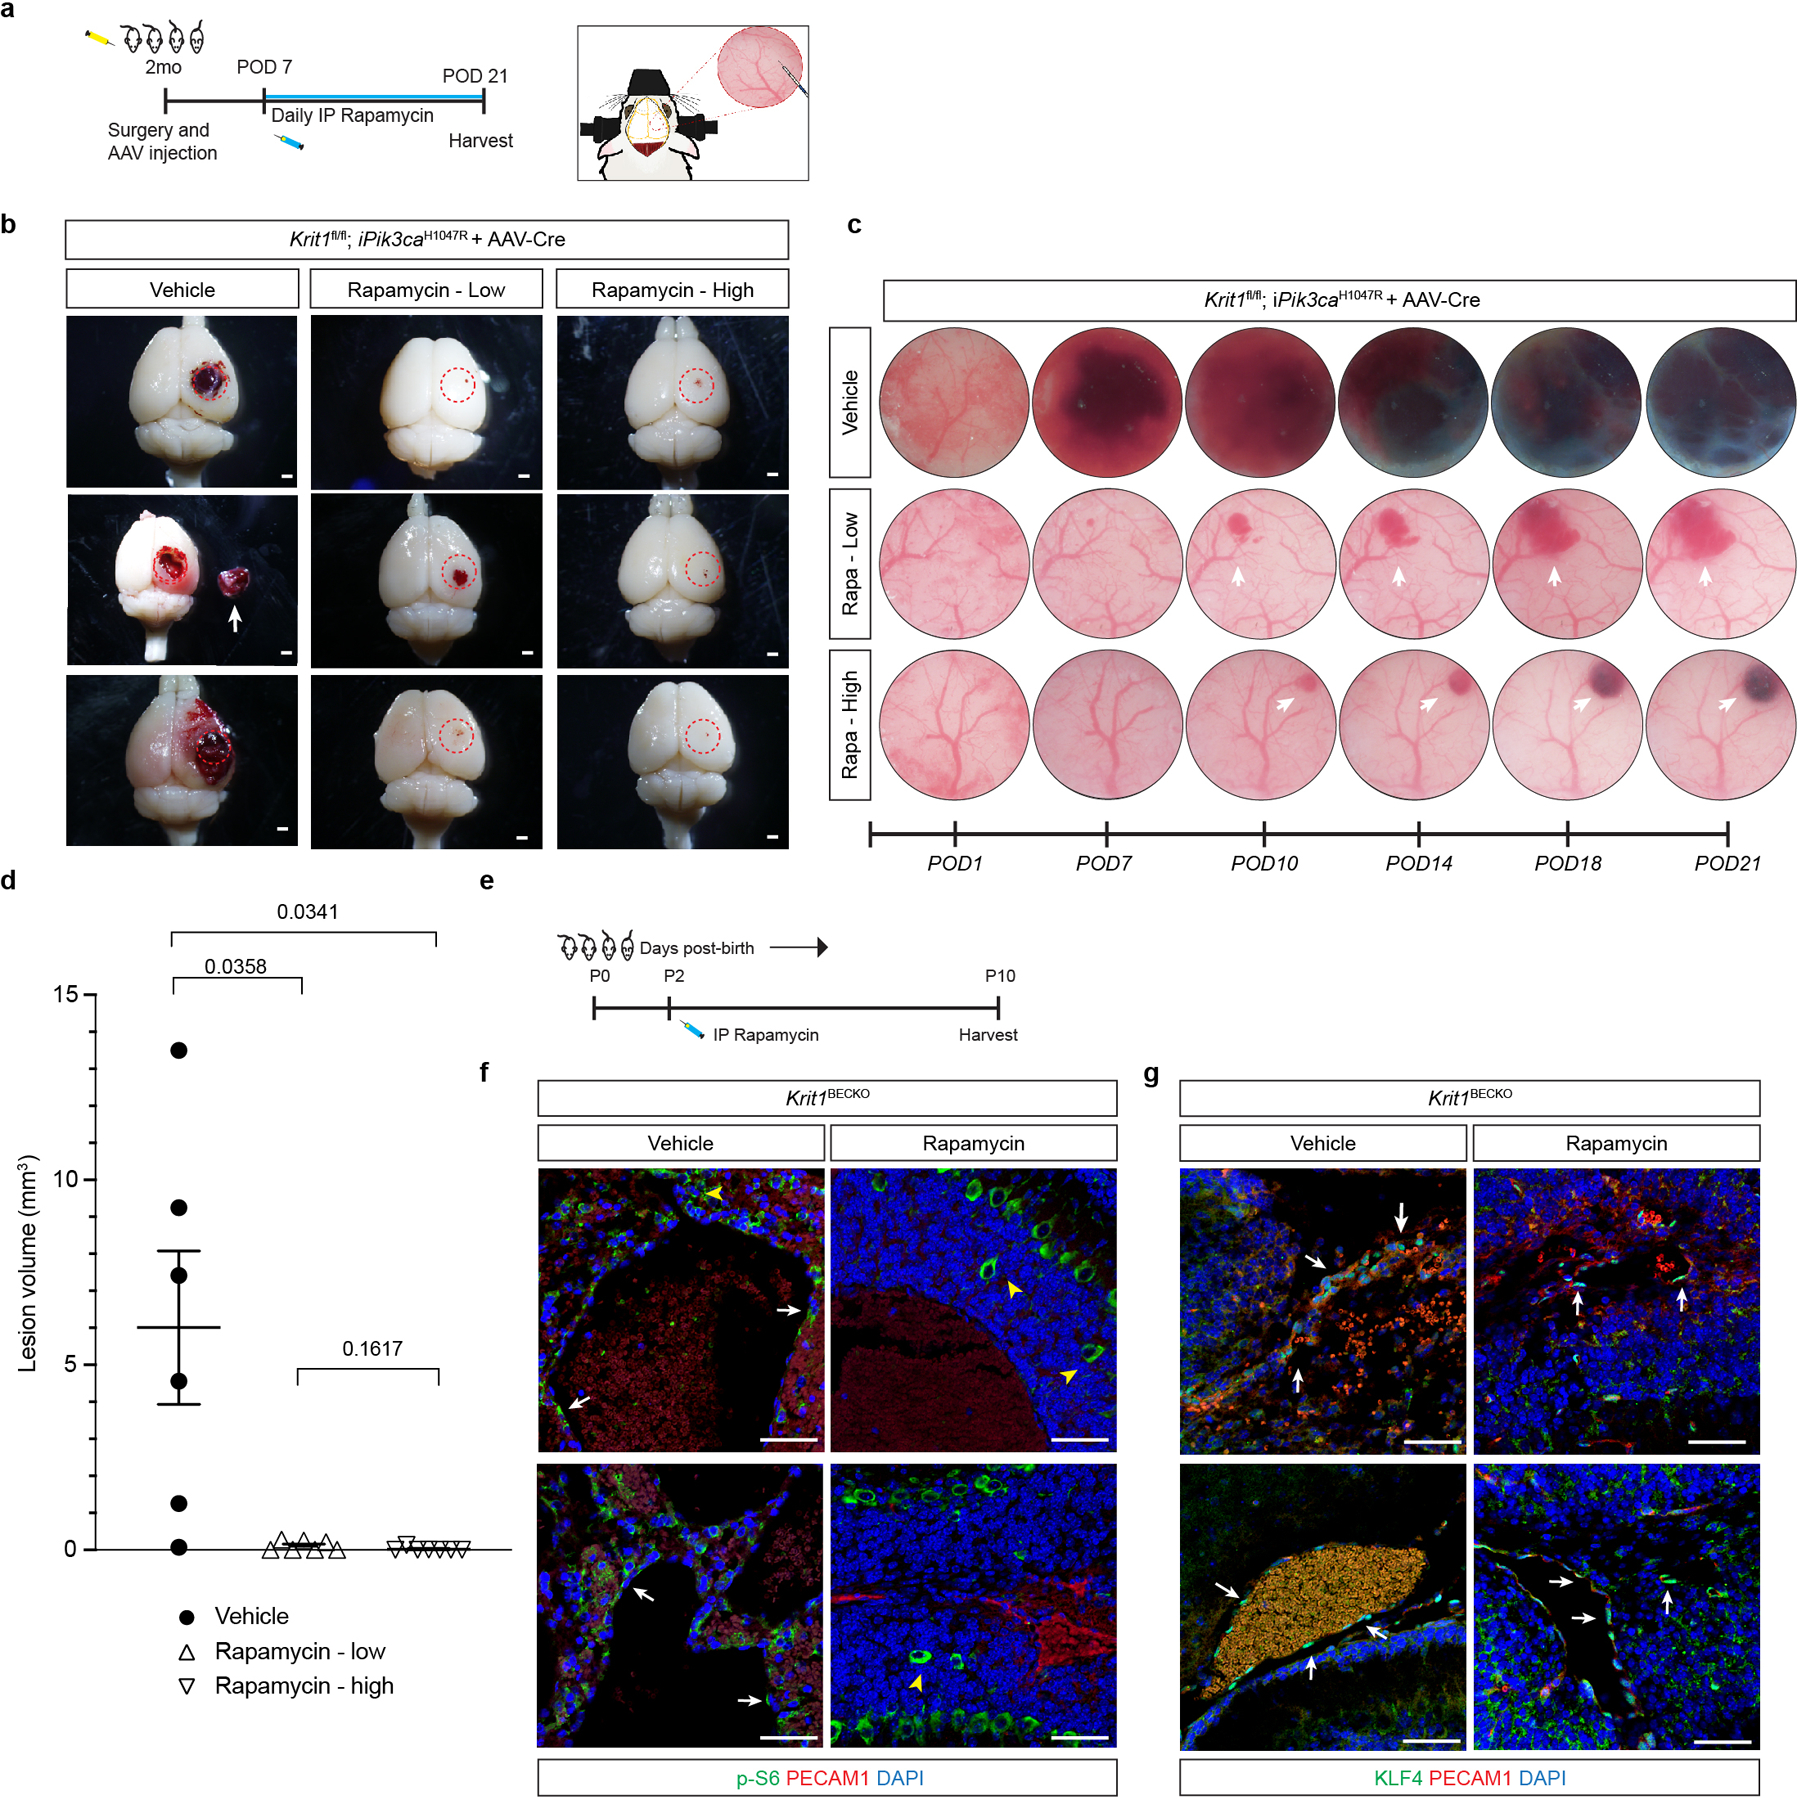
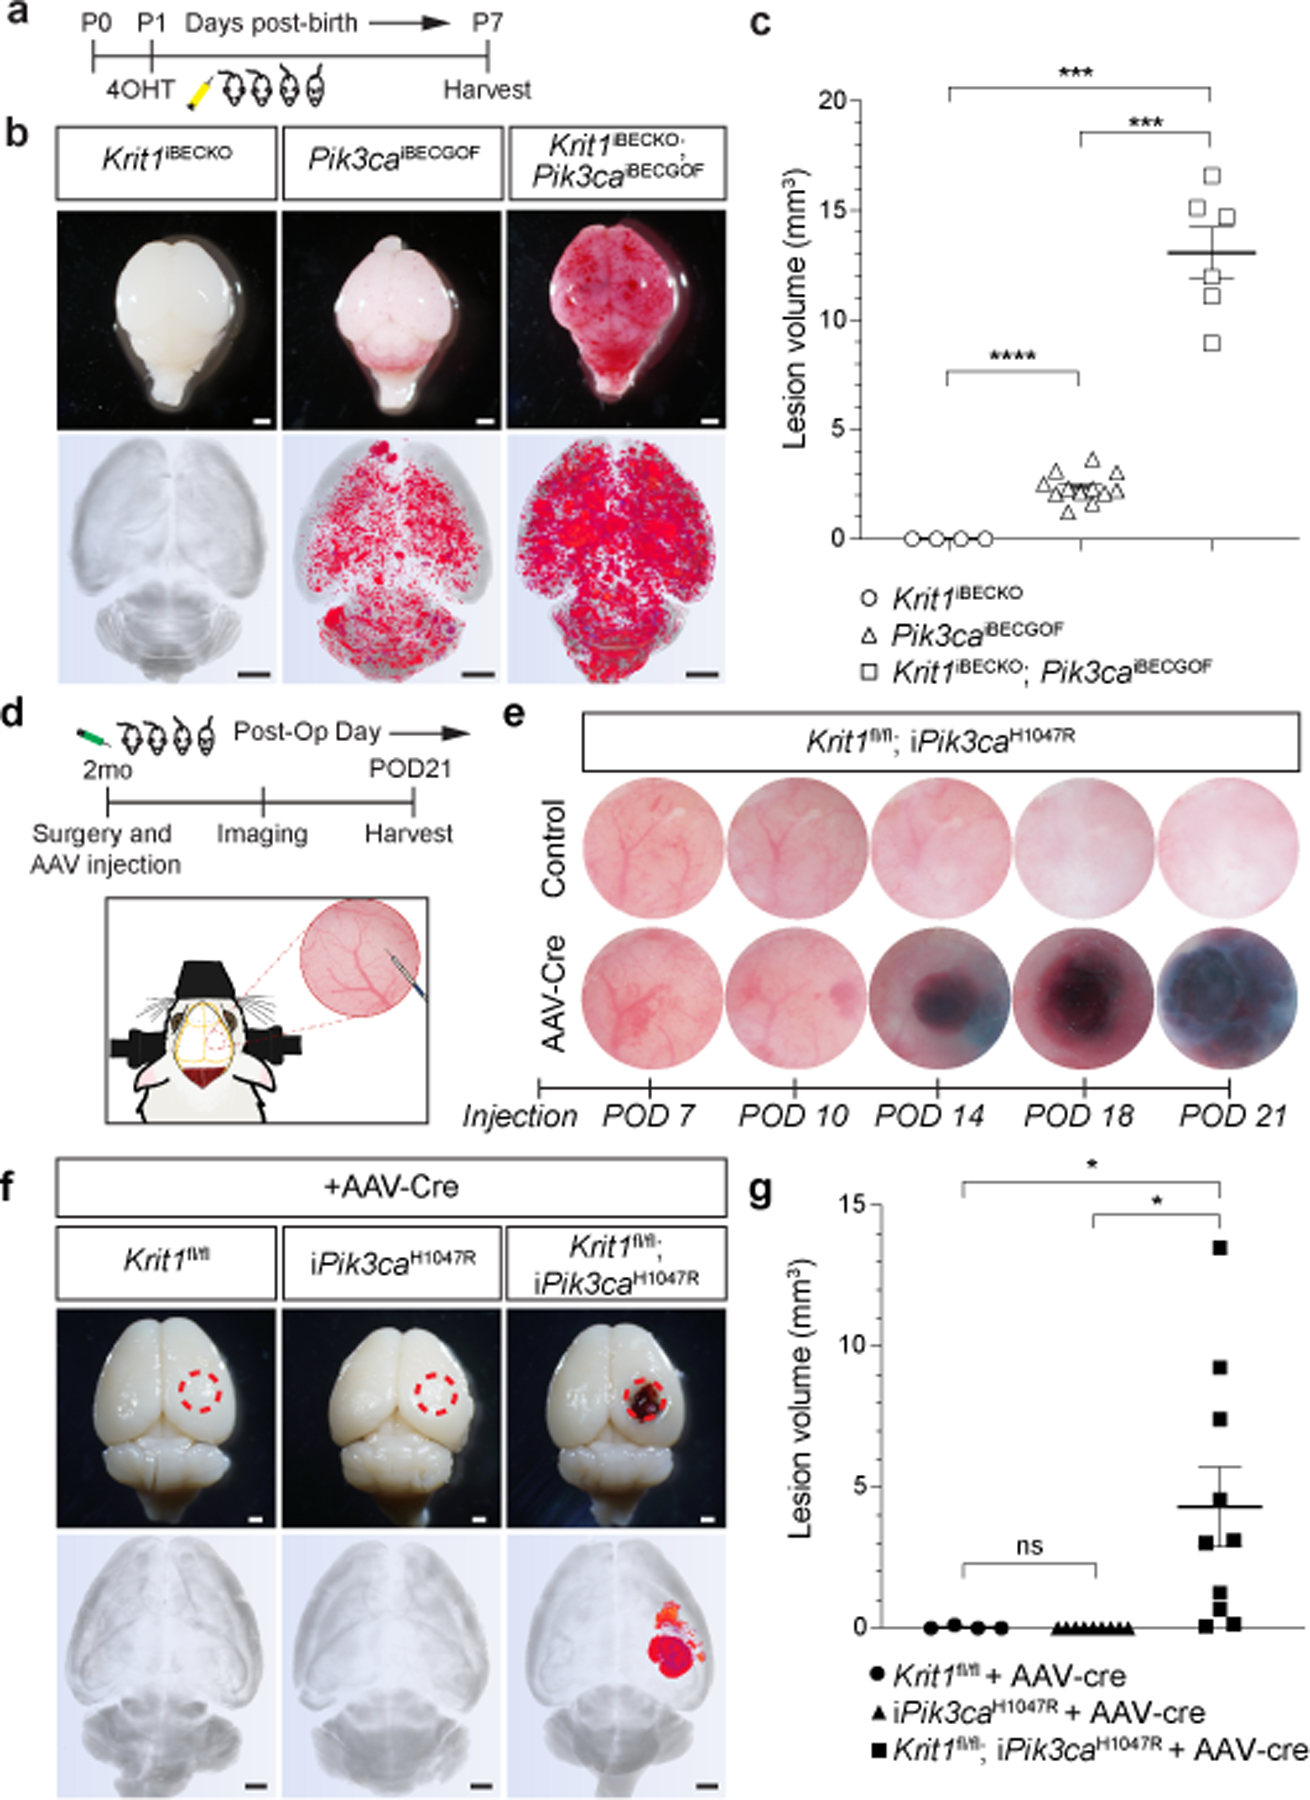
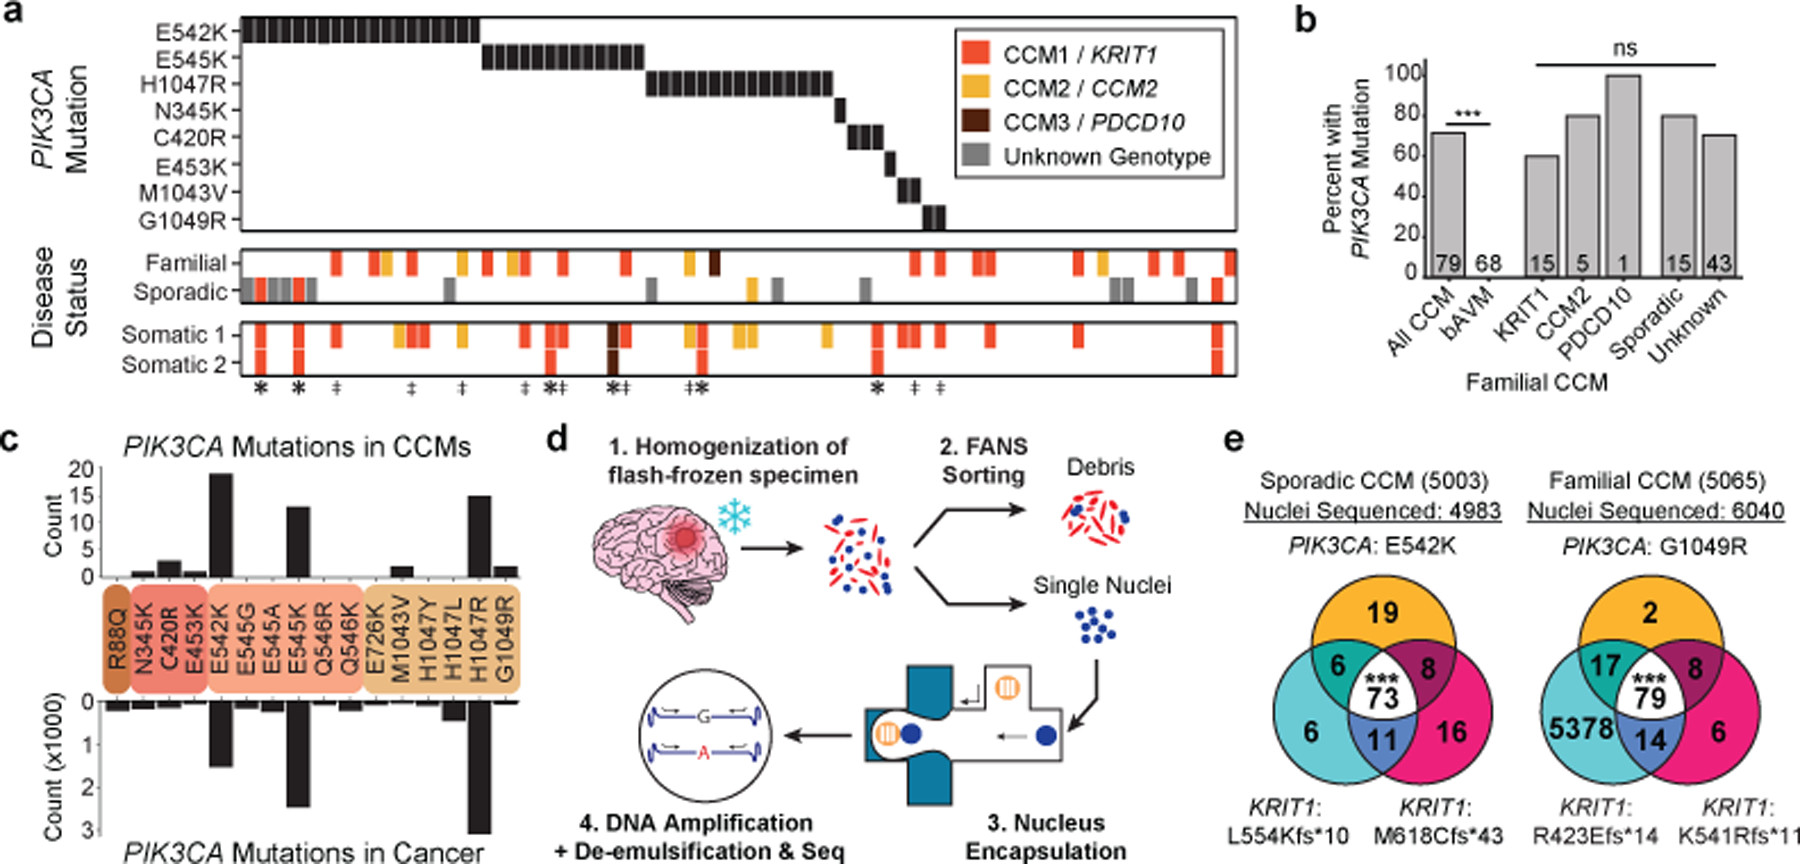
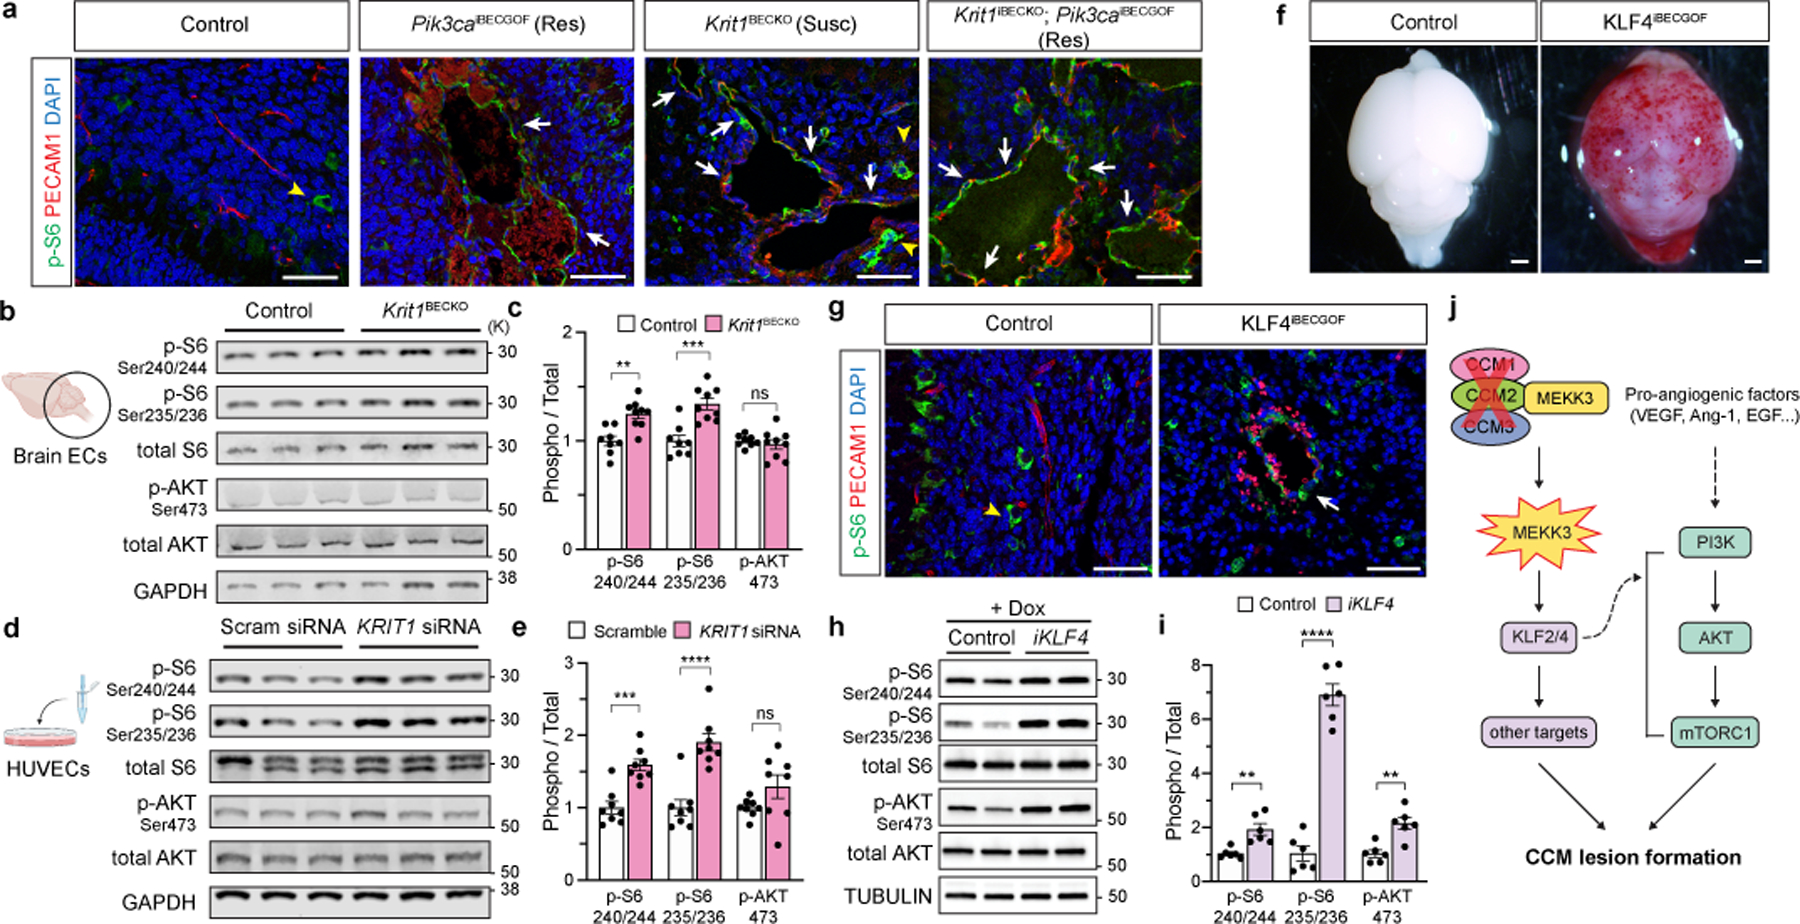
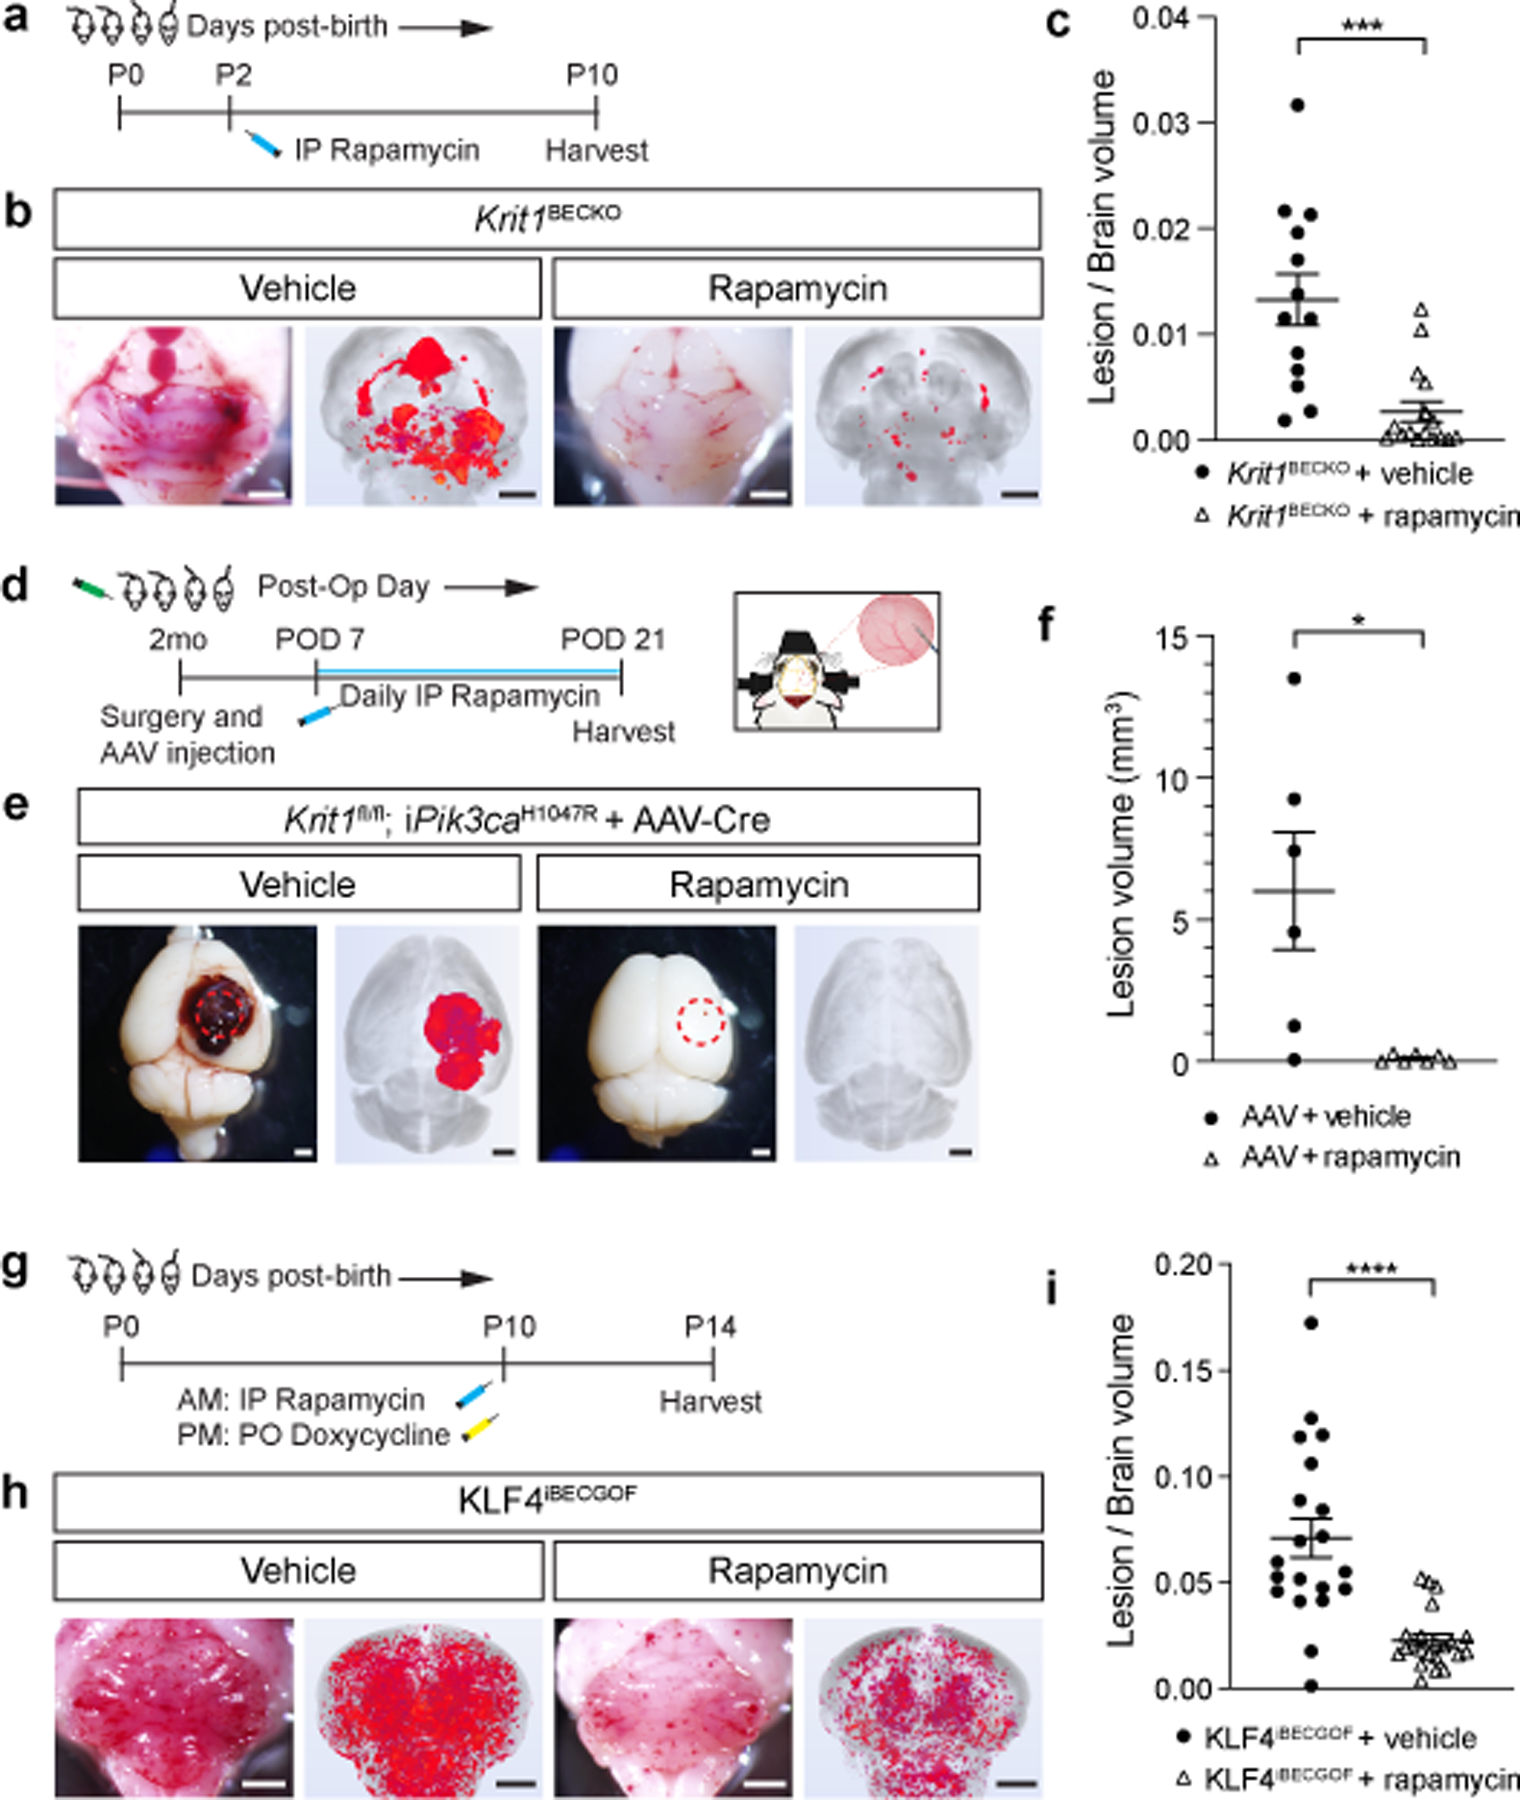
Vascular malformations are thought to be monogenic disorders that result in dysregulated growth of blood vessels. In the brain, cerebral cavernous malformations (CCMs) arise owing to inactivation of the endothelial CCM protein complex, which is required to dampen the activity of the kinase MEKK31-4. Environmental factors can explain differences in the natural history of CCMs between individuals5, but why single CCMs often exhibit sudden, rapid growth, culminating in strokes or seizures, is unknown. Here we show that growth of CCMs requires increased signalling through the phosphatidylinositol-3-kinase (PI3K)-mTOR pathway as well as loss of function of the CCM complex. We identify somatic gain-of-function mutations in PIK3CA and loss-of-function mutations in the CCM complex in the same cells in a majority of human CCMs. Using mouse models, we show that growth of CCMs requires both PI3K gain of function and CCM loss of function in endothelial cells, and that both CCM loss of function and increased expression of the transcription factor KLF4 (a downstream effector of MEKK3) augment mTOR signalling in endothelial cells. Consistent with these findings, the mTORC1 inhibitor rapamycin effectively blocks the formation of CCMs in mouse models. We establish a three-hit mechanism analogous to cancer, in which aggressive vascular malformations arise through the loss of vascular 'suppressor genes' that constrain vessel growth and gain of a vascular 'oncogene' that stimulates excess vessel growth. These findings suggest that aggressive CCMs could be treated using clinically approved mTORC1 inhibitors.


Conflict of interest statement

Competing interests: The authors declare no competing financial interests. IAA is Chairman of the Scientific Advisory Board for Angioma Alliance and provides expert opinions related to clinical care of cerebral cavernous malformations.

Figures

Extended Data Figure 1.
Extended Data Figure 1.. Endothelial loss of CCM function in adult mice confers cavernous vascular malformations in the testis but not the brain.
a, Schematic of the neonatal endothelial CCM deletion experiment. b, Cavernous malformations form by P10 in the hindbrain of Krit1iECKO animals with a susceptible gut microbiome. Images of hindbrains from the indicated animals are shown above, and Hematoxylin-Eosin (H-E) stained histologic sections shown below. Arrow indicates a CCM lesion in the white matter venous vessel. c, Schematic of CCM gene deletion in endothelial cells (ECs) of adult mice on a susceptible microbiome background. d, Cavernous malformations are not detected in the brain of 6 month old Krit1iECKO animals following tamoxifen administration. Images of hindbrains from the indicated animals are shown above, and H-E stained histologic sections shown below. e, Cavernous malformations are detected in the testis of 6 month old Krit1iECKO animals. Images of testis from the indicated animals are shown above and H-E stained histologic sections shown below. * indicate blood-filled testes. Arrows indicate cavernous blood-filled vessels around the seminiferous tubules. For panels b, d, e: Visual images representative of n=4 animals/genotype; H-E histology representative of 6 tissue sections from n=4 animals. Scale bars for visual images, 1mm; scale bars for histology, 0.1mm. f, Immunostaining for KLF4 and endothelial cell marker PECAM1 in brain (top) and testis (bottom) from the experiment in c is shown. Note endothelial CCM LOF in adult mice results in KLF4 upregulation without CCM formation in the brain. Arrows indicate KLF4+ nuclei in PECAM1+ ECs. Yellow arrowheads indicate KLF4+ peritubular myoid cells. Scale bars, 50 microns. g, Quantitation of KLF4+ and KLF4- ECs identified using co-staining for KLF4 and PECAM1 in testis is shown. Quantitation from 10 individual 800micron x 800micron HPF from 3 individual animals. h, Immunostaining for DPEAAE, a versican neo-epitope exposed by ADAMTS-mediated proteolysis, is shown for Krit1iECKO testis. Arrows indicate peri-endothelial cell detection of DPEAAE around testicular cavernomas. Scale bars, 0.1mm. “Control” genotype in panels b, d, e, f, g indicate animals with genotypes of either Cdh5-CreERT2; Krit1fl/+ or Krit1fl/fl. Immunofluorescence images in f & h representative of 6 tissue sections from n=4 individual animals/genotype.
Extended Data Figure 2.
Extended Data Figure 2.. Vascular lesions due to CCM LOF and/or PIK3CA GOF arise in veins of the white matter.
a, Schematic of neonatal endothelial induction of Krit1 deletion and/or PIK3CAH1047R expression. b & c, Hematoxylin-Eosin (H-E) staining of saggital hindbrain sections from P6 control, Pik3caiBECGOF, Krit1iBECKO;Pik3caiBECGOF (b and b’) and Krit1iBECKO (c and c’) animals with a resistant (Res) or susceptible (Susc) microbiome. b’and c’ samples were obtained from animals distinct from those in b and c. Note that lesions form in the white matter with both CCM loss of function and PIK3CA gain of function. Boxes in upper images denote area of magnified image immediately below. Dotted lines outline the white matter of the cerebellum. Arrows indicate lesions in white matter veins and venules. H-E images representative of 6 tissue sections from n=4 animals/genotype. wm, white matter. Scale bars, 0.1mm.
Extended Data Figure 3.
Extended Data Figure 3.. Endothelial Pten LOF synergizes with Krit1 LOF in a dose-dependent manner.
a, Schematic of neonatal endothelial induction with tamoxifen of Krit1 deletion and deletion of either none or one allele of Pten in endothelial cells using a Pdgfb-CreERT2 transgene. b, Representative visual and paired microCT images of Krit1iECKO and Krit1iECKO;Ptenfl/+ littermate mice on a susceptible microbiome background at P12. Scale bars, 1mm. These mice were produced from a Ptenfl/+ x Ptenfl/+ cross; however no Krit1iECKO;Ptenfl/fl littermates survived to P12. c, MicroCT quantification of lesion volumes at P12. (Krit1iECKO, n=6; Krit1iECKO;Ptenfl/+, n=13). d, Schematic of neonatal endothelial induction of Krit1 deletion and deletion of either one or both alleles of Pten in endothelial cells using a Pdgfb-CreERT2 transgene with brains harvested at P7. These mice were produced from a Ptenfl/+ x Ptenfl/fl cross. e, Representative visual and paired microCT images in Krit1iECKO;Ptenfl/+ and Krit1iECKO;PteniECKO littermate mice at P7. Scale bars, 1mm. f, MicroCT quantification of lesion volumes at P7. (Krit1iECKO;Ptenfl/+, n=13; Krit1iECKO;PteniECKO, n=8). Data are mean ± s.e.m. Unpaired, two-tailed Welch’s t-test.
Extended Data Figure 4.
Extended Data Figure 4.. Uninduced Slco1c1-CreERT2; Krit1fl/fl; iPik3caH1047R animals develop focal lesions due to Slco1c1-CreERT2 transgene endothelial leak.
a, Schematic for generation of a survival curve in the absence of tamoxifen administration. b, Postnatal survival curve in the absence of tamoxifen administration is shown for indicated genotypes. (Slco1c1-CreERT2;Krit1fl/fl, n=15, Slco1c1-CreERT2;Krit1fl/+;iPik3caH1047R n=10, Slco1c1-CreERT2;Krit1fl/fl;iPik3caH1047R n=39). Log-rank test. c, Representative visual and paired microCT images of brains harvested from untreated P28 littermates. Scale bars, 1mm. d, MicroCT quantitation of lesion volumes of untreated P28 animals. (Slco1c1-CreERT2;Krit1fl/fl, n=5, Slco1c1-CreERT2;Krit1fl/+;iPik3caH1047R n=9, Slco1c1-CreERT2;Krit1fl/fl;iPik3caH1047R n=10). Data are mean ± s.e.m. Unpaired, two-tailed Welch’s t-test. e, Additional visual images of brains from a superior and inferior perspective from animals harvested at various timepoints (P19-P36). Arrows point to focal vascular lesions. Scale bars, 1mm. f, Leak assessed by immunostaining of brain sections with antibodies against GFP to identify Cre-expressing cells, and cell surface marker PECAM1 (top) and nuclear protein ERG (bottom) to identify endothelial cells is shown. Scale bars, 50 microns. Immunofluorescence images representative of 10 tissue sections from n=4 individual animals/genotype. g, Quantitation of GFP+; ERG+ nuclei (n = 242) and GFP+; ERG- nuclei (n = 3) from 20 individual 800micron x 800micron HPF.
Extended Data Figure 5.
Extended Data Figure 5.. Exogenous delivery of Cre recombinase via AAV vector to drive combined loss of CCM function and gain of PIK3CA function results in CCM formation in the adult brain.
a, A schematic of the experimental approach in which a cranial window is created and AAV-Cre virus injected into the brains of 2 month old mice with serial imaging at post-operative days 1, 7, 10, 14, 18, and 21. b, Representative visual images of brains harvested 21 days after injection of AAV-Cre into adult animals. Dotted circles indicate the site of cranial window and AAV-Cre injection. Includes visual images displayed in Figure 1. Scale bars, 1mm. c, Serial images obtained through the same cranial window of mice of indicated genotypes following injection of AAV-Cre. iPik3caH1047R designation includes iPik3caH1047R and/or Krit1fl/+;iPik3caH1047R genotypes. White arrows indicate cavernous malformations in Krit1fl/fl;iPik3caH1047R mice. Black arrows indicate hypervascularity in iPik3caH1047R mice. d, Peri-lesional iron deposition stain in brains indicative of chronic bleed from four independent Krit1fl/fl;iPik3caH1047R mice at post-op day 21. Scale bars, 200 microns.
Extended Data Figure 6.
Extended Data Figure 6.. Lineage tracing of AAV-Cre activity after direct injection into the mouse brain.
AAV-Cre virus was injected into the brain of Ai14 Cre reporter animals and Cre activity assessed by detection of the tdTomato (RFP) reporter 14 days after injection. a-c, Confocal microscopic overview from a, the injection site; b, the border region of the viral spread and c, the contralateral cortex of AAV-Cre injected Ai14 mice two weeks after stereotactic injection. AAV-Cre transduced cells expressed red fluorescent protein (RFP) (shown in white). RFP-positive vessels were identified by colocalization with PECAM1 (shown in red). White arrows point to representative RFP-positive vessels. Yellow arrowheads point to RFP-expressing neuronal cells. Scale bar, 100 microns. Boxed regions in 1 and 2 are shown at higher magnification on the right. 1 & 2 show PECAM1 staining for endothelial cells overlaid with RFP signal; 1’ & 2’ show PECAM staining alone; 1” & 2” shown RFP staining alone. These data are representative 12 separate images from 8 tissue sections from n=2 individual animals. Scale bar, 20 microns.
Extended Data Figure 7.
Extended Data Figure 7.. Characterization of single-nucleus DNA sequencing of human CCM samples.
a, The relationship between somatic PIK3CA and CCM mutations detected in bulk sequencing is graphed. Points indicate individual mutations in either a CCM gene or PIK3CA. Lines connect the CCM gene and PIK3CA gene mutations present in a single sample. Box plots show the aggregate frequencies of PIK3CA and CCM mutations. Center lines show the medians; box limits indicate the 25th and 75th percentiles; whiskers extend 1.5 times the interquartile range from the 25th to 75th percentiles, outliers are represented by dots. n = 21 sample points for both plots. b, Representative FANS plots of unstained (top row) and DAPI stained (bottom row) CCM homogenate. Doublet discrimination by forward scatter profile for DAPI stained sample. Plots consist of 100,000 events. The unstained sample contains 1 event (0%) in the DAPI+ singlet gate. The DAPI stained samples contains 2,414 events (2.4%) in the DAPI+ singlet gate. c, Total reads and average coverage per nucleus from snDNAseq for each mutation detected by bulk sequencing. Dotted line shows 20x coverage, the minimum cutoff used for establishing genotype. d, Pseudobulk allele frequency from snDNA-seq for each mutation detected by bulk sequencing. Dotted line shows 1% allele frequency. Note the data point with the arrow in c-d shows a mutation in sample 5079 detected in bulk sequencing which, due to poor amplification during snDNA-seq, received insufficient coverage per nucleus (4.5x) to establish nuclear genotypes however is clearly present in pseudobulk reads (1849/9814). e, Comparison of mutation allele frequency as detected by bulk and snDNA-seq. As nuclei are diploid for the relevant autosomes, the x-axis is equal to the fraction of mutant nuclei divided by two. Dotted line shows perfect correlation at x=y. R and p were calculated by Pearson’s correlation coefficient. f, A summary of snDNA-seq results for 3 sporadic and 2 familial CCMs analyzed is shown. The number of nuclei with each possible genotype are listed. + indicates a wild-type allele; * indicates a mutant allele. Note that only 1 somatic CCM mutation was identified in samples 5038 and 5079. P values were determined by two-tailed chi-squared test between the observed and expected triple mutant nuclei (or double mutant for lesions 5038 and 5079) determined by Poisson distribution (see Methods).
Extended Data Figure 8.
Extended Data Figure 8.. PI3K signaling does not augment MEKK3-KLF2/4 signaling.
a, Diagram of how gain of PI3K signaling might augment CCM formation by acting upstream of MEKK3-KLF2/4 signaling in endothelial cells. b, Immunostaining for KLF4 and the endothelial cell marker PECAM1 in hindbrain sections from P6 control, Krit1BECKO, Pik3caiBECGOF, and Krit1iBECKO;Pik3caiBECGOF neonates with either a susceptible (Susc) or resistant (Res) gut microbiome is shown. White arrows indicate endothelial cell nuclear KLF4 staining. Immunofluorescence images representative of 10 tissue sections from n=4 individual animals/genotype. Control animals are either Slco1c1-Cre;Krit1fl/+ or Krit1fl/fl. Scale bars, 50 microns. c, Measurement of Klf2 and Klf4 mRNA in endothelial cells isolated from the hindbrains of P6 control, Krit1BECKO and Pik3caiBECGOF neonates. (Control, n=8; Krit1BECKO, n=6; Pik3caiBECGOF, n=8). d, Measurement of KLF2 and KLF4 mRNA in human umbilical vein endothelial cells (HUVECs) treated with the indicated siRNAs or lentiviral vectors. (n=6 individual wells/group over 2 independent experiments). Data are mean ± s.e.m. Unpaired, two-tailed Welch’s t-test.
Extended Data Figure 9.
Extended Data Figure 9.. The CCM effector KLF4 augments endothelial cell PI3K-mTORC1 signaling.
a, Schematic of neonatal endothelial induction of KLF4 expression in KLF4iBECGOF animals. b, Immunostaining for KLF4 and the endothelial cell marker PECAM1 in hindbrain sections from P6 control and KLF4iBECGOF animals is shown. Boxes in upper images denote area of magnified image immediately below. Immunofluorescence images representative of 6 tissue sections from n=4 individual animals/genotype. Scale bars, 50 microns. c, H-E stained sections of hindbrain from control and KLF4iBECGOF littermates. Boxes in upper images denote area of magnified image immediately below. Black arrows indicate lesions. Dotted lines outline the white matter of the cerebellum. wm, white matter. Note the dilated white matter venules similar to those observed with CCM loss of function and PIK3CA gain of function shown in Extended Data Figure 2. H-E histology representative of 6 tissue sections from n=4 animals/genotype. Scale bars, 0.1mm. d, Immunostaining for phospho-S6 ribosomal protein (p-S6) and the endothelial cell marker PECAM1 in hindbrain sections from P6 control and KLF4iBECGOF animals is shown. White arrows indicate p-S6 positive endothelial cells. Yellow arrowheads into non-endothelial p-S6 positive cells. Immunofluorescence images representative of 6 tissue sections from n=4 individual animals/genotype. Scale bars, 50 microns. e, Immunoblot detection of KLF4, KLF4-GFP, the KLF4 target gene eNOS in HUVECs without and with inducible lentiviral expression of KLF4-GFP (“iKLF4” cells) or control lentivirus. TUBULIN is shown as a loading control.
Extended Data Figure 10.
Extended Data Figure 10.. Rapamycin rescue of CCM formation is independent of KLF4.
a, A schematic of the experimental approach in which a cranial window is created and AAV-Cre virus injected into the brains of 2 month old mice and along with daily injection of vehicle, 100ug of Rapamycin (Rapa-low), or 400ug of Rapamycin (Rapa-high) started at post-op day 7 continuing through post-op day 21 with serial imaging at post-op day 1, 7, 10, 14, 18, and 21. b, Representative visual images of brains harvested 21 days after injection of AAV-Cre and 2 weeks of daily vehicle or rapamycin (low dose/high dose) treatment in Krit1fl/fl;iPik3caH1047R mice. Dotted circles indicate the site of cranial window and AAV-Cre injection. Arrows indicate detached lesions. Scale bars, 1mm. c, Serial images obtained through the same cranial window of Krit1fl/fl;iPik3caH1047R mice following injection of AAV-Cre and subsequent treatment. Arrows indicate formation and growth of individual cavernous malformations. d, MicroCT quantitation of lesion volumes 21 days after creation of the cranial window and injection of AAV-Cre. Values include duplication of microCT values in Figure 4 (vehicle and low dose treatments). (Vehicle, n=6; Rapa-low, n=7; Rapa-high, n=7). Data are mean ± s.e.m. Unpaired, two-tailed Welch’s t-test. e, Schematic of neonatal endothelial induction of Krit1 deletion and treatment with Rapamyin or vehicle control at P2. f, Immunostaining of hindbrain sections from P6 Krit1iBECKO animals treated with vehicle or Rapamycin for PECAM1 and p-S6. White arrows indicate p-S6 positive endothelial cells in the control but not the Rapmycin treated animal. Yellow arrowheads indicate p-S6 positive neuronal cells. g, Immunostaining of hindbrain sections from P6 Krit1iBECKO animals treated with vehicle or Rapamycin for PECAM1 and KLF4. White arrows indicate KLF4-positive endothelial cells detected in the control and in the Rapmycin treated animal. Scale bars, 50 microns.
Figure 1.
Figure 1.. CCM LOF and PIK3CA GOF synergize during cavernous malformation in the neonatal brain and are both required for malformations in the adult brain.
a, Schematic of neonatal induction of Krit1 deletion and/or PIK3CAH1047R expression. 4-hydroxytamoxifen (4OHT) injection at P1 was used to inducibly delete Krit1 (Krit1iBECKO), drive expression of PIK3CAH1047R (Pik3caiBECGOF) or both specifically in the brain endothelial cells of mice carrying a resistant gut microbiome. b, Representative visual and microCT images of the indicated P7 brains. Note that loss of KRIT1 alone is not sufficient for CCM formation in animals with a resistant microbiome. Scale bars, 1mm. c, MicroCT quantitation of lesion volumes at P7. (Krit1iBECKO, n=4; Pik3caiBECGOF, n=12; Krit1iBECKO;Pik3caiBECGOF , n=6). Indicated p-values are: p=0.0002; p=0.0001; p=8e−8 (top to bottom). d, Schematic and diagram of the experimental approach in which a cranial window is created and AAV virus injected into the brains of 2 month old mice with serial imaging on indicated post-operative days (POD). e, Serial images obtained through the same cranial window of Krit1fl/fl;iPik3caH1047R animals following injection of control or Cre-expressing AAV vectors. Cranial window images representative of 4 animals/group. f, Representative visual and microCT images of brains harvested 21 days after injection of AAV-Cre into adult animals with the indicated genotypes. iPik3caH1047R designation includes iPik3caH1047R and/or Krit1fl/+;iPik3caH1047R genotypes. Dotted circles indicate the site of cranial window and AAV-Cre injection. Scale bars, 1mm. g, MicroCT quantitation of lesion volumes 21 days after injection of AAV-Cre. (Krit1fl/fl, n=4; iPik3caH1047R, n=9; Krit1fl/fl;iPik3caH1047R, n=10). Indicated p-values are: p=0.0144; p=0.0140; p=0.4174 (top to bottom). Data are mean ± s.e.m. Unpaired, two-tailed Welch’s t-test. ns indicates p not significant, p>0.05; *indicates p<0.05; ***indicates p<0.001; ****indicates p<0.0001.
Figure 2.
Figure 2.. GOF PIK3CA mutations and LOF CCM gene mutations co-exist in the same cell in human CCMs.
a, A schematic summary of the somatic PIK3CA mutations, the germline mutations in KRIT1, CCM2 and PDCD10, and the somatic mutations in KRIT1, CCM2 and PDCD10 as identified in 79 human CCMs via bulk sequencing of frozen resected tissue is shown. Color denotes the affected CCM gene. Samples listed as neither familial nor sporadic are deidentified banked CCMs lacking either clinical information or genetic evidence supporting either classification. indicates familial CCMs with an activating mutation in PIK3CA and both germline and somatic mutations in a CCM gene. indicates known or presumed sporadic CCMs with an activating mutation in PIK3CA and two somatic mutations in a CCM gene. b, Percentage of lesions with an activating mutation in PIK3CA present in all sequenced CCMs vs. control brain AVMs, all three forms of familial CCMs and sporadic CCMs. The value inside the bar shows the number of samples in the corresponding group. c, The distributions of the 16 most common somatic PIK3CA mutations identified in human CCMs (top) and cancer (bottom) as reported in the COSMIC database are shown. Colored boxes represent domains in PIK3CA in order from left to right: Adaptor BD, RAS BD, C2, Kinase. d, Schematic of workflow for processing frozen surgically-resected human CCM lesions for single-nucleus DNA sequencing. e, Representative data for sporadic and familial CCMs detailing the number of nuclei with each combination of PIK3CA and CCM mutations. p was determined by two-tailed chi-squared test between the observed and expected triple mutant nuclei predicted by a Poisson distribution (see Methods). ns indicates p not significant, p>0.05; ***indicates p<1e−16.
Figure 3.
Figure 3.. Endothelial CCM LOF augments PI3K-mTORC1 signaling through KLF4.
a, Immunostaining for phospho-S6 ribosomal protein (p-S6) and endothelial cell (EC) marker PECAM1 in P6 hindbrain sections with a resistant (Res) or susceptible (Susc) microbiome. White arrows indicate p-S6 positive ECs, yellow arrowheads indicate non-endothelial p-S6 positive cells in a and g. Scale bars, 50 microns. b, Immunoblot detection of phospho-AKT (p-AKT) and p-S6 in ECs from the hindbrains of P6 control and Krit1BECKO littermates. GAPDH loading control. c, Quantitation of immunoblotting for p-AKT and p-S6 relative to total AKT and S6 protein. (n=8 hindbrains/group) Indicated p-values are: p=0.0010; p=0.0003; p=0.5205 (left to right). d, Immunoblot detection of p-AKT and p-S6 in cultured HUVECs treated with scrambled or KRIT1 siRNAs. e, Quantitation of immunoblotting for p-AKT and p-S6 relative to total AKT and S6 protein. (n=8 individual wells/group over 4 independent experiments). Indicated p-values are: p=0.0002; p=7e−6; p=0.1208 (left to right). f, Visual images of P6 control and KLF4iBECGOF littermates. Images representative of 8 animals/group. Scale bars, 1mm. g, Immunostaining for p-S6 and PECAM1 in hindbrain sections from P6 control and KLF4iBECGOF littermates. Scale bars, 50 microns. h, Immunoblot detection of p-AKT and p-S6 in HUVECs with expression of KLF4-GFP (“iKLF4” cells) or control lentivirus. Tubulin loading control. i, Quantitation of immunoblotting for p-AKT and p-S6 relative to total AKT and S6 in control and iKLF4 HUVECs. (n=6 individual wells/group over 3 independent experiments). p=0.0067; p=9e−7; p=0.0022 (left to right). j, Pathway schematic of how gain of CCM-MEKK3-KLF2/4 signaling is proposed to augment PI3K-mTORC1 signaling to drive CCM formation. Immunofluorescence in a and g representative of 10 tissue sections from n=4 individual animals/genotype. Data are mean ± s.e.m. Unpaired, two-tailed Welch’s t-test. ns indicates p not significant, p>0.05; **indicates p<0.01; ***indicates p<0.001; ****indicates p<0.0001. For gel source data, see Supplementary Figure 1.
Figure 4.
Figure 4.. Rapamycin prevents lesion formation due to CCM LOF and KLF4 GOF in neonatal and adult mice.
a, Schematic of neonatal Krit1BECKO animals with a susceptible microbiome administered a single dose treatment with Rapamycin or vehicle on P2. b, Representative visual and microCT images of the hindbrains of littermates treated with either vehicle or Rapamycin. Scale bars, 1mm. c, MicroCT quantitation of lesion volumes normalized to total brain volume following treatment with vehicle or Rapamycin. (Vehicle, n=13; Rapamycin, n=16). p=0.0009. d, Experimental design for Rapamycin or vehicle treatment of adult animals with combined CCM LOF and PIK3CA GOF (Krit1fl/fl;iPik3caH1047R) using cranial window surgery and AAV injection is shown. e, Representative visual and microCT images of brains harvested 21 days after injection of AAV-Cre into littermate animals. Dotted circles indicate the site of cranial window and AAV-Cre injection. Scale bars, 1mm. f, MicroCT quantitation of lesion volumes 21 days after creation of the cranial window and injection of AAV-Cre is shown. (Vehicle, n=6; Rapamycin, n=7). p=0.0358. g, Schematic of neonatal KLF4iBECGOF animals administered a single dose treatment with Rapamycin or vehicle followed by induction of KLF4 expression on P10. h, Representative visual and microCT images of the hindbrains of littermates treated with either vehicle or Rapamycin. Scale bars, 1mm. i, MicroCT quantitation of lesion volumes normalized to total brain volume following treatment of the indicated mice with vehicle or Rapamycin. (Vehicle, n=20; Rapamycin, n=22). p=4e−5. Data are mean ± s.e.m. Unpaired, two-tailed Welch’s t-test. *indicates p<0.05; ***indicates p<0.001; ****indicates p<0.0001.

References

    1. Cuttano R et al. KLF4 is a key determinant in the development and progression of cerebral cavernous malformations. EMBO Mol Med, (2015). - PMC - PubMed
    1. Zhou Z et al. Cerebral cavernous malformations arise from endothelial gain of MEKK3-KLF2/4 signalling. Nature 532, 122–126, (2016). - PMC - PubMed
    1. Renz M et al. Regulation of beta1 integrin-Klf2-mediated angiogenesis by CCM proteins. Dev Cell 32, 181–190, (2015). - PubMed
    1. Otten C et al. Systematic pharmacological screens uncover novel pathways involved in cerebral cavernous malformations. EMBO Mol Med 10, (2018). - PMC - PubMed
    1. Tang AT et al. Endothelial TLR4 and the microbiome drive cerebral cavernous malformations. Nature 545, 305–310, (2017). - PMC - PubMed

Methods References

    1. Wang Y et al. Ephrin-B2 controls VEGF-induced angiogenesis and lymphangiogenesis. Nature 465, 483–486, (2010). - PubMed
    1. Ridder DA et al. TAK1 in brain endothelial cells mediates fever and lethargy. J Exp Med 208, 2615–2623, (2011). - PMC - PubMed
    1. Claxton S et al. Efficient, inducible Cre-recombinase activation in vascular endothelium. Genesis 46, 74–80, (2008). - PubMed
    1. Chan AC et al. Mutations in 2 distinct genetic pathways result in cerebral cavernous malformations in mice. J Clin Invest 121, 1871–1881, (2011). - PMC - PubMed
    1. Foster KW et al. Induction of KLF4 in basal keratinocytes blocks the proliferation-differentiation switch and initiates squamous epithelial dysplasia. Oncogene 24, 1491–1500, (2005). - PMC - PubMed

Publication types

MeSH terms