Association Between Hurricane Sandy and Emergency Department Visits in New York City by Age and Cause
- PMID: 33910231
- PMCID: PMC8576377
- DOI: 10.1093/aje/kwab127
Association Between Hurricane Sandy and Emergency Department Visits in New York City by Age and Cause
Abstract
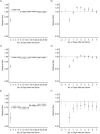
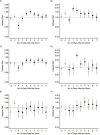
The magnitude, timing, and etiology of morbidity associated with tropical cyclones remains incompletely quantified. We examined the relative change in cause-specific emergency department (ED) visits among residents of New York City during and after Hurricane Sandy, a tropical cyclone that affected the northeastern United States in October 2012. We used quasi-Poisson constrained distributed lag models to compare the number of ED visits on and after Hurricane Sandy with all other days, 2005-2014, adjusting for temporal trends. Among residents aged ≥65 years, Hurricane Sandy was associated with a higher rate of ED visits due to injuries and poisoning (relative risk (RR) = 1.19, 95% confidence interval (CI): 1.10, 1.28), respiratory disease (RR = 1.35, 95% CI: 1.21, 1.49), cardiovascular disease (RR = 1.10, 95% CI: 1.02, 1.19), renal disease (RR = 1.44, 95% CI: 1.22, 1.72), and skin and soft tissue infections (RR = 1.20, 95% CI: 1.03, 1.39) in the first week following the storm. Among adults aged 18-64 years, Hurricane Sandy was associated with a higher rate of ED visits for renal disease (RR = 2.15, 95% CI: 1.79, 2.59). Among those aged 0-17 years, the storm was associated with lower rates of ED visits for up to 3 weeks. These results suggest that tropical cyclones might result in increased health-care utilization due to a wide range of causes, particularly among older adults.
Keywords: New York City; cyclonic storms; emergency service; hospital; morbidity.
© The Author(s) 2021. Published by Oxford University Press on behalf of the Johns Hopkins Bloomberg School of Public Health. All rights reserved. For permissions, please e-mail: journals.permissions@oup.com.
Figures


Similar articles
-
Emergency Department Visits for Homelessness or Inadequate Housing in New York City before and after Hurricane Sandy.J Urban Health. 2016 Apr;93(2):331-44. doi: 10.1007/s11524-016-0035-z. J Urban Health. 2016. PMID: 26979519 Free PMC article.
-
Food and Waterborne Disease in the Greater New York City Area Following Hurricane Sandy in 2012.Disaster Med Public Health Prep. 2016 Jun;10(3):503-11. doi: 10.1017/dmp.2016.85. Epub 2016 May 16. Disaster Med Public Health Prep. 2016. PMID: 27181600
-
Temporal and Spatial Patterns in Utilization of Mental Health Services During and After Hurricane Sandy: Emergency Department and Inpatient Hospitalizations in New York City.Disaster Med Public Health Prep. 2016 Jun;10(3):512-7. doi: 10.1017/dmp.2016.89. Disaster Med Public Health Prep. 2016. PMID: 27292172
-
Impact of Hurricanes on Injury-Related Emergency Department Visits, 2005–2016.2020 Nov 24. In: Healthcare Cost and Utilization Project (HCUP) Statistical Briefs [Internet]. Rockville (MD): Agency for Healthcare Research and Quality (US); 2006 Feb–. Statistical Brief #267. 2020 Nov 24. In: Healthcare Cost and Utilization Project (HCUP) Statistical Briefs [Internet]. Rockville (MD): Agency for Healthcare Research and Quality (US); 2006 Feb–. Statistical Brief #267. PMID: 33439601 Free Books & Documents. Review.
-
Immediate Injury Deaths Related to the Remnants From Hurricane Ida in New York City, September 1-2, 2021.Disaster Med Public Health Prep. 2024 Apr 5;18:e55. doi: 10.1017/dmp.2024.49. Disaster Med Public Health Prep. 2024. PMID: 38577778 Review.
Cited by
-
Emergency department visits respond nonlinearly to wildfire smoke.Proc Natl Acad Sci U S A. 2023 Sep 26;120(39):e2302409120. doi: 10.1073/pnas.2302409120. Epub 2023 Sep 18. Proc Natl Acad Sci U S A. 2023. PMID: 37722035 Free PMC article.
-
Impact of extreme weather events on healthcare utilization and mortality in the United States.Nat Med. 2024 Apr;30(4):1118-1126. doi: 10.1038/s41591-024-02833-x. Epub 2024 Feb 29. Nat Med. 2024. PMID: 38424213
-
Adverse Health Outcomes Following Hurricane Harvey: A Comparison of Remotely-Sensed and Self-Reported Flood Exposure Estimates.Geohealth. 2023 Apr 21;7(4):e2022GH000710. doi: 10.1029/2022GH000710. eCollection 2023 Apr. Geohealth. 2023. PMID: 37091294 Free PMC article.
-
The threaten of typhoons to the health of residents in inland areas: a study on the vulnerability of residents to death risk during typhoon "Lekima" : In Jinan, China.BMC Public Health. 2024 Feb 26;24(1):606. doi: 10.1186/s12889-024-17667-y. BMC Public Health. 2024. PMID: 38409004 Free PMC article.
-
Emergency department visits associated with satellite observed flooding during and following Hurricane Harvey.J Expo Sci Environ Epidemiol. 2021 Sep;31(5):832-841. doi: 10.1038/s41370-021-00361-1. Epub 2021 Jul 15. J Expo Sci Environ Epidemiol. 2021. PMID: 34267308 Free PMC article.
References
-
- National Oceanic and Atmospheric Administration . Tropical cyclone climatology. https://www.nhc.noaa.gov/climo/#overview. Accessed May 13, 2020.
-
- Shultz JM, Russell J, Espinel Z. Epidemiology of tropical cyclones: the dynamics of disaster, disease, and development. Epidemiol Rev. 2005;27(1):21–35. - PubMed
-
- Hendrickson LA, Vogt RL, Goebert D, et al. Morbidity on Kauai before and after Hurricane Iniki. Prev Med. 1997;26(5 Pt 1):711–716. - PubMed
-
- Curran T, Bogdanovski DA, Hicks AS, et al. The effects of Hurricane Sandy on trauma center admissions. Eur J Trauma Emerg Surg. 2018;44(1):137–141. - PubMed
-
- Platz E, Cooper HP, Silvestri S, et al. The impact of a series of hurricanes on the visits to two Central Florida emergency departments. J Emerg Med. 2007;33(1):39–46. - PubMed
Publication types
MeSH terms
Grants and funding
LinkOut - more resources
Full Text Sources
Medical

